. 2025 Feb;57(2):451-460.
doi: 10.1038/s41588-024-02036-7. Epub 2025 Jan 8.

Transcript-specific enrichment enables profiling of rare cell states via single-cell RNA sequencing

Affiliations

Transcript-specific enrichment enables profiling of rare cell states via single-cell RNA sequencing

Tsion Abay et al. Nat Genet. 2025 Feb.

Abstract

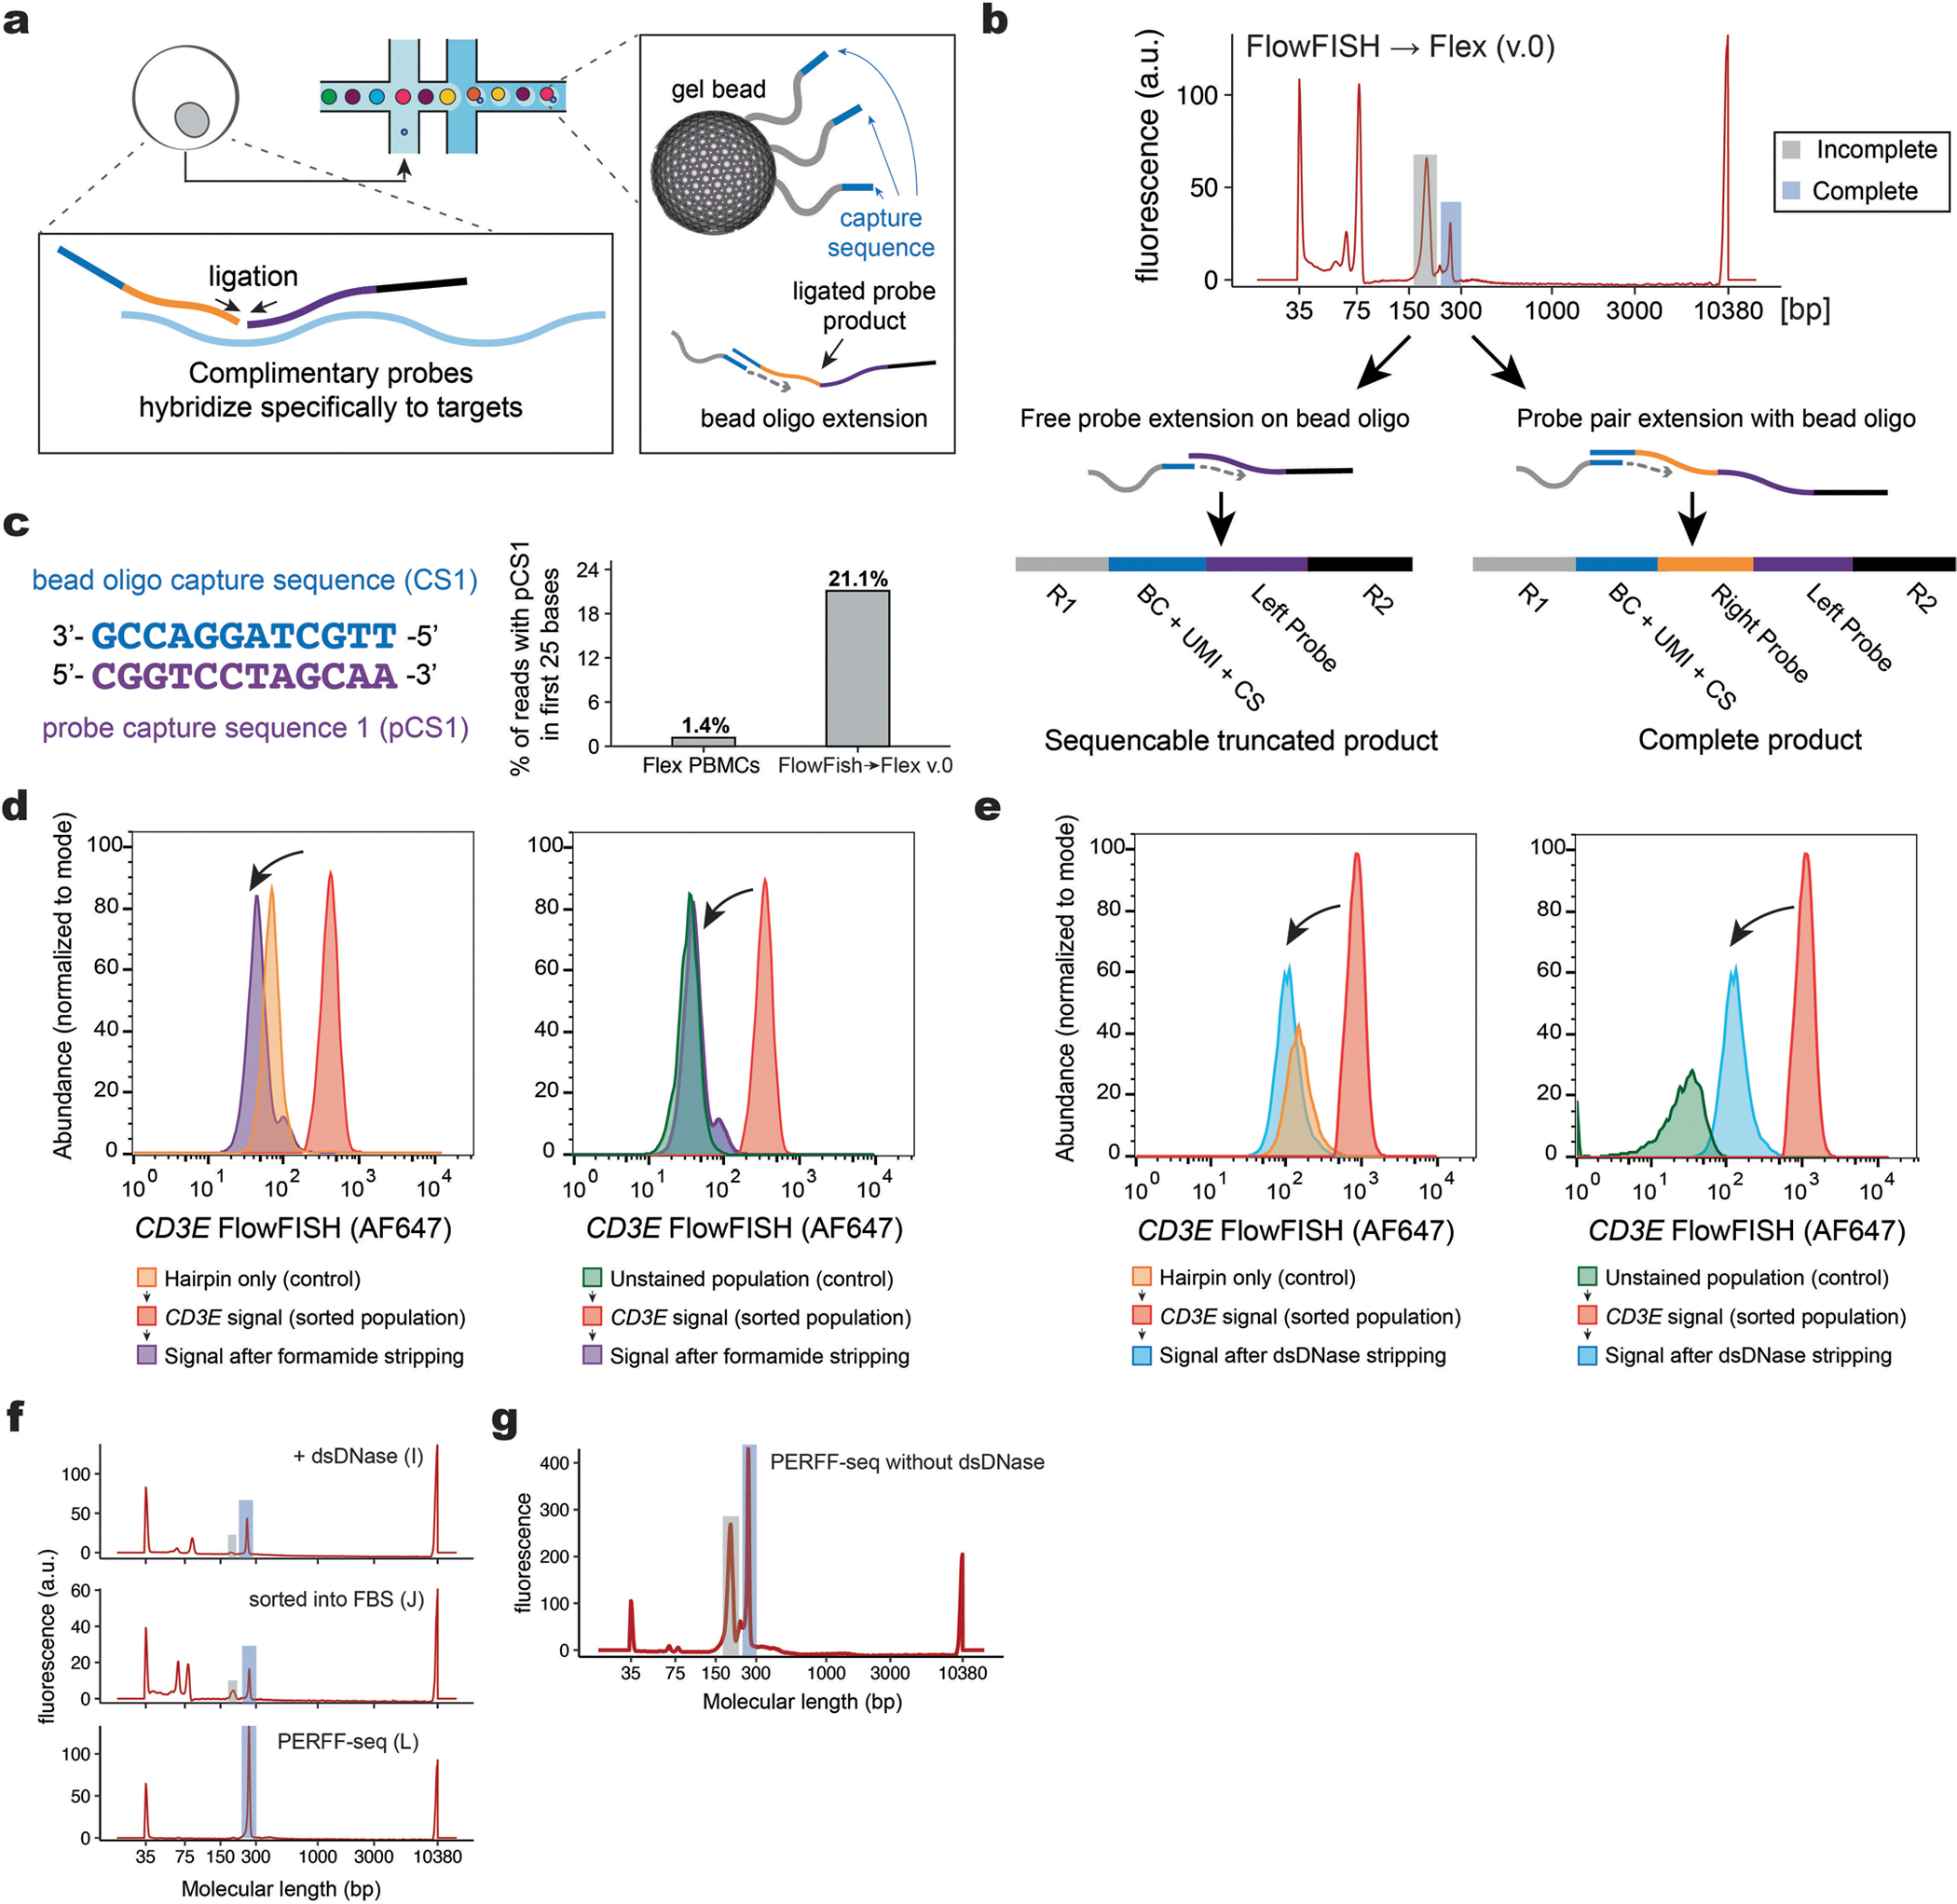
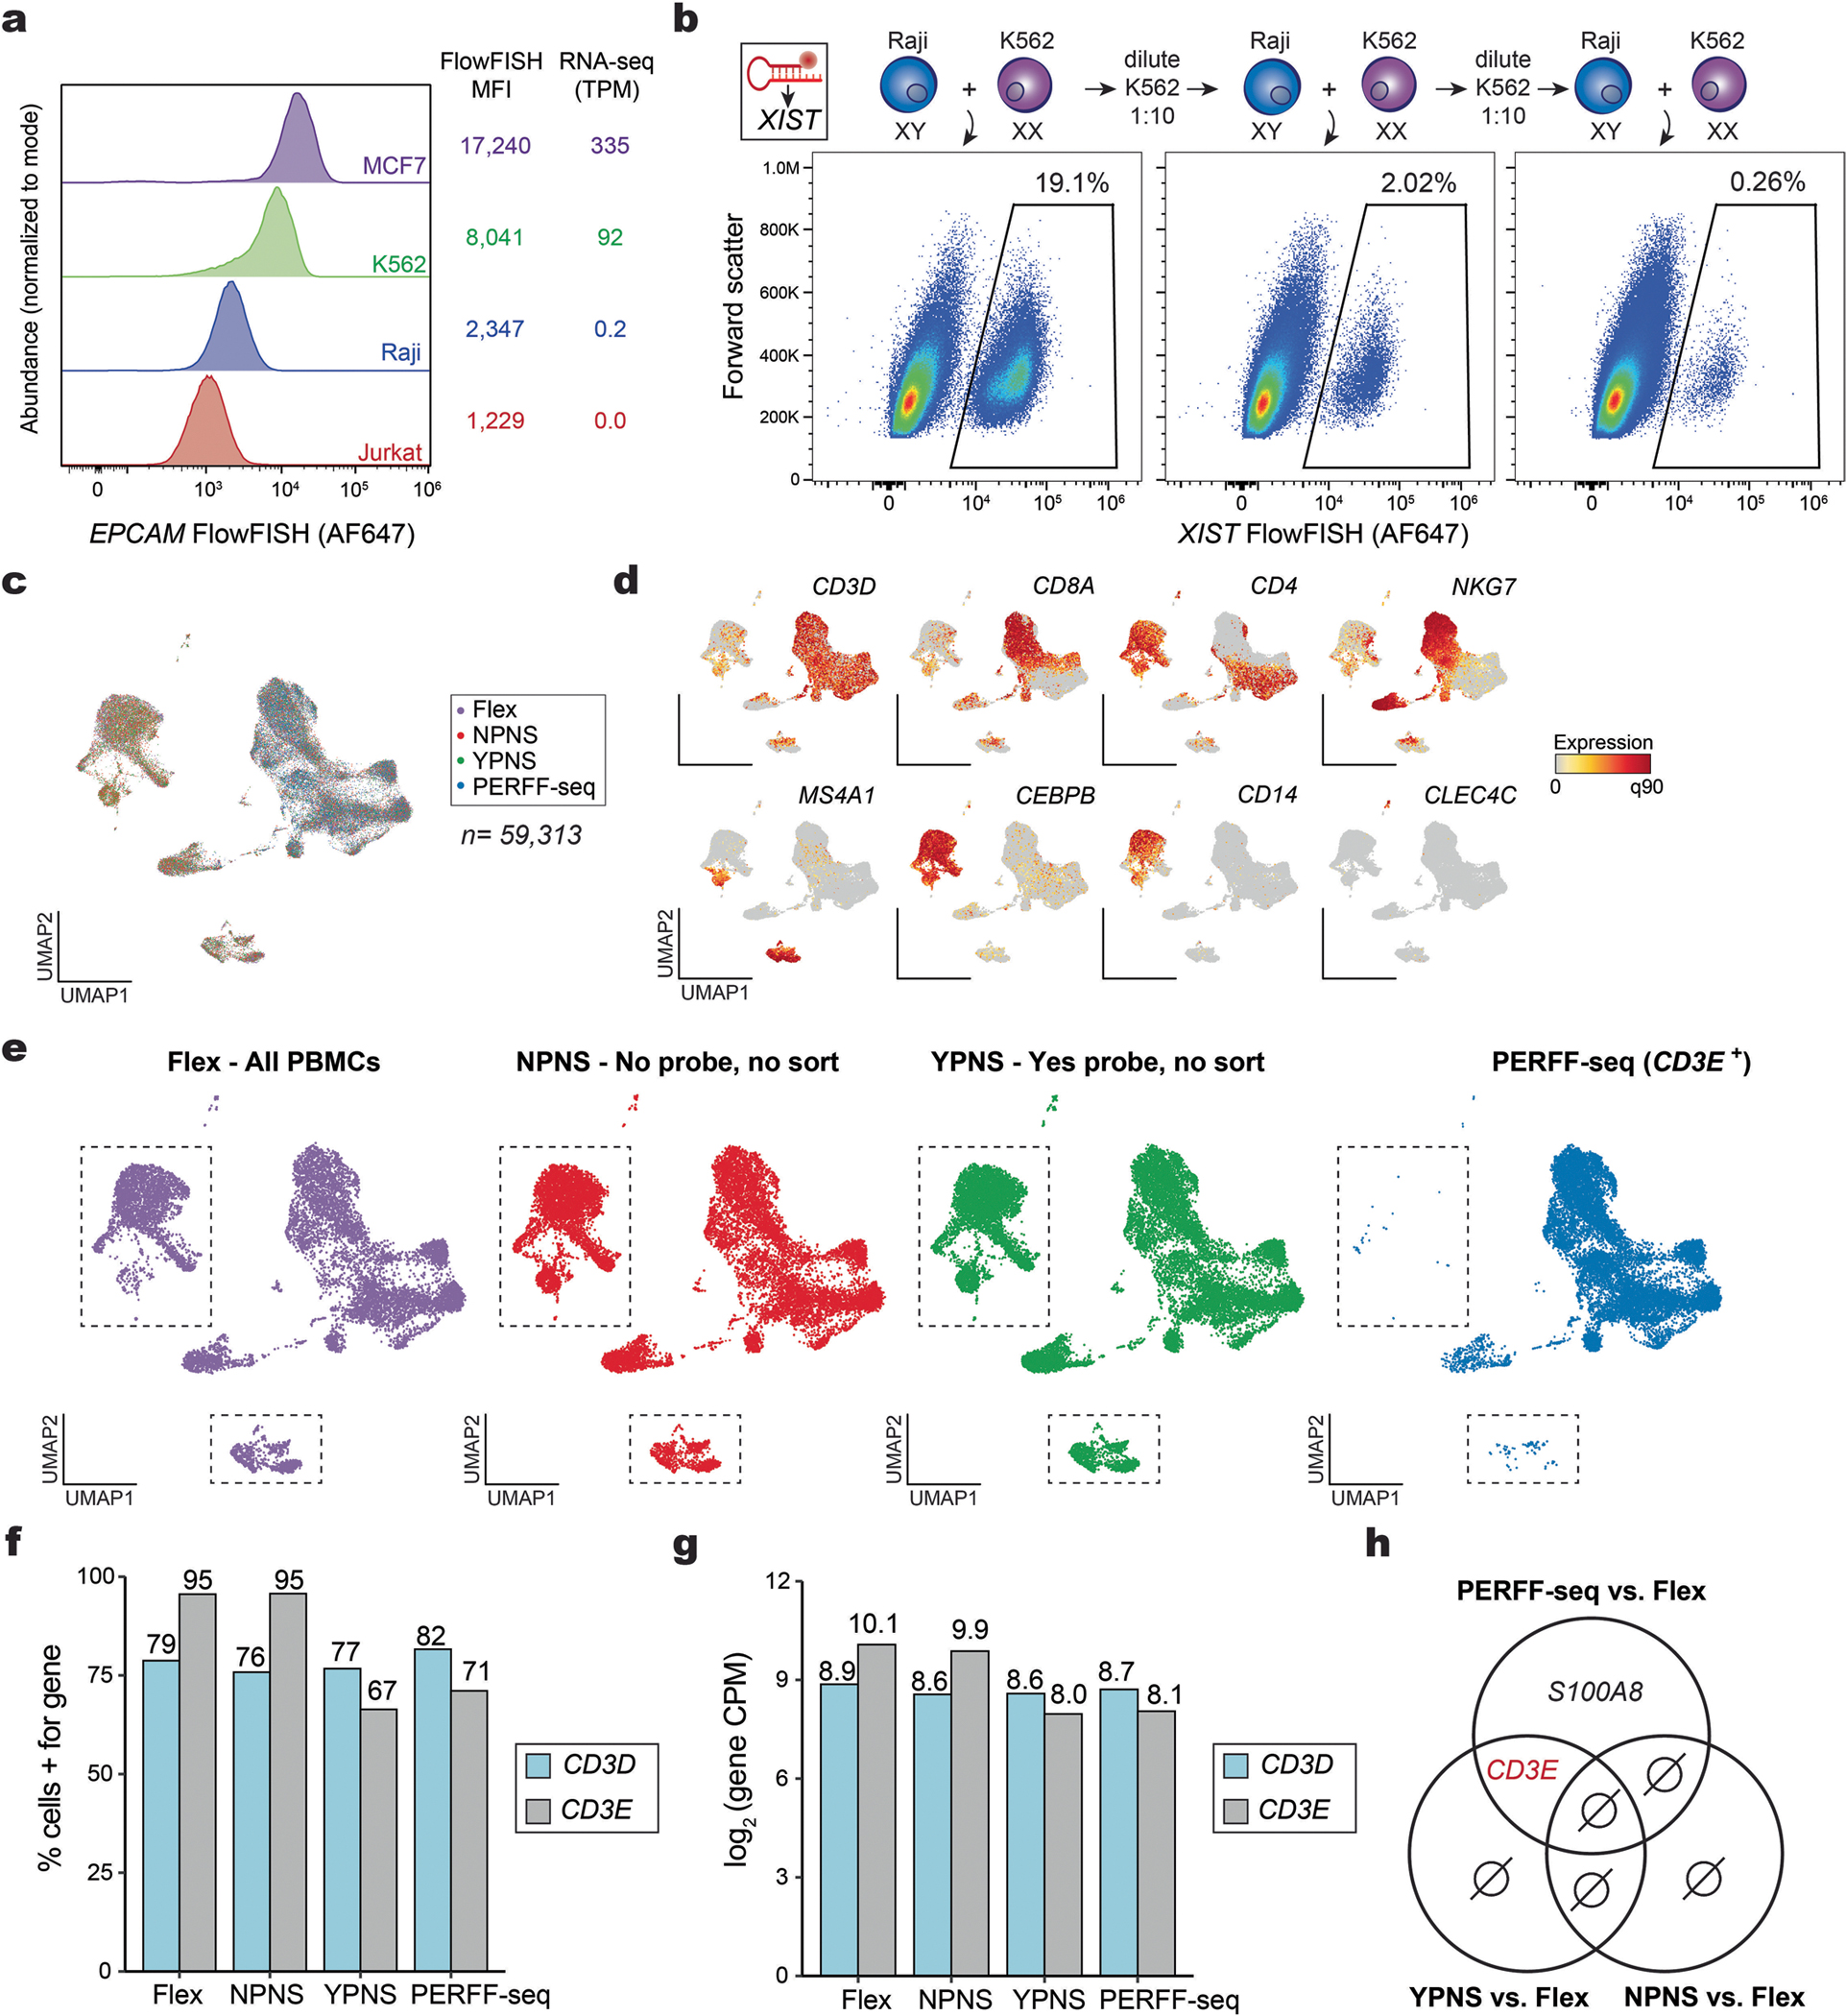
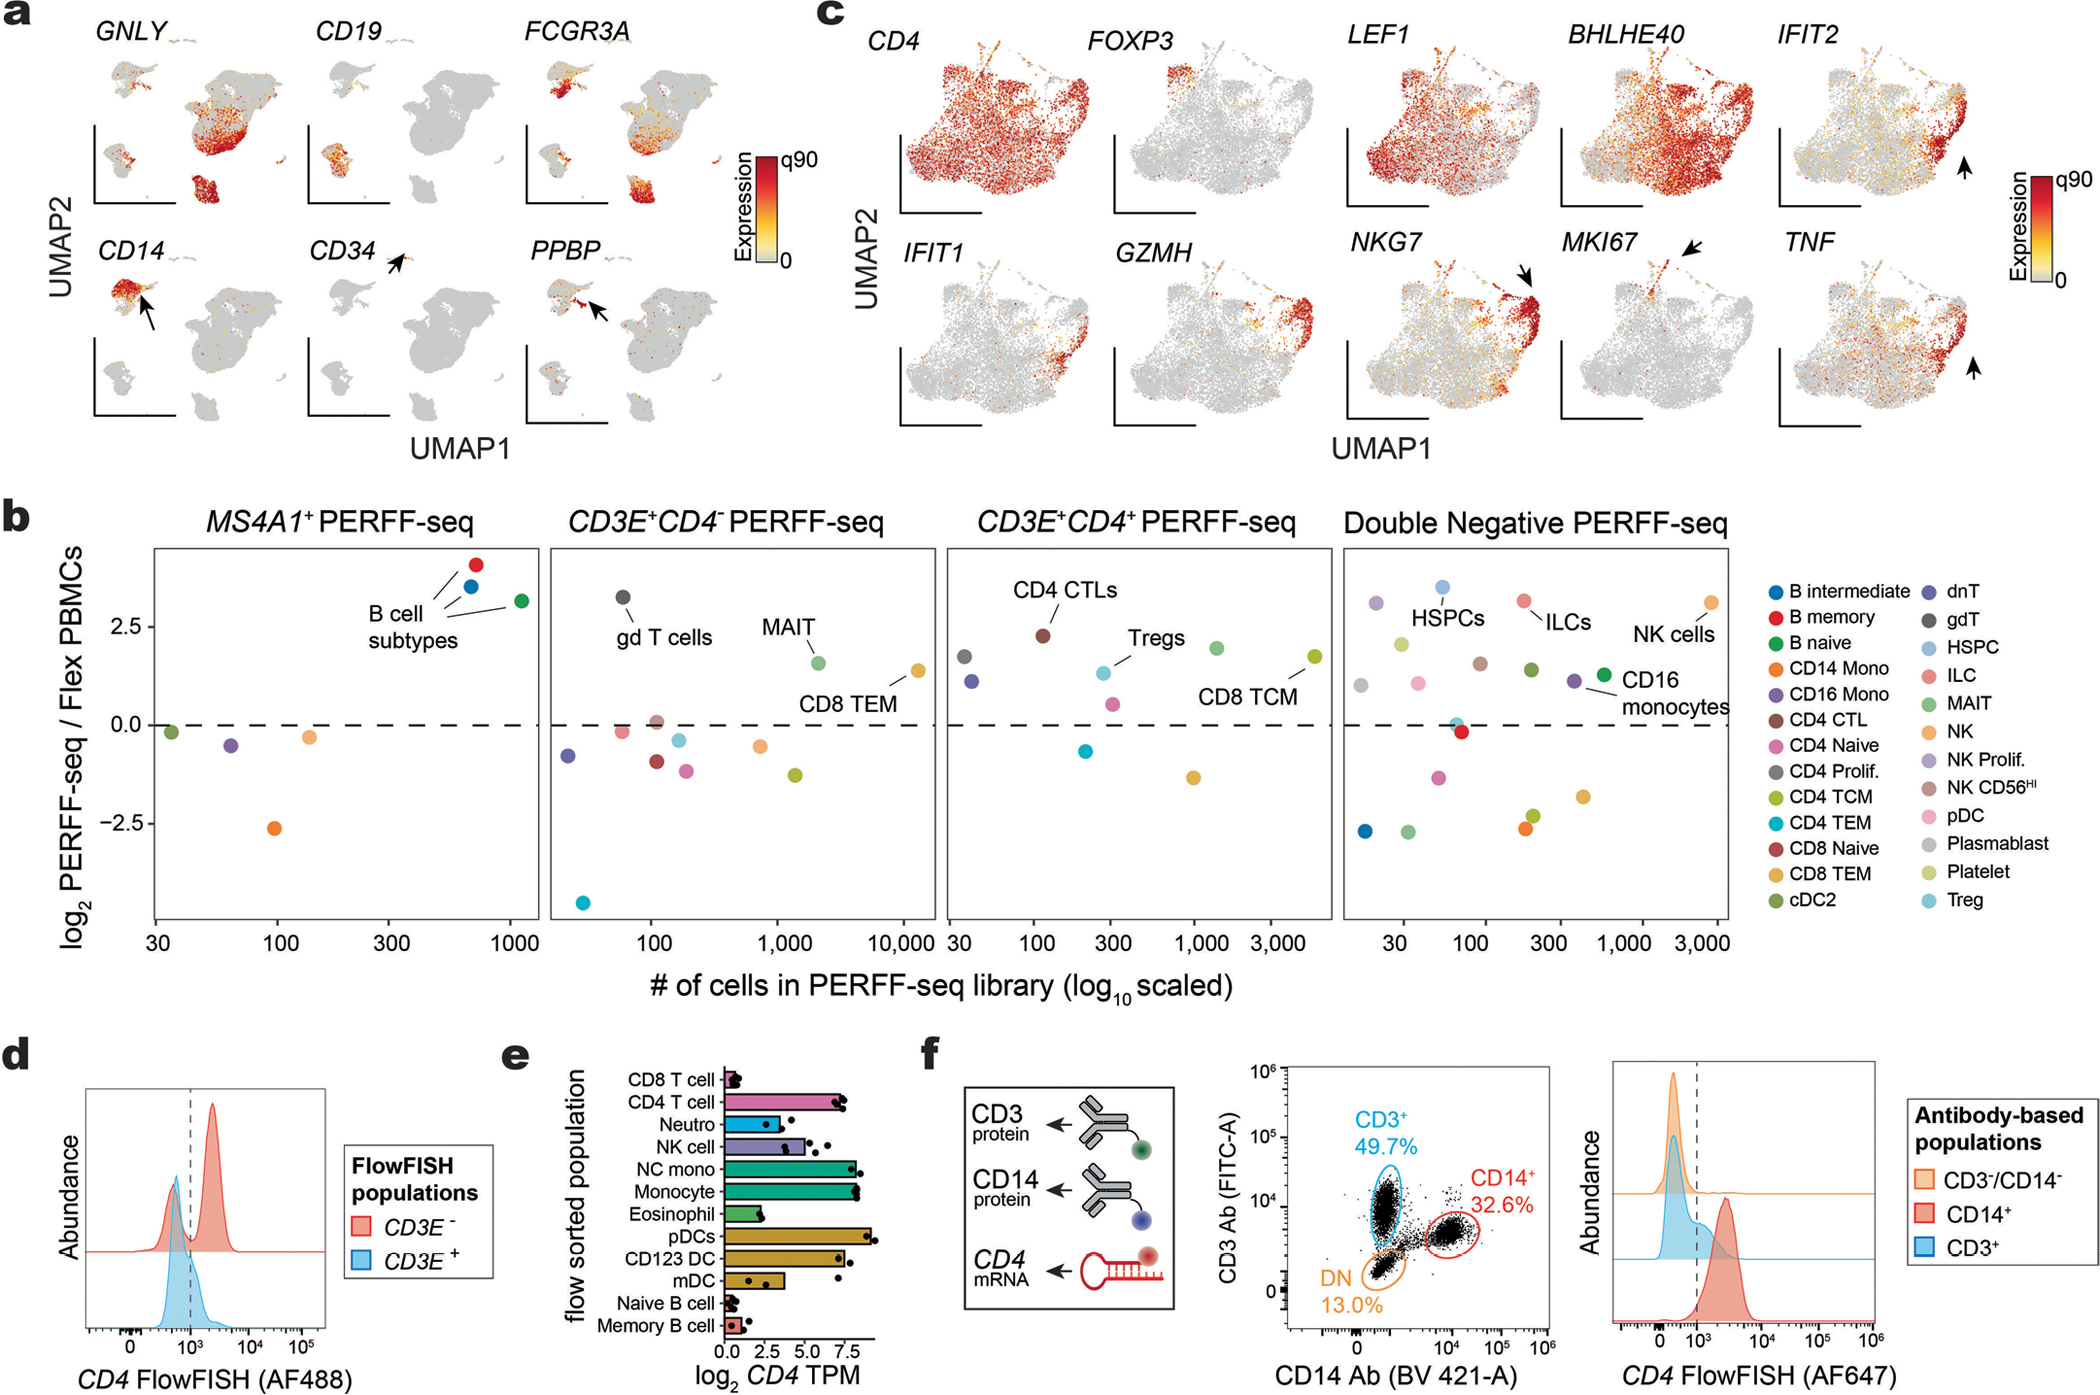
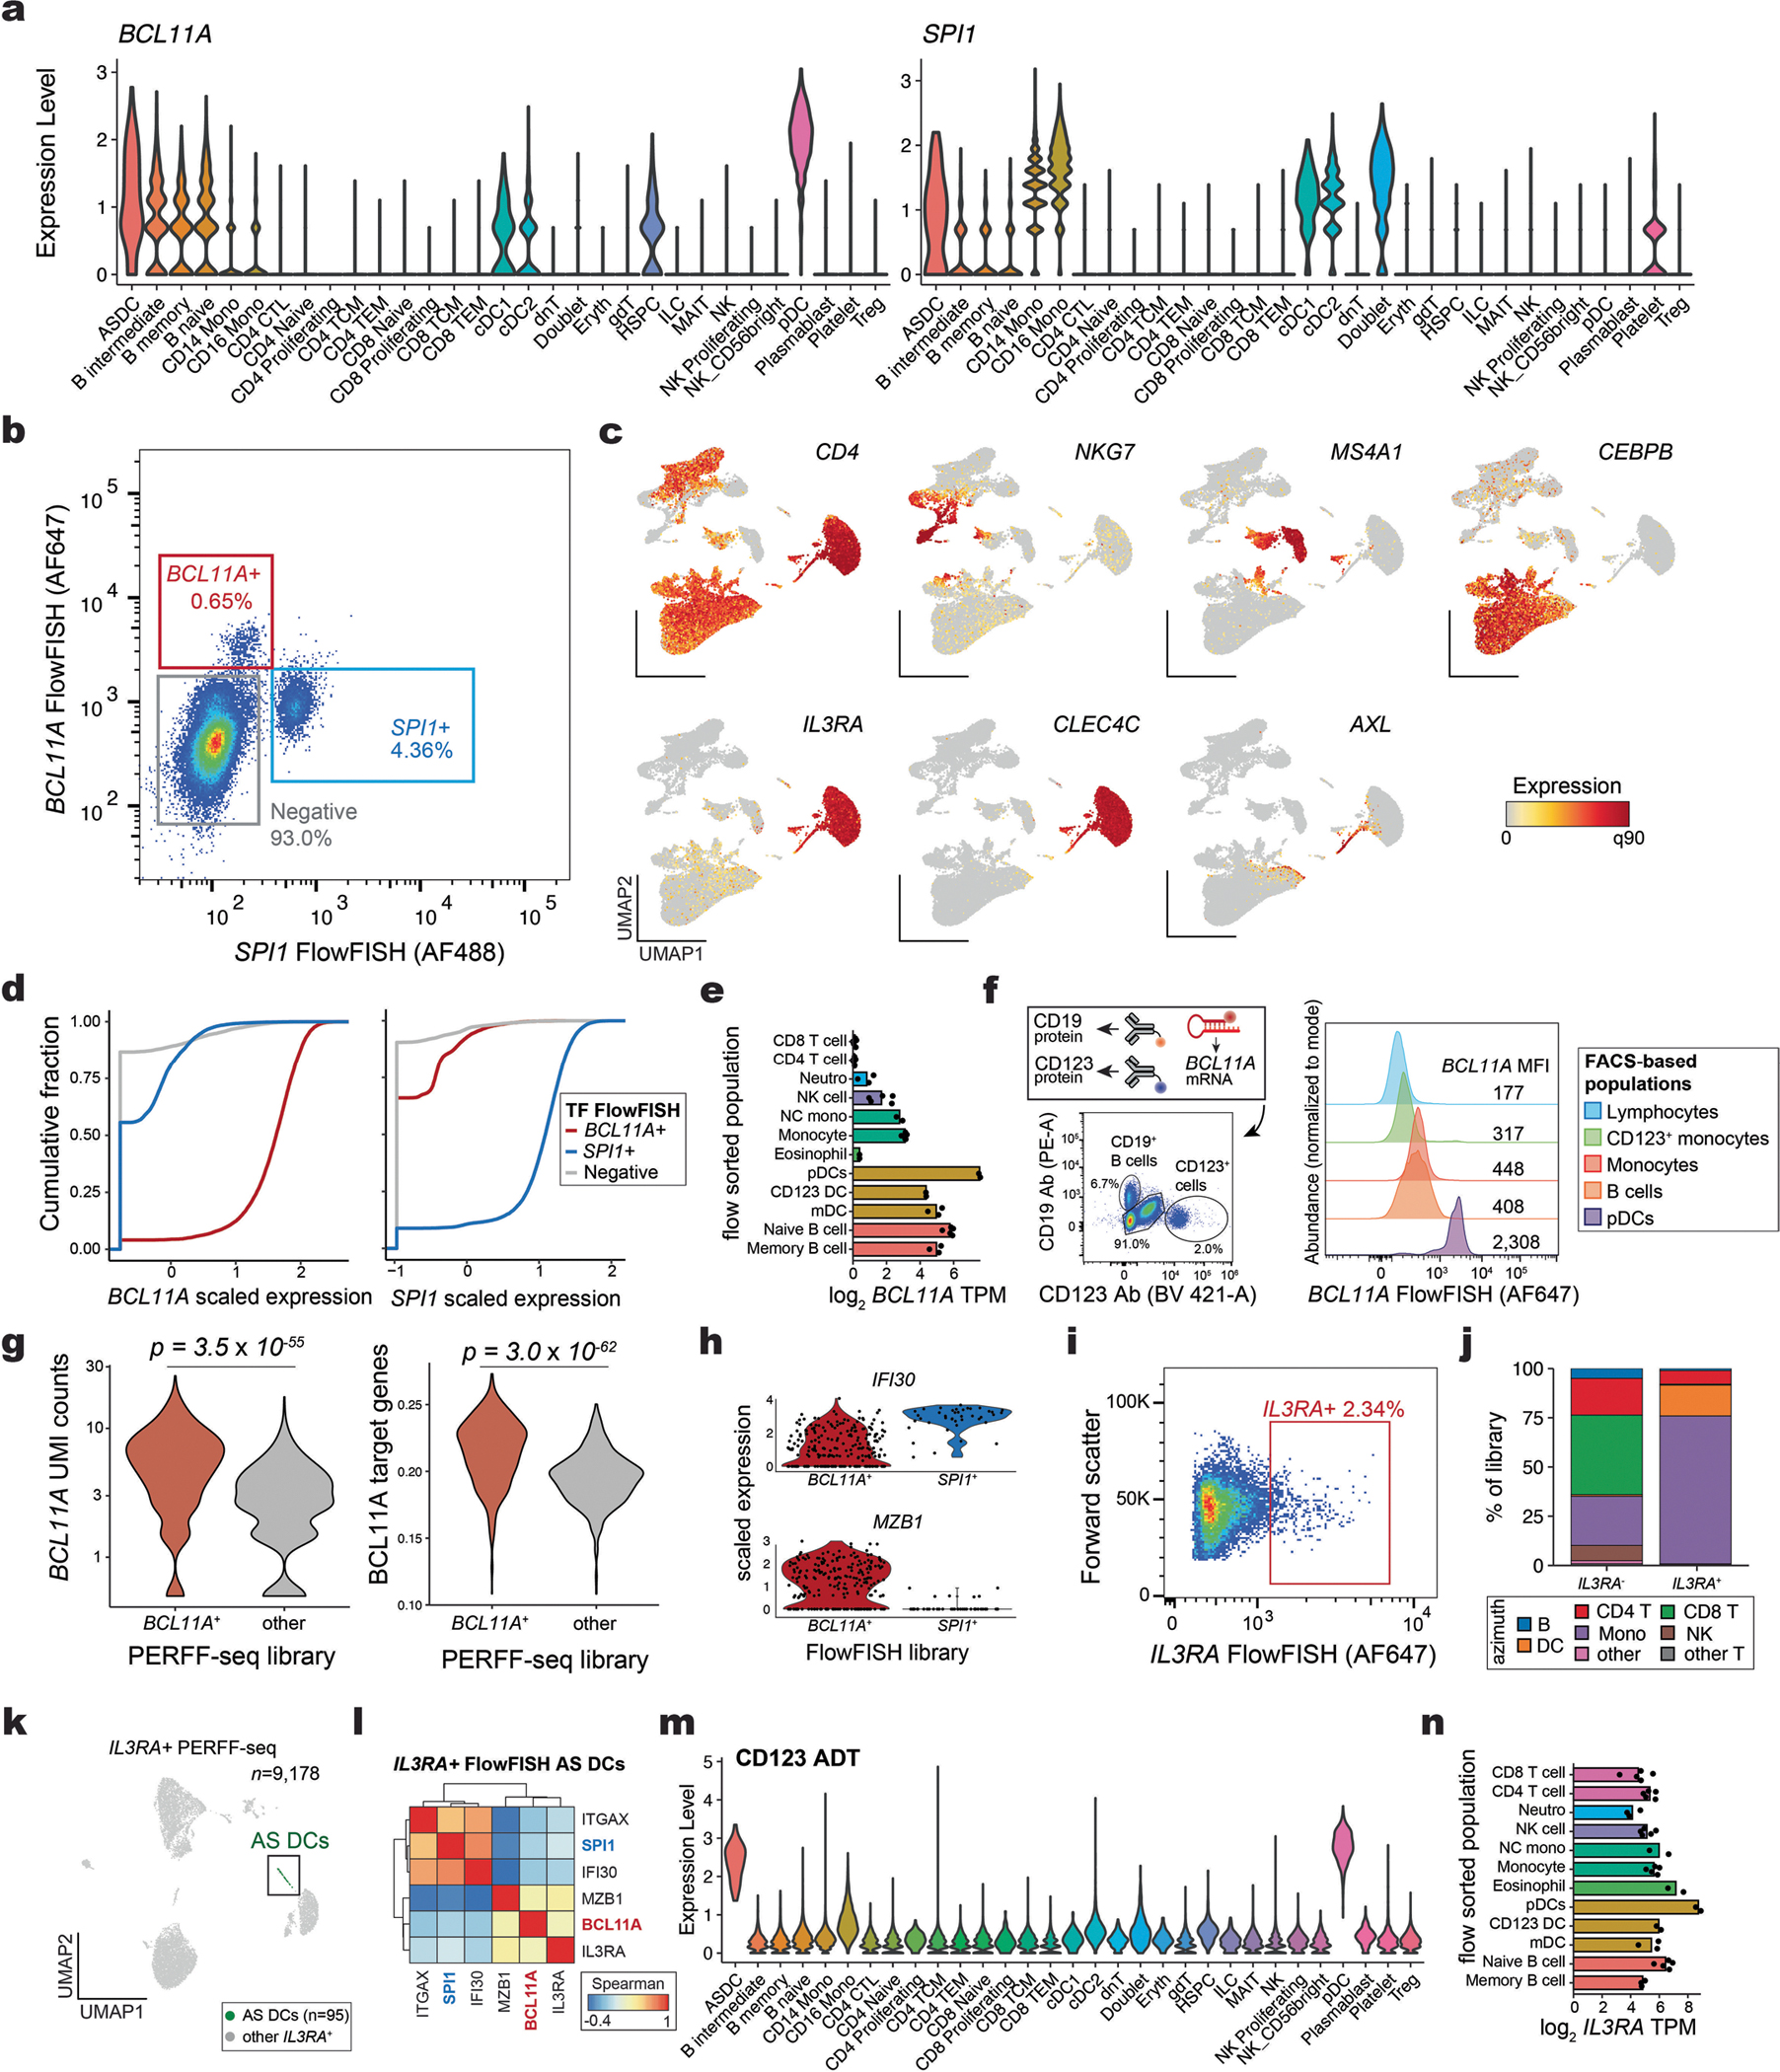
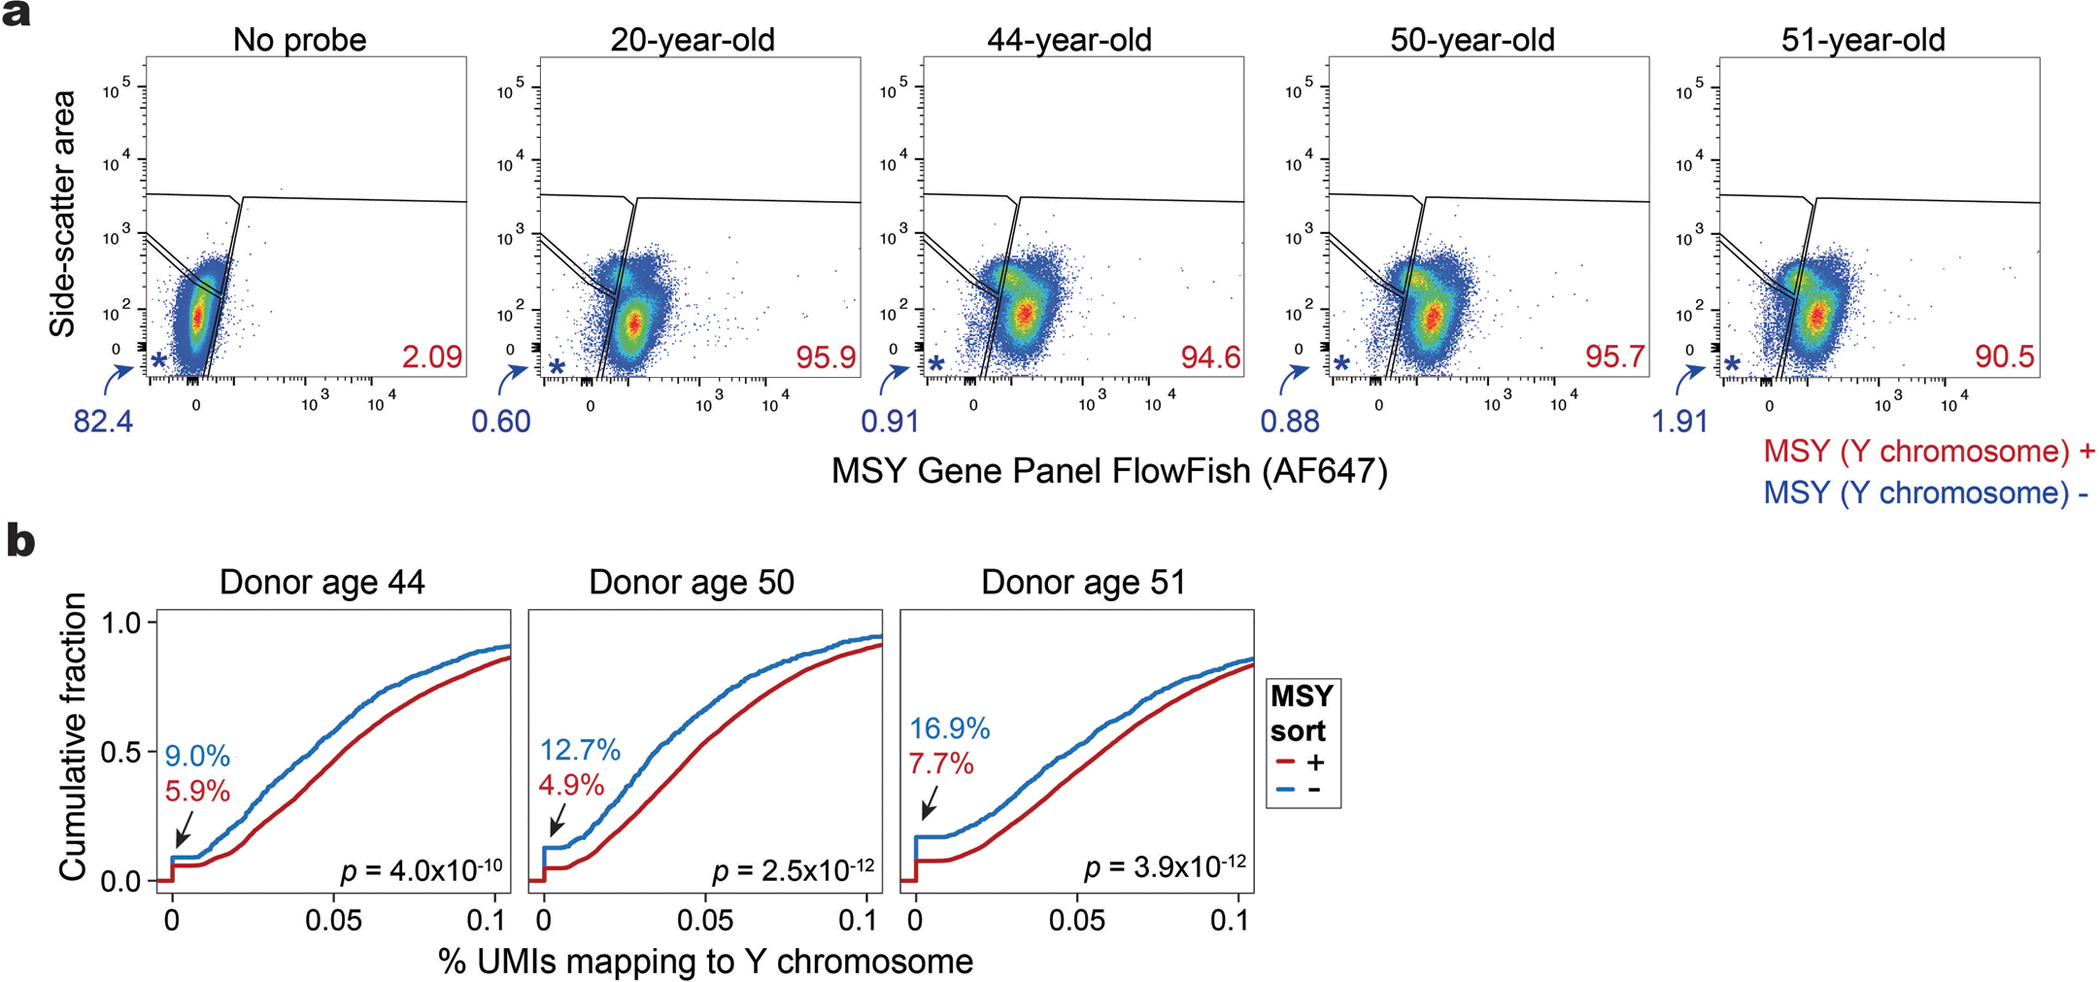
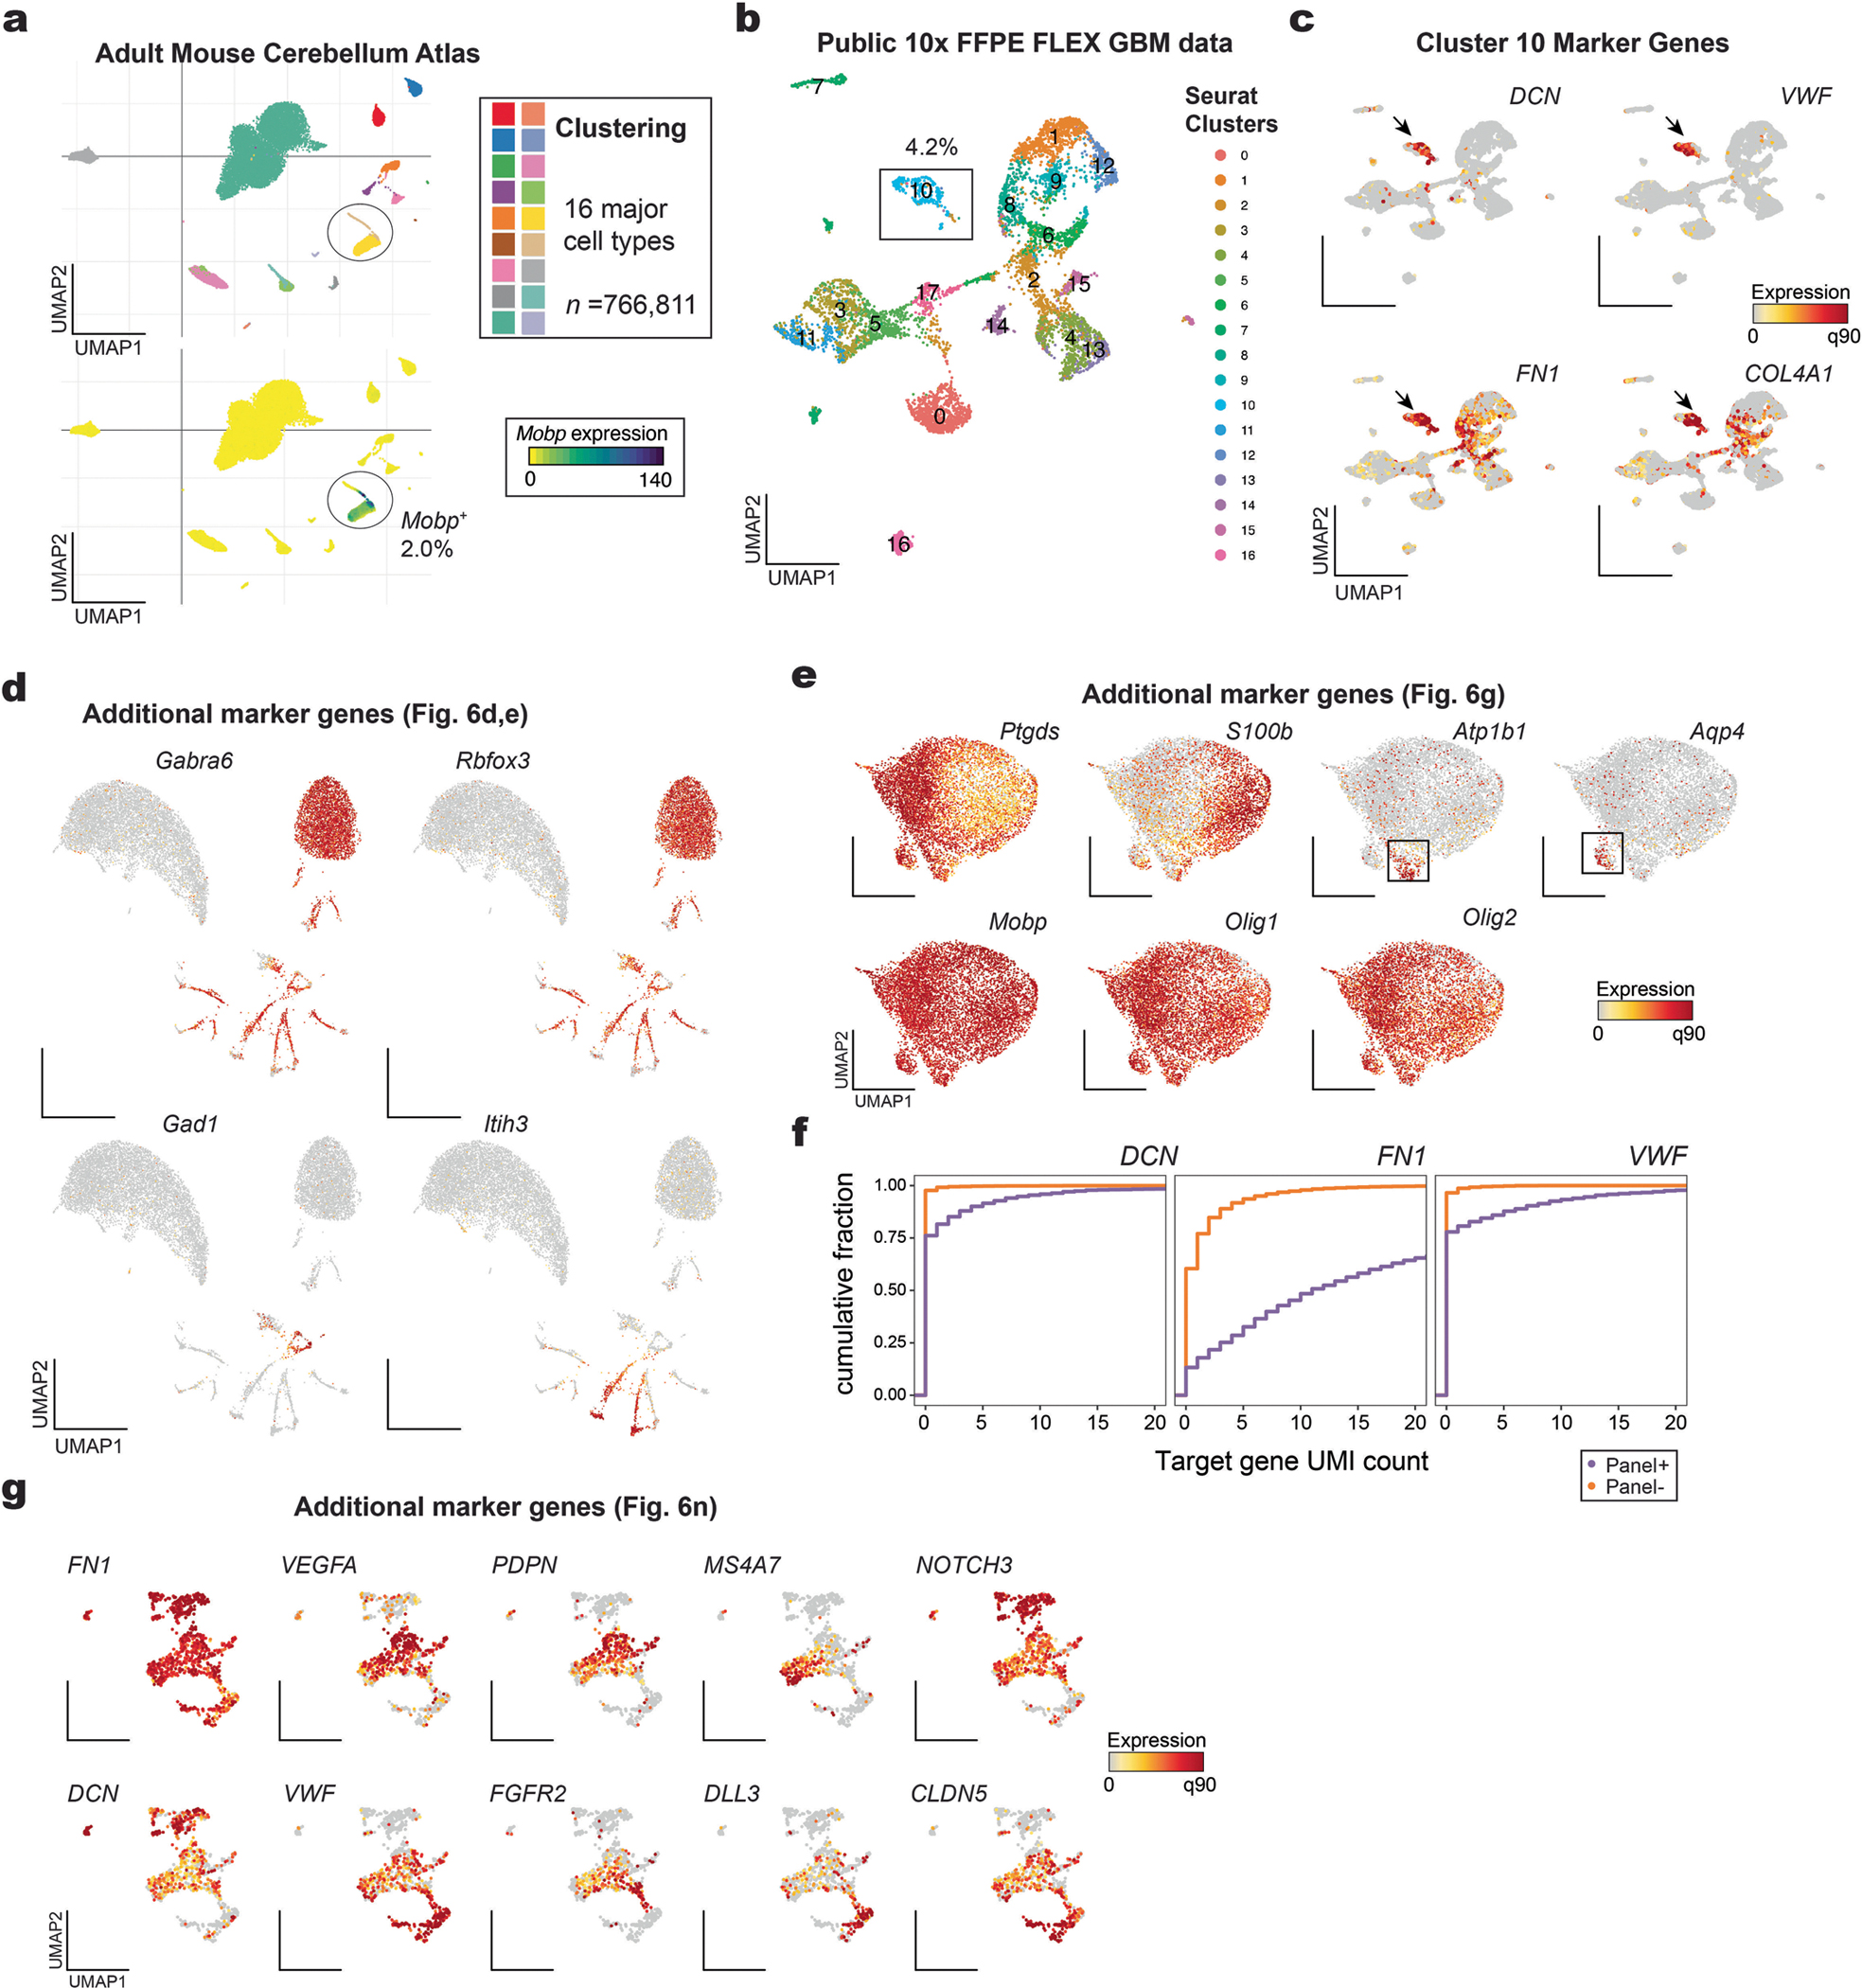
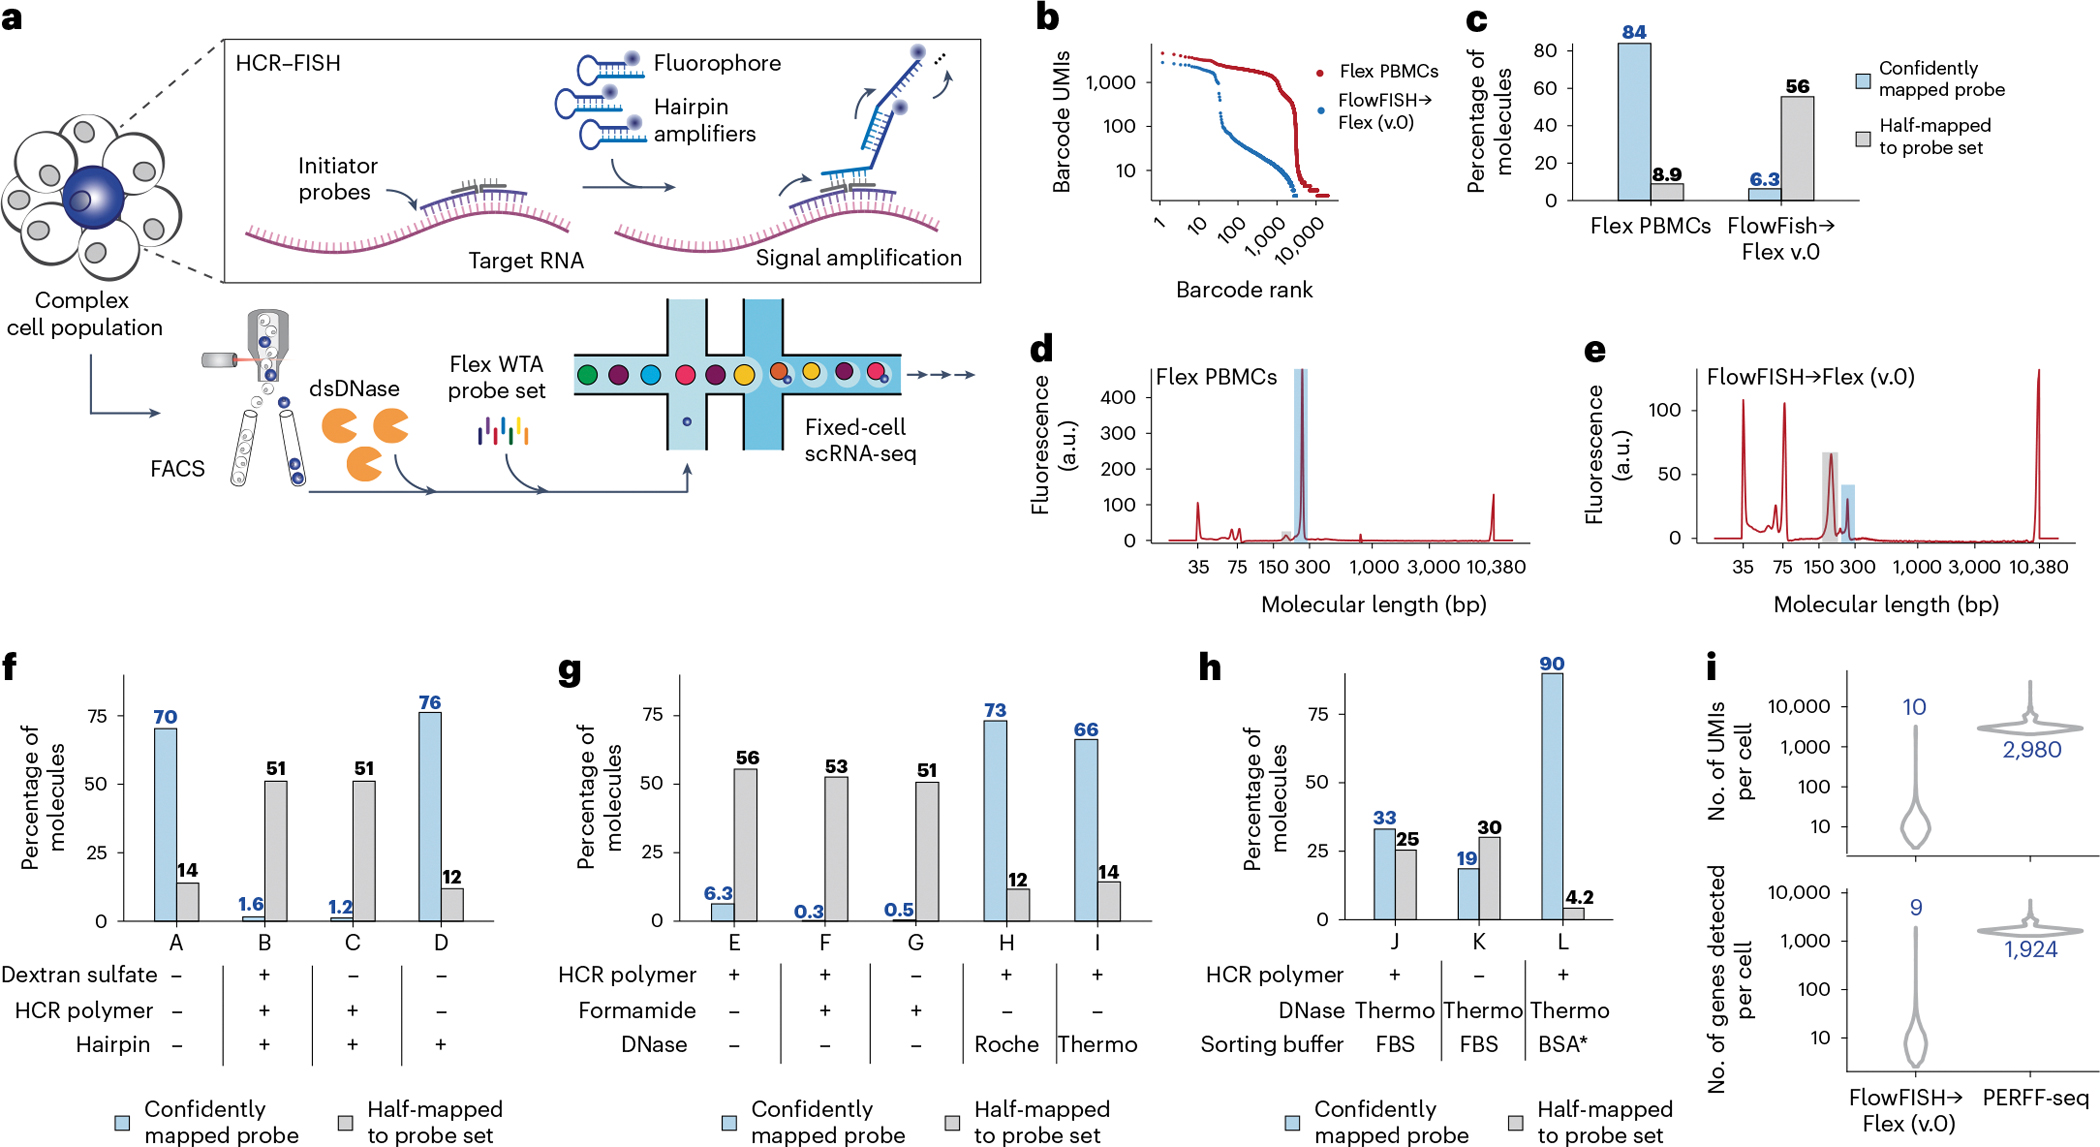
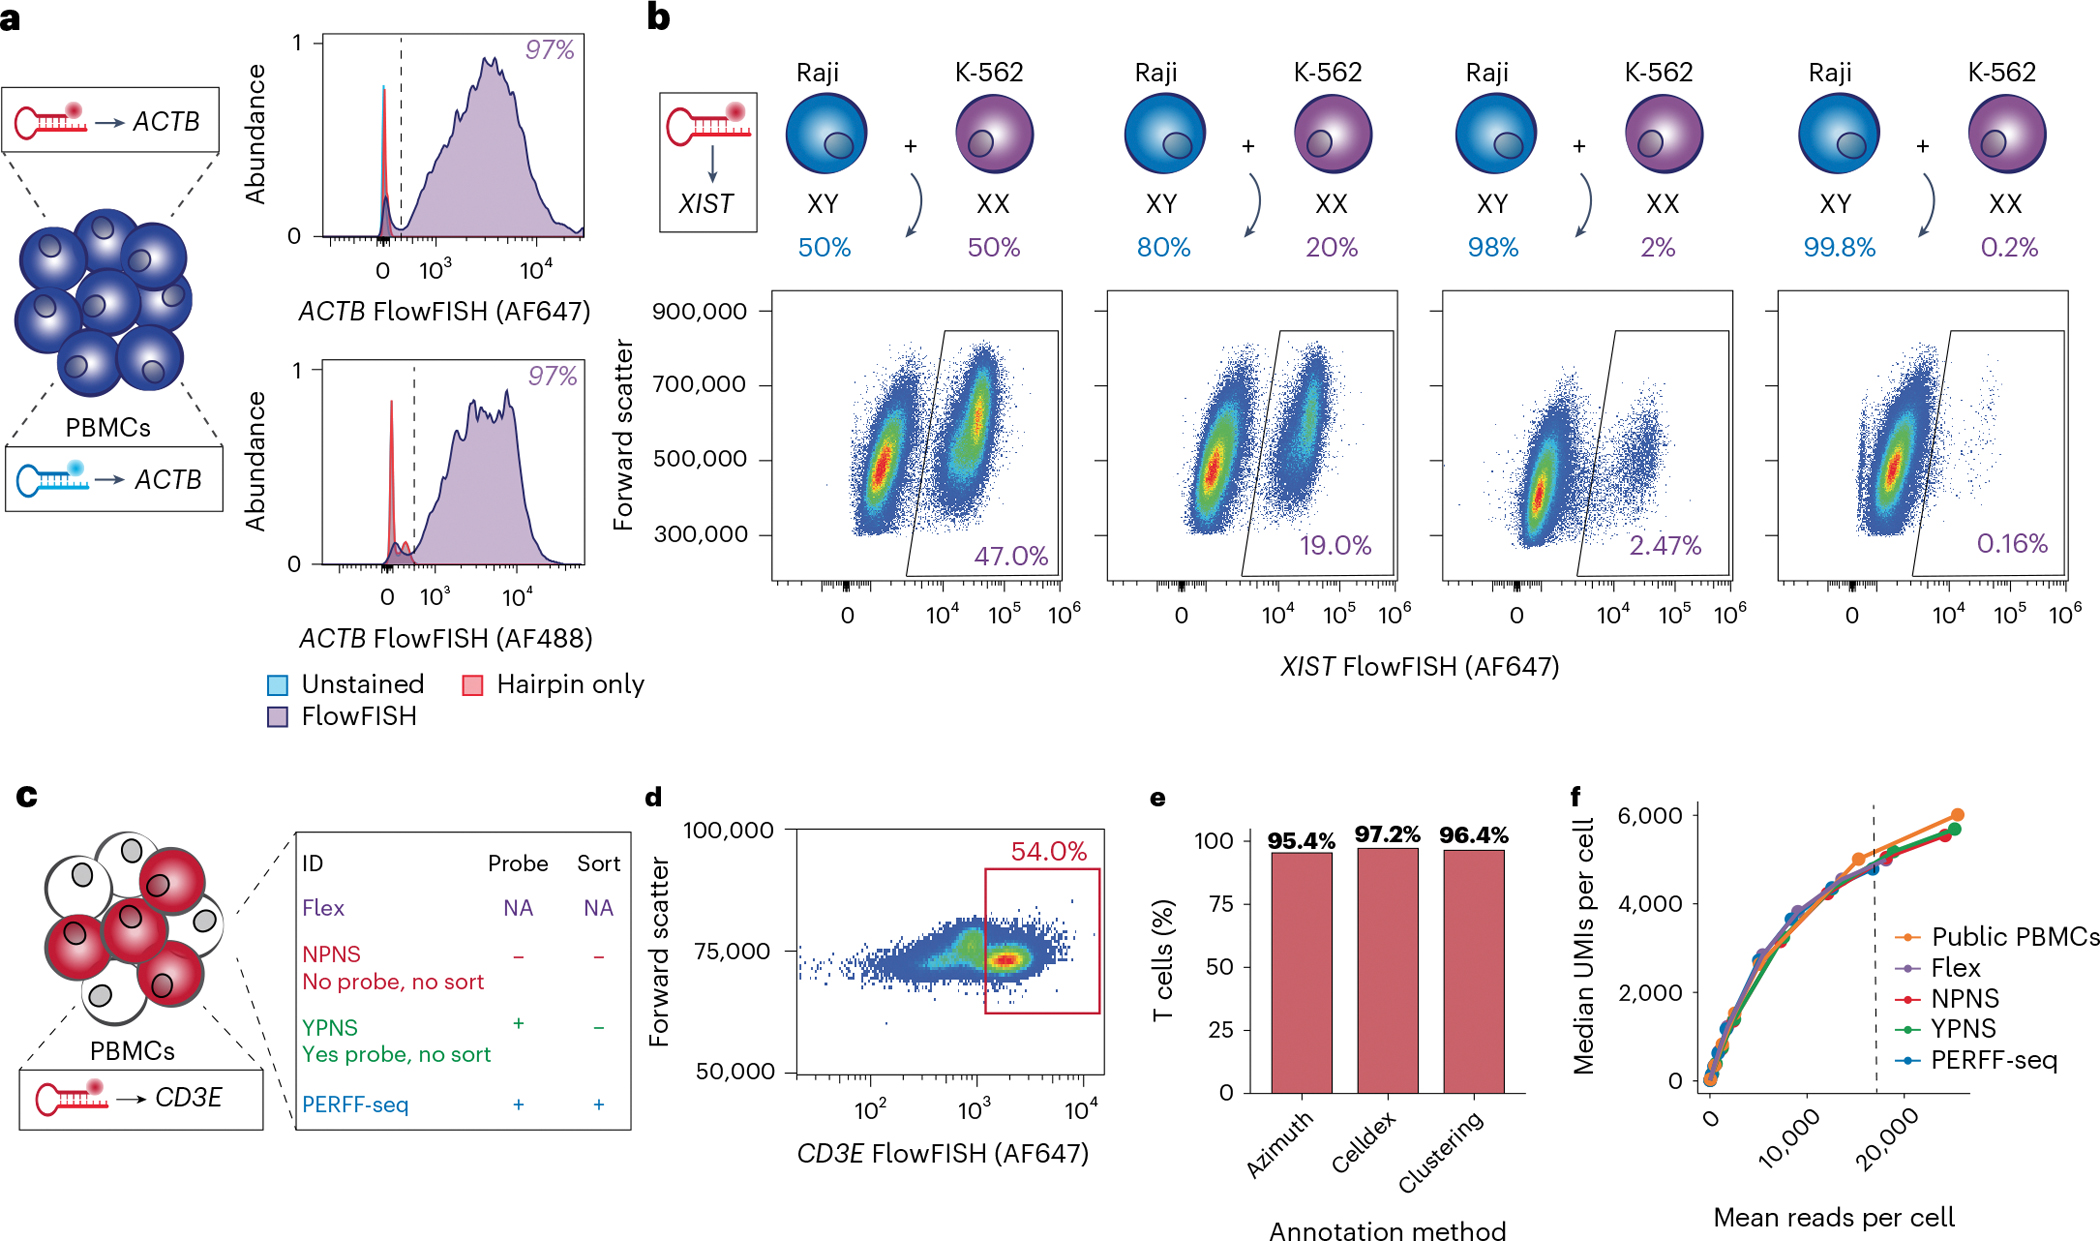
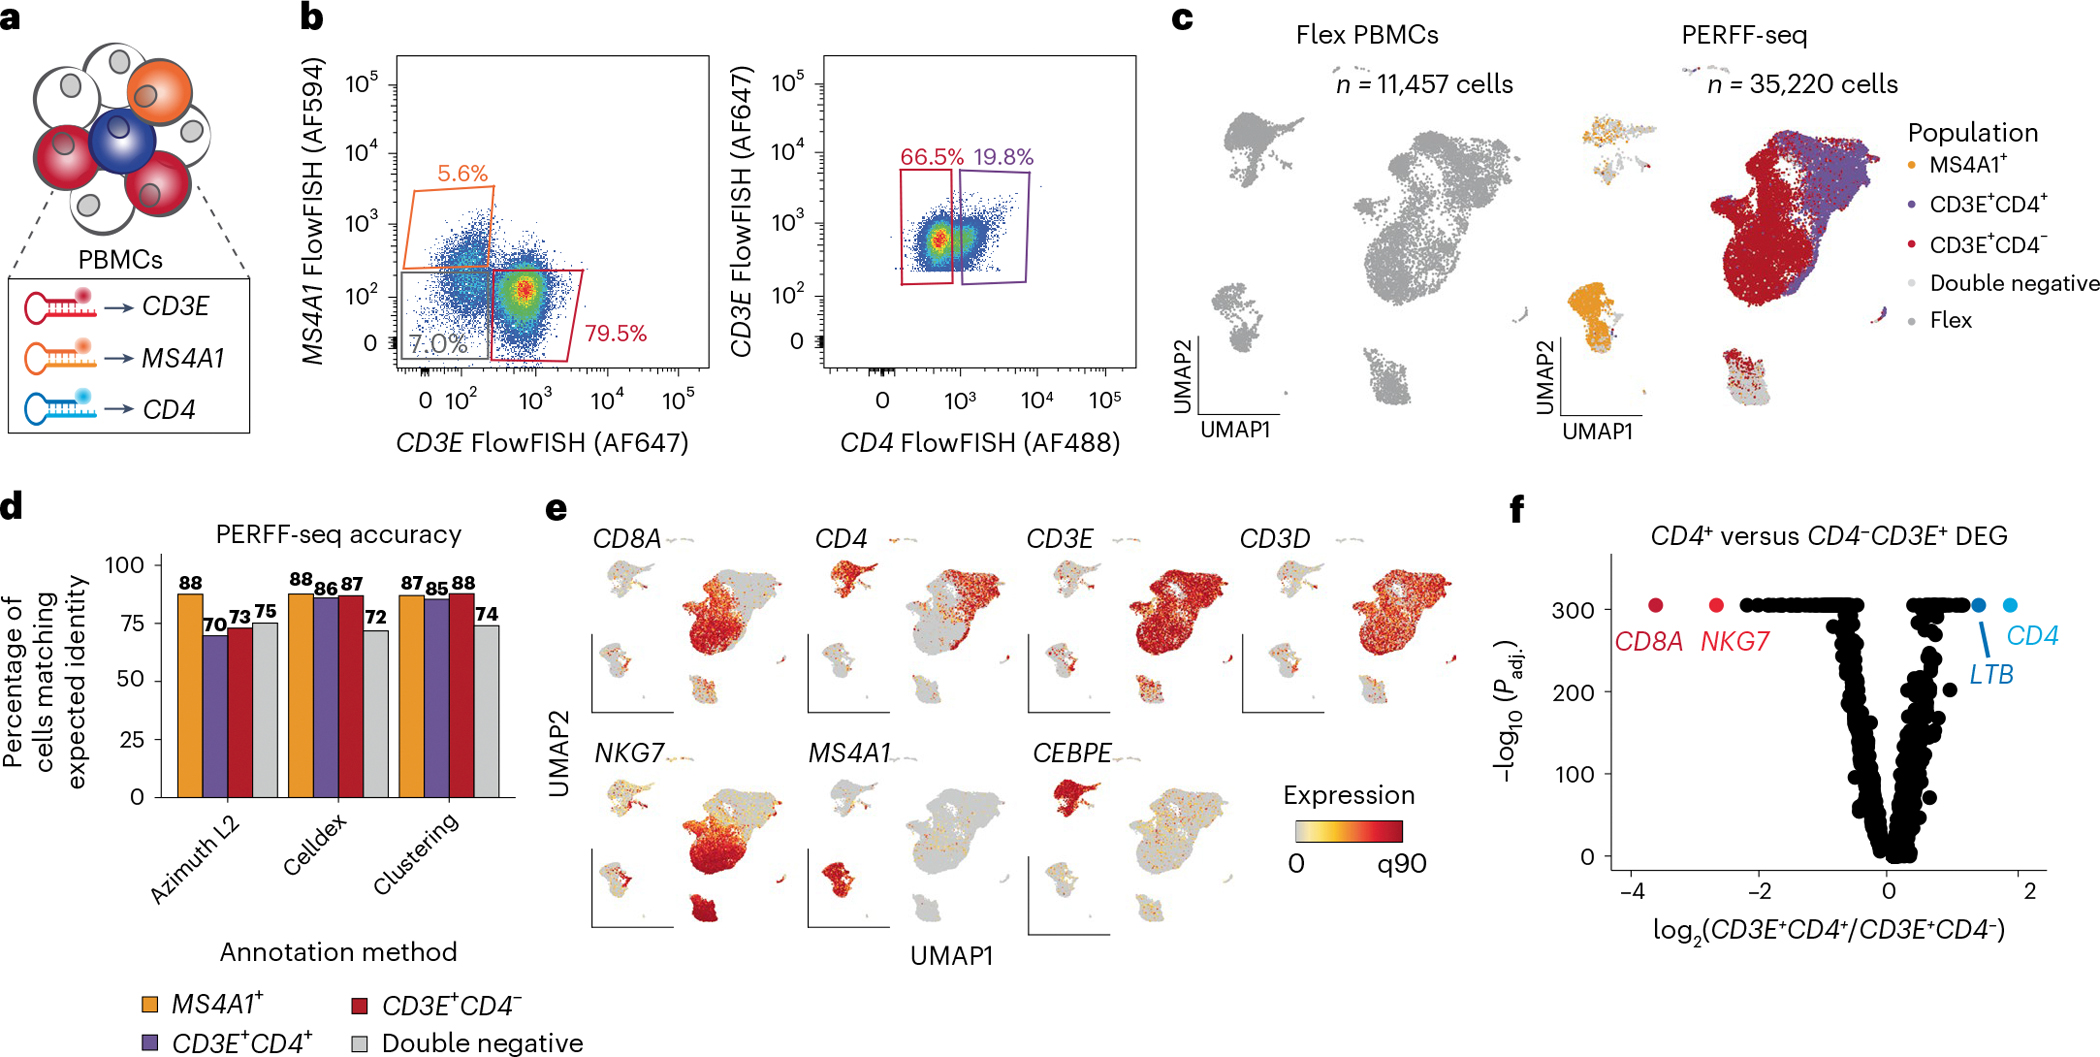
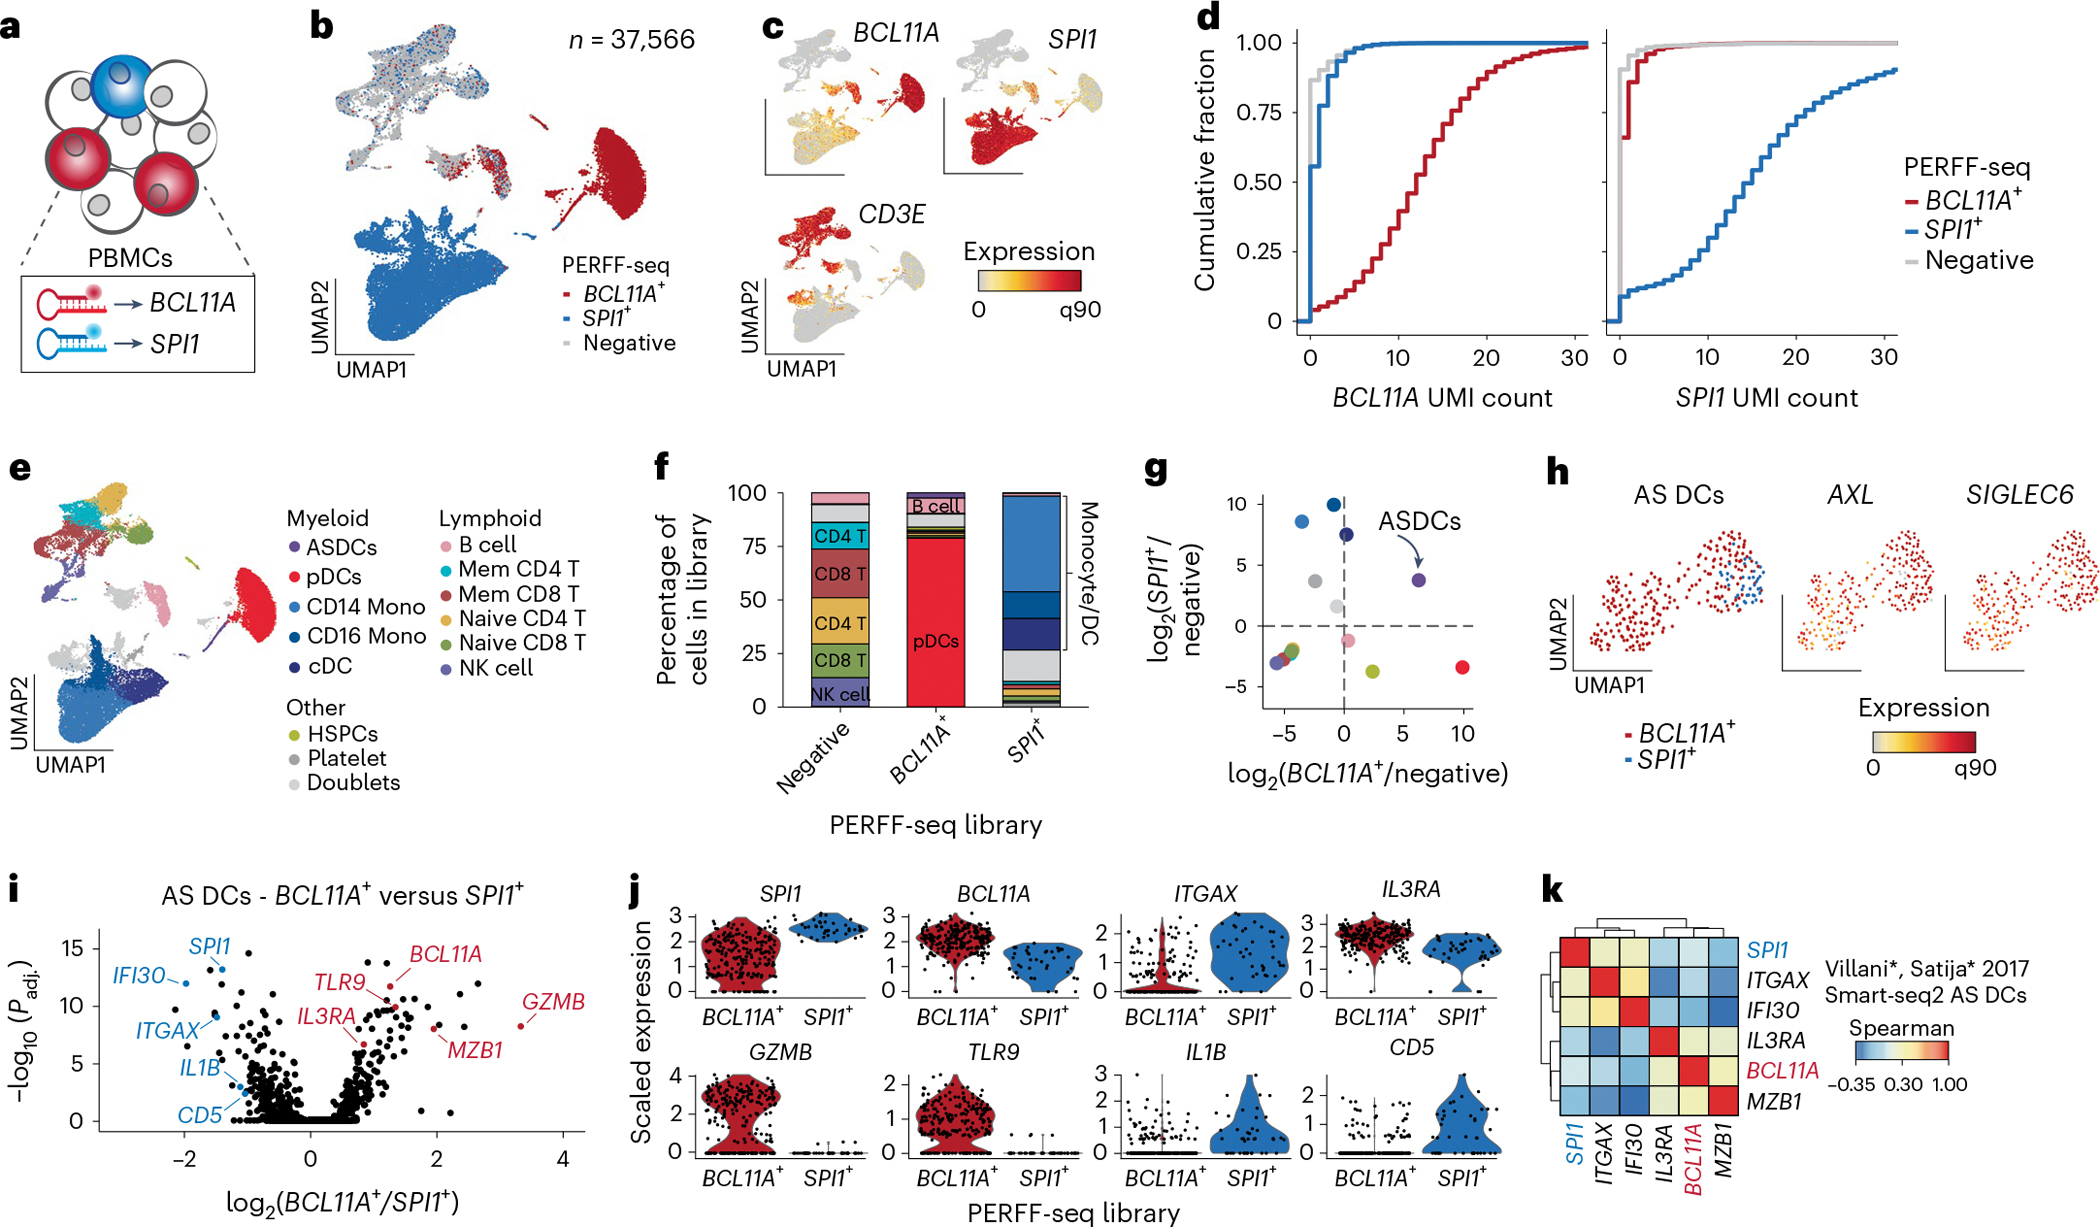
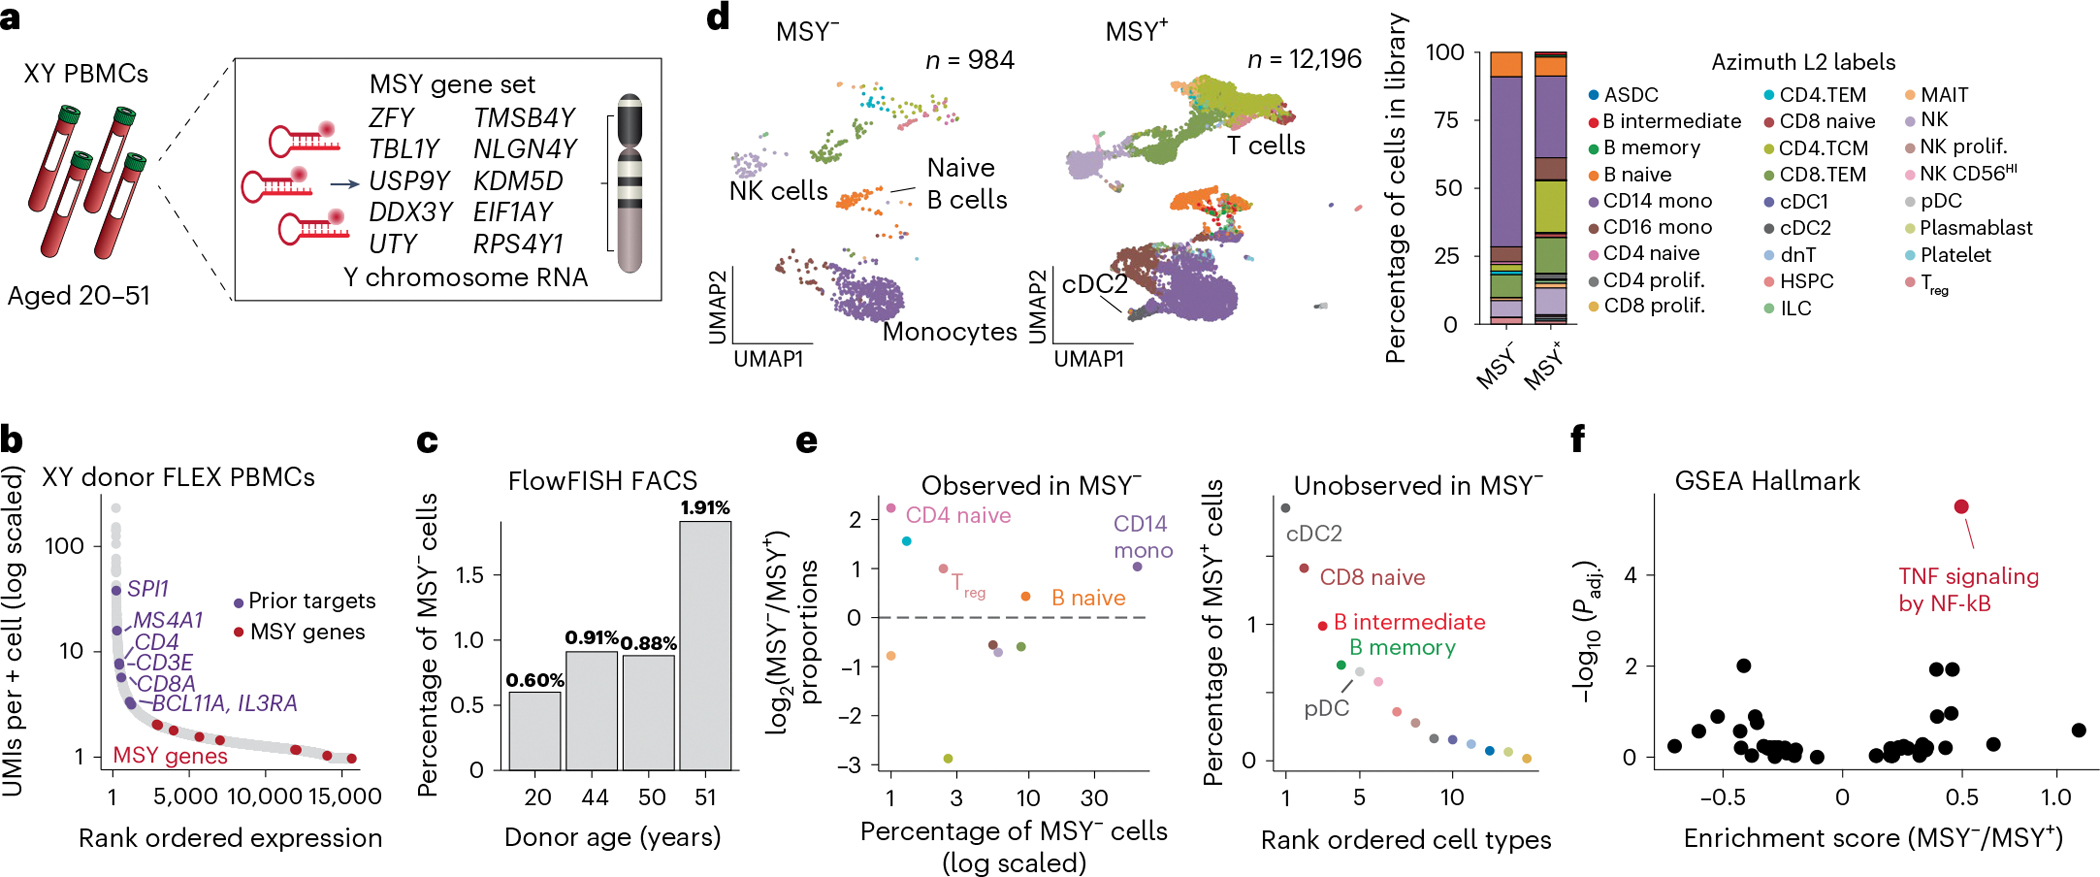
Single-cell genomics technologies have accelerated our understanding of cell-state heterogeneity in diverse contexts. Although single-cell RNA sequencing identifies rare populations that express specific marker transcript combinations, traditional flow sorting requires cell surface markers with high-fidelity antibodies, limiting our ability to interrogate these populations. In addition, many single-cell studies require the isolation of nuclei from tissue, eliminating the ability to enrich learned rare cell states based on extranuclear protein markers. In the present report, we addressed these limitations by developing Programmable Enrichment via RNA FlowFISH by sequencing (PERFF-seq), a scalable assay that enables scRNA-seq profiling of subpopulations defined by the abundance of specific RNA transcripts. Across immune populations (n = 184,126 cells) and fresh-frozen and formalin-fixed, paraffin-embedded brain tissue (n = 33,145 nuclei), we demonstrated that programmable sorting logic via RNA-based cytometry can isolate rare cell populations and uncover phenotypic heterogeneity via downstream, high-throughput, single-cell genomics analyses.


Conflict of interest statement

Competing interests: A.T.S. is a founder of Immunai, Cartography Biosciences, Santa Ana Bio and Prox Biosciences, an advisor to Wing Venture Capital and receives research funding from Astellas and Merck Research Laboratories. R.R.S., L.S.L. and C.A.L. are consultants to Cartography Biosciences. R.C. is a consultant for Sanavia Oncology, S2 Genomics and LevitasBio. The other authors declare no competing interests.

Figures

Extended Data Fig. 1 |
Extended Data Fig. 1 |. Analyses supporting PERFF-seq development.
(a) Schematic overview of Flex workflow, including probe hybridization to transcript fragments in cells upstream of Chromium and bead oligo extension of the ligation product. (b) Representative Bioanalyzer (Agilent Technologies) trace outlining complete versus incomplete sequencing molecules. (c) Graphical summary of probe capture sequence (pCS1) bead oligo capture sequence (left) and percent of reads with pCS1 detected in first 25 bases. (d) Comparison of FlowFISH signal using either unstained cells or the hairpin only comparing the sorted CD3E+ population and/or stripped via formamide. (e) Same as in (d) but using dsDNase for stripping. Note: quantifying fluorescence after sorting/stripping (d, purple; e, blue) is not standard for the PERFF-seq protocol but shown here as part of assay development. (f) Bioanalyzer traces for representative libraries from panels in Fig. 1, highlighting half- and fully-mapped probes. (g) Bioanalyzer traces of library preparation where the full PERFF-seq workflow was completed except omiting the dsDNAse stripping step.
Extended Data Fig. 2 |
Extended Data Fig. 2 |. Supporting analyses of assay benchmarking.
(a) HCR FISH staining and quantification of EPCAM across cell lines. Mean fluorescence intensity (MFI) and bulk RNA-seq transcripts per million (TPM from) are noted for each condition. (b) Replication of cell line mixing experiment and staining for XIST. (c) Reduced dimensionality embedding of all cells in the four-plex benchmarking experiment. PERFF-seq was enriched for CD3E+ cells. No probe, no sort (NPNS) and Yes probe, no sort (YPNS) profile all PBMC subpopulations with minor modifications to the reaction. (d) Marker genes supporting annotation of key populations. (e) Same as (c) but stratified by library. Boxes indicate B cell and monocyte populations that are depleted from the PERFF-seq library. (f) Percent of T cells from each library with at least 1 UMI for CD3D or CD3E. (g) log2 counts per million (CPM) of CD3D and CD3E across different library conditions. (h) Differentially expressed genes between different facets of PERFF-seq compared to Flex. Two genes were differentially expressed, including CD3E in both the YPNS and PERFF-seq conditions. ∅ means empty or no genes detected.
Extended Data Fig. 3 |
Extended Data Fig. 3 |. Supporting analyses of combinatorial PBMC cell states.
(a) Additional marker genes for distinct populations from PBMC cell type analyses. Arrows indicate markers for rare populations expected from PBMC profiling. (b) Relative enrichment of cell populations (colours) for each PERFF-seq library compared to the Flex PBMC library. (c) Subclustering of CD3E+/CD4+ cells, highlighting rare subclusters marked by relevant genes. (d) Summary of CD4 HCR FISH signal, stratified by CD3E populations. (e) Bulk RNA-seq expression of CD4 from FACS-isolated populations. Replicates for e are all libraries from Haemopedia with no statistical test. (f) Design and results of antibody and HCR FISH co-staining to evaluate CD4 RNA and protein expression.
Extended Data Fig. 4 |
Extended Data Fig. 4 |. Supporting analyses of unconventional enrichments of rare cell states.
(a) Azimuth Violin plots for BCL11A and SPI1 RNA expression across well-annotated populations in peripheral blood mononuclear cell types. (b) Summary of FACS populations, including unsorted, BCL11A+, and SPI1+ populations. (c) Additional marker genes supporting cell type annotations. (d) Empirical cumulative distribution plot of scaled expression of BCL11A (left) and SPI1 (right) stratified by the captured PERFF-seq library. (e) Bulk RNA-seq of sorted populations of BCL11A. (f) Design (left) and results (right) of cytometry analysis of PBMCs co-stained with BCL11A mRNA (via HCR-FISH) and CD19 and CD123 protein (via antibodies). Mean fluorescence intensity (MFI) for BCL11A of each population is quantified. (g) Comparison of B cells from BCL11A+ FlowFISH or negative/SPI1+ populations for BCL11A expression or BCL11A target gene module scores. Uncorrected p-value for the two-sided Wilcoxon rank-sum test is shown. (h) Additional violin plots of marker genes, stratified by the FlowFISH library. All genes were significantly differentially expressed at a false discovery rate (FDR) < 0.01. (i) Summary of IL3RA+ FACS sort and population characterized with PERFF-seq. (j) Proportion of cell types from the Azimuth L1 reference for IL3RA+/− PERFF-seq libraries. (k) Reduced dimensionality representation of IL3RA+ PERFF-seq library, highlighting profiled AS DCs. (l) Gene-gene Spearman correlations of all AS DCs from the IL3RA+ sort. Genes match those in Fig. 4k. (m) Summary of CD123 expression from antibody-derived tags (ADT) of PBMC CITE-seq. (n) Bulk RNA-seq of sorted populations of IL3RA. Replicates for e and n are all libraries from Haemopedia with no statistical test.
Extended Data Fig. 5 |
Extended Data Fig. 5 |. Supporting analyses for mosaic loss of Y chromosome.
(a) FlowFISH cytometry gating scheme, including control (no probe, left) and four male (XY) donors of different ages. The percent of cells corresponding to MSY+ (red) and MSY (blue) in each donor gate are shown as numeric values. (b) Empirical cumulative distribution plot of the percent of Y chromosome UMIs stratified by the captured PERFF-seq library. Percentages of cells with 0 MSY UMIs from the scRNA-seq library are noted. P-values are from a two-sided Kolmogorov–Smirnov test comparing the distributions of the positive and negative samples.
Extended Data Fig. 6 |
Extended Data Fig. 6 |. Supporting analyses of nuclei enrichment from fresh and fixed tissues.
(a) UMAP of adult mouse cerebellum atlas, including cell types (top) and Mobp expression (bottom). The Mobp+ oligodendrocytes and oligodendrocyte precursors are circled with their frequency noted. (b) Reduced dimensionality representation of public GBM FFPE Flex data showing 17 clusters. (c) Annotation of marker genes for cluster 10, the population highlighted by the arrow in (b). (d) Supporting marker genes annotating other subpopulations from the PERFF-seq experiment, including the primary cluster of granule cells. (e) Additional marker genes from Mobp+ cells were profiled with PERFF-seq. Atp-associated genes (Atp1b1, Aqp4) supporting rare subclsuters are highlighted in the boxes as well as marker genes highly expressed in all cells. (f) Empirical cumulative distribution plot of the raw UMI counts for each of the three genes enriched via FlowFISH, stratified by the captured PERFF-seq library. (g) Additional marker genes showing heterogeneity defining subclusters of endothelial cells and pericytes.
Fig. 1 |
Fig. 1 |. Rationale and development of PERFF-seq.
a, Schematic of the PERFF-seq assay. Target RNA(s) is(are) bound by pairs of adjacent initiator probes that ensure specificity. Hairpin amplifiers unzip and hybridize iteratively to generate fluorescent signal and enable FACS before single-cell profiling with the droplet-based scRNA-seq Flex kit. b, Knee plot of cells profiled with standard Flex versus HCR–FlowFISH-sorted cells. c, Fraction of reads fully mapping (blue) or half-mapping (gray) to the reference probe set. d, Bioanalyzer traces highlighting the expected product size of the full probe (~260 bp; blue) and half-probe (~190 bp; gray) for a high-quality Flex library. e, Same as d but for the FlowFISH → Flex v.0 experiment. f, Experiments identifying the HCR polymer as the corrupting agent for data quality. g, Conditions screened for polymer stripping, including DNase and formamide treatments. h, Sorting buffer components analyzed to improve data quality. i, UMIs (top) and genes (bottom) detected per cell comparing the initial FlowFISH → Flex v.0 experiment, from b to the final PERFF-seq library from h. Median values are shown in blue. Values plotted in c and fi represent overall library values for a single replicate. a.u., arbitrary units; Thermo, Thermo Fisher Scientific.
Fig. 2 |
Fig. 2 |. Benchmarking of PERFF-seq.
a, Sorting of PBMCs stained with AF647- and AF488-labeled ACTB probes. The percentage of positive events is shown at the top right. b, Benchmarking of lncRNA XIST FlowFISH by diluting K-562 cells (XX/XIST+) into Raji cells (XY/XIST) at varying ratios. The expected cell ratios per line are noted above the flow plot and the percentage of XIST+ events are reported in the gate. c, PERFF-seq benchmarking experiment for four libraries, including the standard Flex workflow with or without PERFF-seq probe staining or sorting steps. PERFF-seq was enriched for CD3E+ cells. All tested conditions: NPNS and YPNS profiles of all PBMC subpopulations with minor modifications to the reaction. d, Sorting strategy for CD3E+ cells for the PERFF-seq library. e, Proportion of cells from the sorted PERFF-seq library annotated as T cells using three different computational methods for classification. f, Downsampling analysis for library saturation and UMI benchmarking. The dashed line represents the mean reads per cell for a final comparison (depth of lowest sample, 16,755 reads per cell). NA, not available.
Fig. 3 |
Fig. 3 |. Enrichment of cells with multicolor and multigene panels.
a, Schematic of experimental design. Probes targeting three indicated genes are each labeled with distinct fluorophore stain-specific populations in PBMCs from a healthy human donor. b, FlowFISH signal and sort gates. Percentages represent the overall fraction of events sorted in each gate. c, Reduced dimensionality representation of four populations profiled with PERFF-seq (right) co-embedded with a standard Flex library of PBMCs (left). The colors represent the gates drawn from the FlowFISH sort in b. d, Percentage of high-quality cells from PERFF-seq assigned to expected cell types using three distinct annotation methods. The colors represent the gates drawn from the FlowFISH sort in b. e, Annotation of relevant marker genes for populations in reduced dimensionality space, including genes used in the FlowFISH panel. f, Differentially expressed gene (DEG) analysis comparing CD4+ and CD4 populations from the CD3E+ sort (b, right). Genes corroborating annotation are highlighted. The Bonferroni-adjusted P value for the two-sided Wilcoxon’s rank-sum test is shown with at a minimum of 1 × 10−314 for machine precision.
Fig. 4 |
Fig. 4 |. Rare cell states enriched via nontraditional cell-type markers.
a, Schematic of human PBMC staining with probes targeting BCL11A and SPI1. b, Uniform Manifold Approximation and Projection (UMAP) embedding of PERFF-seq profiles from three populations based on TF FlowFISH sorting logic. c, Depiction of marker-gene expression across all PERFF-seq profiled cells. d, Empirical cumulative distribution plot of raw UMI counts for BCL11A (left) and SPI1 (right) stratified by the captured PERFF-seq library. e, Annotated cell states from PERFF-seq profiling. f, Proportions of each cell type per library with major cell types labeled. The colors match e. g, Relative enrichment of each cell type in the BCL11A+ sort (x axis) or SPI1+ sort (y axis) relative to the negative population. AS DCs are highlighted as the only enriched population in both sorted populations. The colors match e. h, UMAP of AS DCs, highlighting the TF FlowFISH library and defining marker-gene expression. i, Volcano plot comparing DEGs from the two FlowFISH-sorted populations. Notable marker genes are highlighted, including known and newly identified marker genes for AS DC subsets. The Bonferroni-adjusted P value for the two-sided Wilcoxon’s rank-sum test is shown. j, Violin plots of marker genes, stratified by the FlowFISH library. All genes were significantly differentially expressed at a false discovery rate (FDR) < 0.01. k, Gene–gene Spearman’s rank correlations of all AS DCs using the original dataset, highlighting the co-occurrence of TFs from our analysis with established marker genes for the AS DC subsets.
Fig. 5 |
Fig. 5 |. Profiling somatic mosaicism with PERFF-seq.
a, Schematic of experiment. PBMCs from donors of different ages were sorted for a ten-gene OR-gated panel of MSY. b, Mean per-cell expression of all genes detected in Flex with genes analyzed for FlowFISH noted. c, Summary of the percentage of MSY cells, with donor age labels, from the FlowFISH cytometry data. d, UMAP embedding of PERFF-seq profiles from the 51-year-old donor based on MSY sorting logic. e, Analyses of cell types from scRNA-seq analyses for cell types enriched (left) or depleted (right) in the MSY library. The colors represent cell types as shown in c. f, Gene set enrichment analyses of MSY versus MSY+ CD14 monocytes, highlighting TNF signaling by NF-κB. Statistical significance is based on a permutated enrichment score under a two-sided null. prolif., proliferative.
Fig. 6 |
Fig. 6 |. Study of rare nuclei from fresh-frozen and FFPE tissue.
a, Schematic of PERFF-seq single-nucleus experiments from frozen mouse brain tissue or FFPE human GBM tissue, showing HCR–FlowFISH staining and sorting strategy. Side scatter area (SSC-A) and FISH signal separate populations. b, Downsampling analysis for library saturation and UMI benchmarking for the mouse brain nuclei. The dashed line represents the mean reads per cell for a final comparison (depth of lowest sample: top, 19,140 reads per cell; bottom, 11,021 reads per cell). c, Same as b but for the human FFPE tissue sample. d, UMAP embedding of the mouse brain nuclei, FlowFISH-enriched or -depleted populations profiled with PERFF-seq. e, Same as d but colored by Mobp marker-gene expression. The boxed population was further subclustered. f, Empirical cumulative distribution plot of raw UMI count for Mobp stratified by the captured PERFF-seq library. g, Subclustering of the Mobp+ population. The arrows highlight top marker genes per cluster. h, Reduced dimensionality representation of the human FFPE nuclei FlowFISH-enriched or -depleted populations profiled with PERFF-seq. i, Same as h but colored by marker genes used in the FlowFISH panel. The boxed population was further subclustered. j, Empirical cumulative distribution plot of total UMI count for the sum of the three genes enriched via FlowFISH, stratified by the captured PERFF-seq library. k, Top DEGs between the two FFPE populations profiled with PERFF-seq. l, Gene–gene Pearson’s correlations of relevant marker genes, including those used in the FlowFISH enrichment panel. m, Subclustering of the panel+ population with cluster states noted. n, Top marker genes enriched in specific subclusters. The arrows indicate critical populations where each gene is highly expressed.

Update of

Similar articles

Cited by

References

    1. Montoro DT et al. A revised airway epithelial hierarchy includes CFTR-expressing ionocytes. Nature 560, 319–324 (2018). - PMC - PubMed
    1. Drokhlyansky E et al. The human and mouse enteric nervous system at single-cell resolution. Cell 182, 1606–1622.e23 (2020). - PMC - PubMed
    1. Stuart T et al. Comprehensive integration of single-cell data. Cell 177, 1888–1902.e21 (2019). - PMC - PubMed
    1. Villani A-C et al. Single-cell RNA-seq reveals new types of human blood dendritic cells, monocytes, and progenitors. Science 356, eaah4573 (2017). - PMC - PubMed
    1. Lareau CA et al. Latent human herpesvirus 6 is reactivated in CAR T cells. Nature 623, 608–615 (2023). - PMC - PubMed

LinkOut - more resources