. 2025 Feb;57(1):204-220.
doi: 10.1038/s12276-024-01384-y. Epub 2025 Jan 8.

Pancreatic organogenesis mapped through space and time

Affiliations

Pancreatic organogenesis mapped through space and time

Marissa A Scavuzzo et al. Exp Mol Med. 2025 Feb.

Abstract

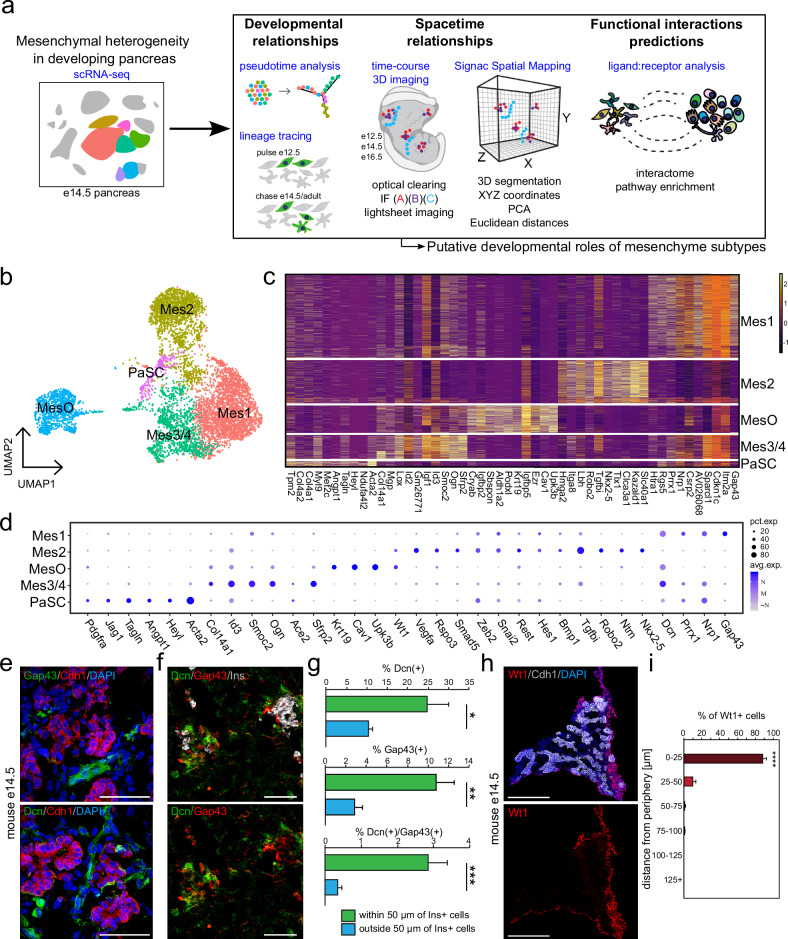
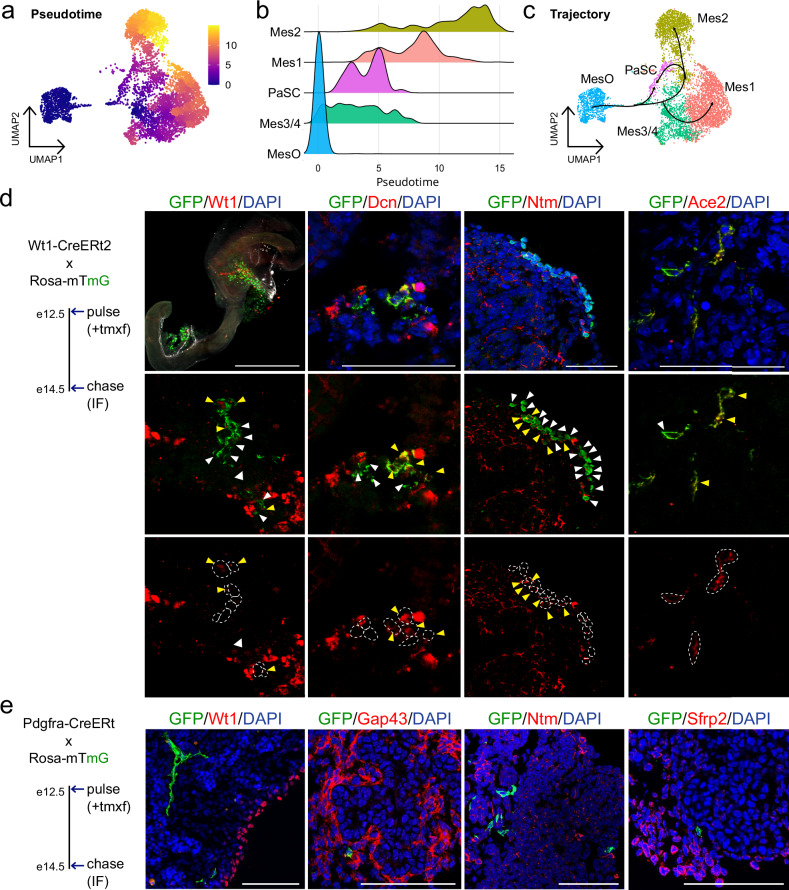
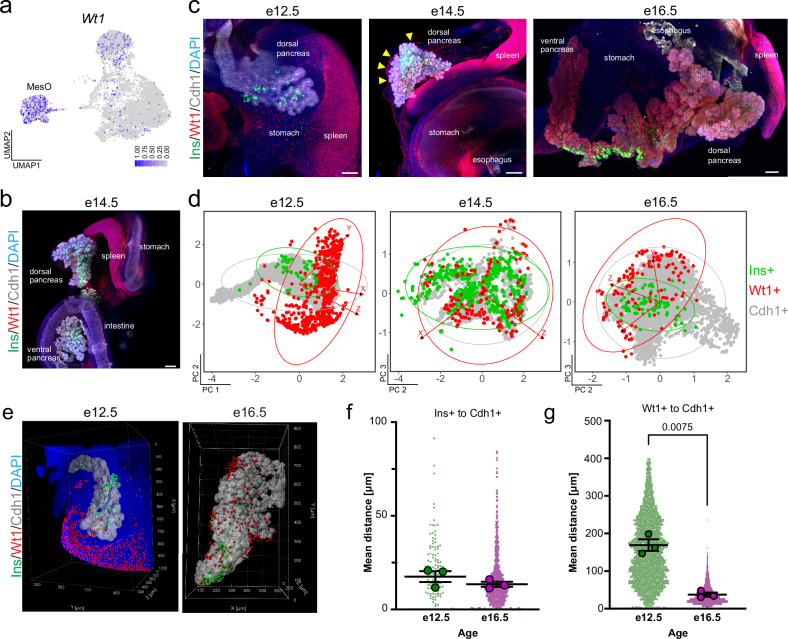
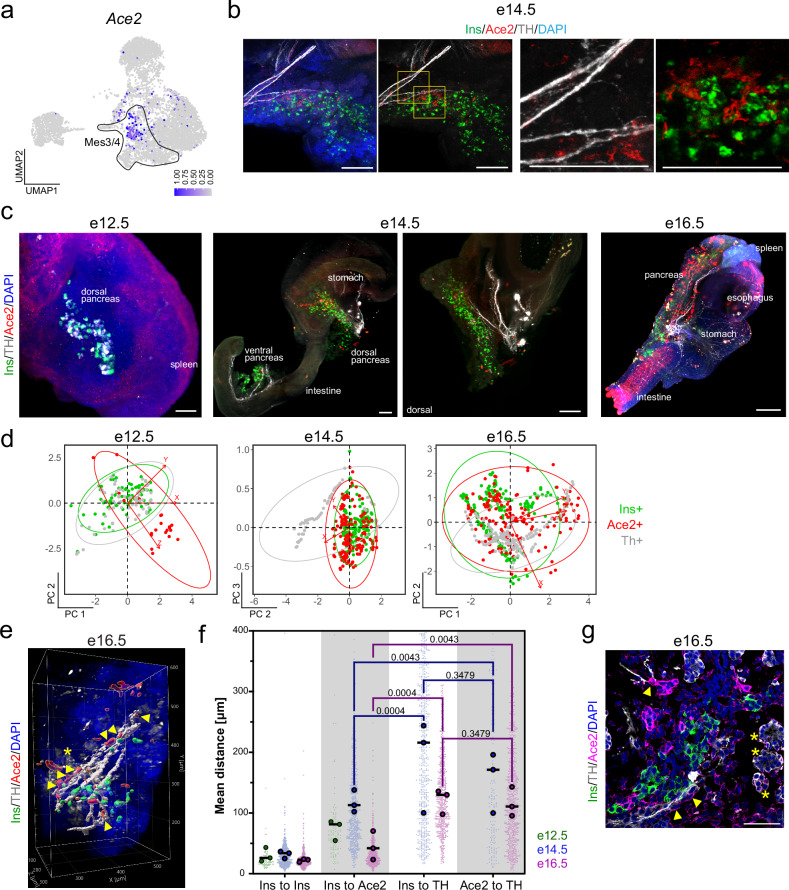
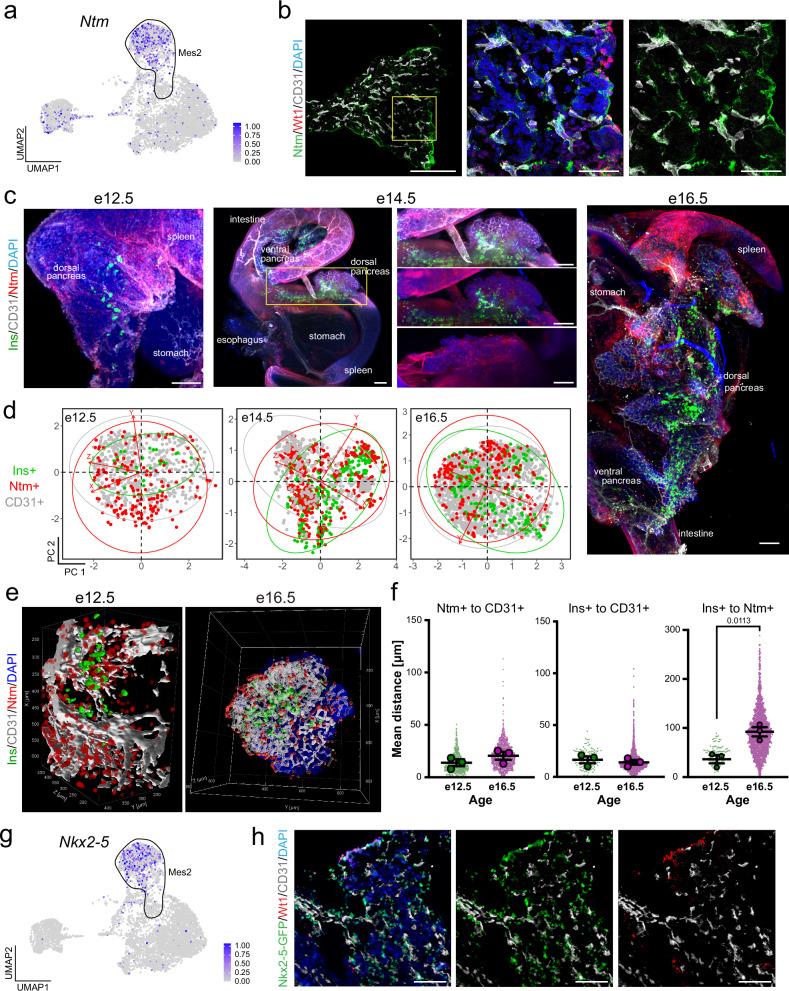
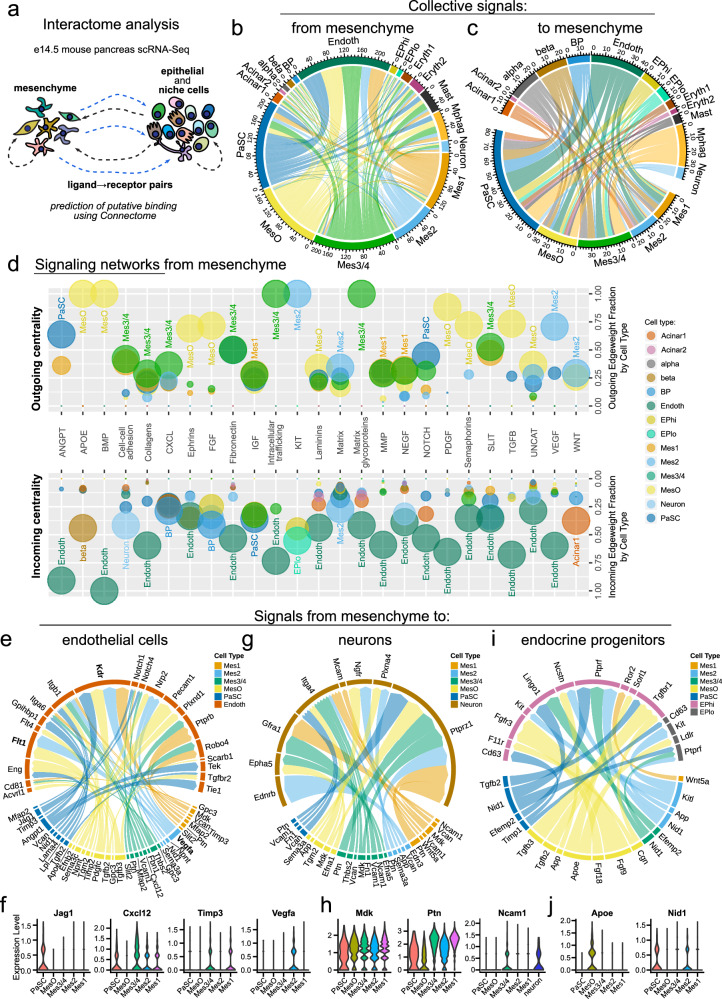
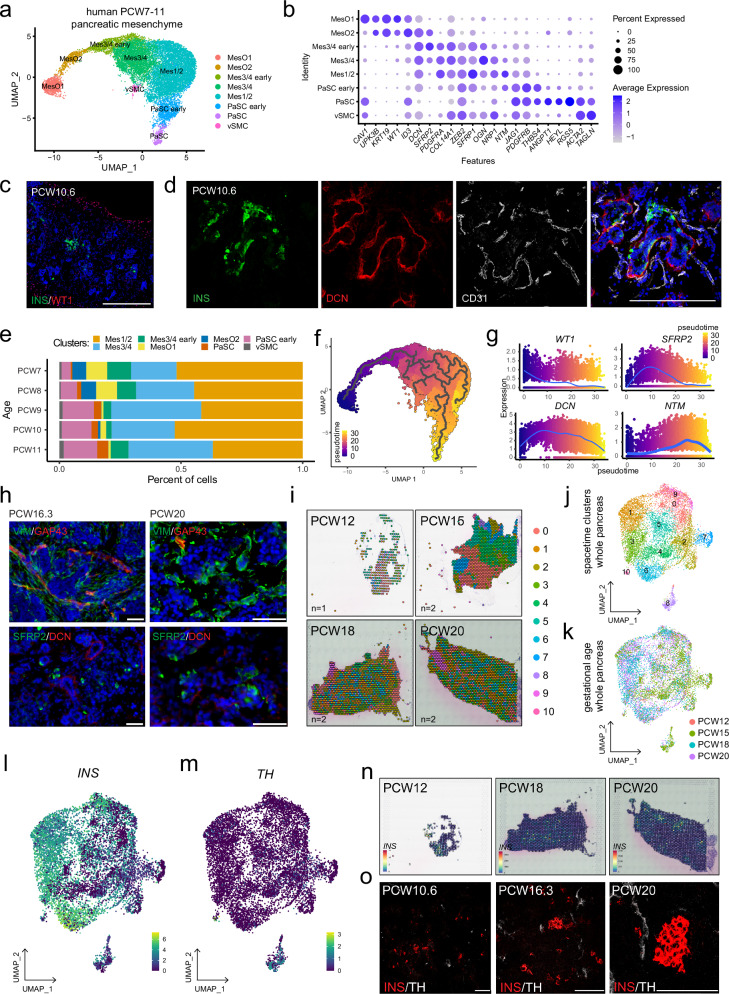
The spatial organization of cells within a tissue is dictated throughout dynamic developmental processes. We sought to understand whether cells geometrically coordinate with one another throughout development to achieve their organization. The pancreas is a complex cellular organ with a particular spatial organization. Signals from the mesenchyme, neurons, and endothelial cells instruct epithelial cell differentiation during pancreatic development. To understand the cellular diversity and spatial organization of the developing pancreatic niche, we mapped the spatial relationships between single cells over time. We found that four transcriptionally unique subtypes of mesenchyme in the developing pancreas spatially coordinate throughout development, with each subtype at fixed locations in space and time in relation to other cells, including beta cells, vasculature, and epithelial cells. Our work provides insight into the mechanisms of pancreatic development by showing that cells are organized in a space and time manner.


Conflict of interest statement

Competing interests: The authors declare no competing interests.

Figures

Fig. 1
Fig. 1. Mesenchymal subtypes in the developing pancreas exhibit distinct spatial distributions.
a Schematic illustration of the experimental pipeline. We have subclustered mesenchymal cells from our previously published single-cell RNA sequencing dataset to further characterize specific mesenchymal subtypes by bioinformatic analyses and experimental validation, i.e., lineage tracing and 3D spatial mapping. b UMAP feature plot representation of 6,637 single mesenchymal cell transcriptomes grouped by graph-based clustering. c Heatmap of the top 10 variably expressed genes for each subcluster (x-axis) in single mesenchymal cells (y-axis). The expression ranges from low (dark purple) to high (yellow). d Dot plot showing select mesenchymal subtype marker genes, with denoted prevalence (i.e., % of cells within a cluster that expresses a marker; pct. exp., dot size) and average expression levels (avg. exp., dot color) for each subtype. e Immunostaining of the mouse e14.5 pancreas showing the developing pancreatic epithelium (Cdh1, red) and the expression of the mesenchyme subtype markers Gap43 (Mes1) and Dcn (Mes1, Mes3/4, and MesO) (both green). Nuclei are labeled with DAPI (blue). Scale bar = 50 μm. f Immunostaining of the mouse e14.5 pancreas showing developing pancreatic beta cells (Ins, white) and mesenchymal cells marked by Gap43 (red) and Dcn (green) in proximity. Nuclei are labeled with DAPI (blue). Scale bar = 50 μm. g Frequency distribution plots showing the percentages of Gap43+ (Mes1), Dcn+ (Mes1, Mes3/4, MesO) and double-positive Gap43+Dcn+ (Mes1) cells at specific binned proximities to Ins+ endocrine cells, corresponding to (f). N = 4 mice (e14.5), with 3–8 images quantified per animal. The error bars represent the SEM. *p < 0.05, **p < 0.01, ***p < 0.005. h. Immunostaining of the mouse e14.5 pancreas showing the epithelium (Cdh1+, white) and mesothelium (Wt1+ MesO, red). Nuclei are labeled with DAPI (in blue). Scale bars = 200 μm. i Frequency distribution plots showing the frequency of Wt1+ cells within a specific 25 μm binned distance to the e14.5 pancreas periphery, corresponding to (h). N = 3 mice. ****p < 0.001.
Fig. 2
Fig. 2. The mesothelium gives rise to other pancreatic mesenchyme cells during embryogenesis.
a UMAP plot showing the pseudotime values of single e14.5 mesenchymal cells calculated by Monocle3. b Density plots showing the distribution of mesenchymal cells over pseudotime. c UMAP plot showing the inferred trajectories based on Monocle3 predictions. d Left: Schematic for lineage tracing of Wt1-CreERt2 mice crossed with Rosa-mTmG. Mice were pulsed with tamoxifen (tmxf) to label Wt1+ cells and their progeny with GFP at e12.5, and tissue was collected at e14.5 for immunofluorescence (IF) analysis. Right: Immunostaining showing GFP+ cells (e12.5 Wt1+ progeny, green) overlapping in expression with Wt1+ (MesO), Dcn+ (Mes1, Mes3/4, MesO), Ntm+ (Mes2), and Ace2+ (Mes4) cells in the red channel. Yellow arrows show overlapping GFP+ and marker-positive cells, white arrows show GFP+ cells alone, and circles in the bottom panel mark GFP+ cells. DAPI (blue) was used to stain the nuclei. Scale bars = 50 μm. e Left: Schematic for lineage tracing of Pdgfra-CreERt mice crossed with Rosa-mTmG, analyzed as in B. Right: Immunostaining showing GFP+ cells (e12.5 Pdgfra+ progeny, green) that lacked coexpression with Wt1+ (MesO), Gap43+ (Mes1), Ntm+ (Mes2), and Sfrp2+ (Mes3/4) cells (red). DAPI (blue) was used to stain the nuclei. Scale bars = 50 μm. See also Supplementary Fig. 3b.
Fig. 3
Fig. 3. Space–time mapping of the pancreatic MesO.
a Single-cell RNA-sequencing UMAP feature plot showing the expression of Wt1, with dark blue indicating high expression and gray indicating no expression. The MesO subtype is denoted. b Representative maximum-intensity projection light-sheet microscopy image of intact, optically cleared e14.5 pancreas and surrounding organs immunostained for the Wt1+ MesO marker (red), beta cells (Ins+, green), and epithelium (Cdh1+, gray). Nuclei are labeled with DAPI (blue). Scale bars = 200 μm. See also Supplementary Fig. 5b. c Representative maximum-intensity projection light-sheet microscopy images of intact, optically cleared e12.5, e14.5 and e16.5 mouse pancreata stained as in (b). In the e14.5 image, arrowheads point to the pancreatic MesO layer. Nuclei are labeled with DAPI (blue). Scale bars = 100 μm (e12.5), 200 μm (e14.5 and e16.5). See also Supplementary Fig. 5c. d Principal component analysis from X, Y, and Z position coordinates derived from an overlaid 3D grid. Each dot represents an individual cell, with similarly localized cells in closer proximity, whereas those at further distances are more separate within the plotted dimensions (PCs). Ellipses indicate regions including 95% of the cells within a cell type population. e 3D rendering of MesO (red), beta cells (green) and epithelium (white) in the whole region of the e12.5 and the middle region of e16.5 mouse pancreata immunostained for Wt1, Ins and Cdh1, respectively, captured by light-sheet microscopy. In e12.5, the DAPI staining signal (blue) is shown to visualize the nuclei. f, g Plots of Euclidean three-space distances between Ins+ or Wt1+ cells and the Cdh1+ epithelium in e12.5 and e16.5 mouse pancreata. Large dots represent the mean shortest distance between individual cells per embryo, whereas small dots represent the shortest distance measurements for individual cells. The bars indicate the means and SEMs of biological replicates. P values were determined by Brown-Forsythe and Welch one-way ANOVA tests with Dunnett’s T3 multiple comparisons tests and are shown for statistically significant differences. N = 3 embryos and for individual cells: (Ins+ to Cdh1+) N = 128 for e12.5 and 865 for e16.5, and (Wt1+ to Cdh1+) N = 6,100 for e12.5 and 4,606 for e16.5.
Fig. 4
Fig. 4. Space–time mapping of the Ace2+ mesenchyme relative to innervating neurons and beta cells.
a Single-cell RNA sequencing UMAP feature plot showing the mesenchymal expression of Ace2, with dark blue indicating high expression and gray indicating no expression. The circle outlines Mes3/4. b Representative immunostaining images of the optically cleared 3D mouse e14.5 pancreas for beta cells (Ins, green), Ace2+ mesenchyme (red), neurons (TH, gray), and nuclei (DAPI, blue). Scale bars = 200 μm. c Representative maximum-intensity projection light-sheet microscopy images of intact, optically cleared e12.5, e14.5, and e16.5 mouse pancreata immunostained for Ace2+ mesenchyme (red), beta cells (Ins+, green), and sympathetic neurons (TH+, not present at e12.5). Nuclei are labeled with DAPI (blue). Scale bars = 100 μm (e12.5), 200 μm (e14.5), and 500 μm (e16.5). See also Supplementary Fig. 6b. d Principal component analysis from X, Y, and Z position coordinates derived from an overlaid 3D grid. Each dot represents an individual cell, with similarly localized cells in closer proximity, whereas those at further distances are more separate within the plotted dimensions (PCs). Ellipses indicate regions including 95% of the cells within a cell type population. e Example 3D rendering of the Ace2+ mesenchyme (red), Ins+ beta cells (green) and TH+ sympathetic neurons (white) in the middle region of the e16.5 mouse pancreas, as captured by light-sheet microscopy. TH+ staining indicates sympathetic neurons and alpha cells (asterisk-marked cells at e16.5). Arrowheads indicate Ace2+ cells close to neuronal processes. An asterisk indicates TH-expressing alpha cells. The DAPI staining signal (blue) is shown to visualize the nuclei. f Plots of Euclidean three-space distances between Ins+, Ace2+ cells, and TH+ neurons in e14.5 (left) and e16.5 (right) mouse pancreata. At e12.5, there are no TH+ neural processes. Large dots represent the mean shortest distance between individual cells per embryo, whereas small dots represent the shortest distance measurements for individual cells. The bars indicate the means and SEMs of biological replicates. P values were determined by Brown-Forsythe and Welch one-way ANOVA tests with Dunnett’s T3 multiple comparisons tests. N = 3 embryos and for individual cells: (Ins+ to Ins+, Ins+ or TH+) N = 675 for e14.5 and 600 for e16.5, and (Ace2+ to TH+) N = 170 for e14.5 and 692 for e16.5. g Representative confocal images of the mouse e16.5 pancreas immunostained for Ace2 (magenta), beta cells (Ins+, green), and TH+ sympathetic neurons (gray). Arrowheads indicate Ace2+ mesenchymal cells close to neuronal processes, and asterisks indicate TH+ alpha cells. Nuclei are labeled with DAPI (blue). Scale bar = 50 μm.
Fig. 5
Fig. 5. Spatial mapping of Mes2 relative to endothelial cells and beta cells.
a Single-cell RNA-sequencing UMAP feature plot showing the expression of Ntm, with dark blue indicating high expression and gray indicating no expression. The Mes2 subtype is denoted. b Immunostaining of the mouse e14.5 pancreas showing the Mes2 population (Ntm+, green), MesO (Wt1+, red), and endothelium (CD31+, gray), with nuclei labeled with DAPI (blue). Scale bars = 200 μm (left-most image) and 50 μm (two right images). c Representative maximum-intensity projection light-sheet microscopy images of intact, optically cleared e12.5, e14.5, and e14.5 mouse pancreata immunostained for Mes2 (Ntm+, red), beta cells (Ins+, green), and endothelium (CD31+, gray). Nuclei are marked by DAPI in blue. Scale bars = 200 μm. d Principal component analysis from X, Y, and Z position coordinates derived from an overlaid 3D grid. Each dot represents an individual cell, with similarly localized cells in closer proximity, whereas those at further distances are more separate within the plotted dimensions (PCs). Ellipses indicate regions including 95% of the cells within a cell type population. e 3D rendering of Mes2 (Ntm, red), beta cells (Ins, green) and blood vessels (CD31, white) in the whole e12.5 and the middle region of e16.5 mouse pancreata immunostained for Ntm, Ins, and CD31, respectively, captured by light-sheet microscopy. In e16.5, the DAPI staining signal (blue) is shown to visualize the nuclei. f Plots of Euclidean three-space distances between Ntm+ or Ins+ cells and CD31+ endothelial cells or between Ins+ and Ntm+ cells in e12.5 and e16.5 mouse pancreata. Large dots represent the mean shortest distance between individual cells per embryo, whereas small dots represent the shortest distance measurements for individual cells. The bars indicate the means and SEMs of biological replicates. P values were determined by Brown-Forsythe and Welch one-way ANOVA tests with Dunnett’s T3 multiple comparisons tests and are shown for statistically significant differences. N = 3 embryos and for individual cells: (Ntm+ to CD31+) N = 857 for e12.5 and 1397 for e16.5, (Ins+ to CD31+ and Ins+ to Ntm+) N = 124 for e12.5 and 2207 for e16.5. g Single-cell RNA-sequencing UMAP feature plot showing the expression of Nkx2-5, with dark blue indicating high expression and gray indicating no expression. The Mes2 subtype is denoted. h Immunostaining of the Nkx2-5-GFP e14.5 mouse pancreas. Nkx2-5-GFP marks Mes2 (green), MesO marked by Wt1 (red), endothelial cells marked by CD31 (white), and nuclei marked by DAPI (blue). Scale bars = 100 μm.
Fig. 6
Fig. 6. Intercellular interaction maps of pancreatic mesenchyme subtypes.
a Schematic illustration of interactome analysis of the e14.5 mouse pancreas. Connectome interaction maps showing the predicted cellular communication from mesenchymal subtypes to other cells of the developing pancreas (b) and from the other cells to mesenchymal subtypes (c). Lines show mesenchymal-expressed ligands computationally linked to receptors expressed in other cell types. Line colors indicate the ligand cell type of origin. d Signaling networks from mesenchymal subtypes to other cell types are shown by dot plot visualization of centrality analysis. Selected signaling networks (x-axis) are shown, with the upper outgoing graphs showing the expression of network ligands in mesenchymal subtypes and the lower incoming graphs showing corresponding network receptors in other pancreatic cell types. The color of each dot represents the cell type. The edgeweight fraction (y-axis) reflects the weighted use of a network, with values closer to 1 indicating cell types with greater use in relation to other cell types. The in-graph labels indicate the cell types with the highest edgeweight values within each network. The dot size reflects the normalized expression level of ligands (outcoming graph) or receptors (incoming graph) belonging to a network within a cell type. Connectome interaction maps showing the predicted cellular ligand‒receptor communication from mesenchymal subtypes to endothelial cells (e), neurons (g) and endocrine progenitors (i). Line colors indicate the ligand-expressing cell type, and the thickness of the line ends depends on the edgeweight score of each particular end, i.e., a ligand or a receptor score. Violin plots showing normalized expression of selected ligands in mesenchyme subtypes that putatively interact with receptors in endothelial cells (f), neurons (h), and endocrine progenitors (j).
Fig. 7
Fig. 7. Mesenchymal diversity in the developing human pancreas.
a Single-cell RNA-sequencing UMAP feature of mesenchyme subclustered from human fetal pancreata at 7–11 PCW (OMIX001616 dataset), with colors featuring mesenchymal subtypes. Clusters of proliferating mesenchymal cells (see Supplementary Fig. 9a) were not included in further analysis. b Dot plot of the expression of select murine mesenchymal subtype marker genes in the human PCW 7–11 pancreatic mesenchyme. Each dot represents a gene, with its size indicating the percentage of cells within a cluster expressing the marker (pct. exp.) and its color represents the average expression level (avg. exp.). c Representative immunostaining image of a human PCW 10.6 pancreas showing beta cells (INS, green) and WT1+ MesO (red). Nuclei are labeled with DAPI (blue). Scale bar = 200 μm. d Representative immunostaining image of a human PCW 10.6 pancreas showing developing beta cells (INS, green), blood vessels (CD31, white) and DCN+ mesenchyme (red). Nuclei are labeled with DAPI (blue). Scale bar = 200 μm. e Stack plot depicting the proportional distribution of pancreatic mesenchyme subtypes across different gestational ages (PCW 7–11) in the human fetal pancreas. f Monocle3 trajectory feature plot of the PCW 7–11 human fetal pancreas visualizing potential cell fate transitions. The trajectories are denoted by gray branching lines, with the color scale indicating pseudotime. Dark blue signifies the earliest computed timepoint, corresponding to MesO, and yellow indicates the latest computed timepoint, corresponding to PaSCs and the subpopulation of the Mes1/2 cluster. g Plots illustrating the dynamics of selected marker gene expression throughout the inferred cell fate trajectory. Dots represent individual cells. h Representative images of immunostained human PCW 16.3 and PCW 20 pancreata. The top panels show GAP43+ (red) mesenchyme and VIM+ staining (green) as global mesenchyme markers. The bottom panels show SFRP2+ (green) and DCN+ (red) mesenchyme. Nuclei are labeled with DAPI (blue). Scale bars = 50 μm. i Visualization of spatial transcriptomics clusters in human fetal pancreata at PCW 12, 15, 18, and 20 (GSE197317 dataset). Space–time UMAP feature plots of PCW 12, 15, 18, and 20 human fetal pancreata spatial transcriptomics with colors featuring mesenchymal subtypes (j) or gestational age (k). l, m. UMAP feature plots of INS and TH relative expression levels in PCW 12– to 20 human fetal pancreata. n Visualization of spatial INS expression in human fetal pancreata at PCW 12, 18, and 20. o Representative immunostaining of human pancreata PCW 10.6, 16.3, and 20 showing INS (red) and TH (white) expression. Scale bars = 100 μm.

Similar articles

References

    1. Golosow, N. & Grobstein, C. Epitheliomesenchymal interaction in pancreatic morphogenesis. Dev. Biol.4, 242–255 (1962). - PubMed
    1. Duvillié, B. et al. The mesenchyme controls the timing of pancreatic beta-cell differentiation. Diabetes55, 582–589 (2006). - PubMed
    1. Jacquemin, P. et al. An endothelial-mesenchymal relay pathway regulates early phases of pancreas development. Dev. Biol.290, 189–199 (2006). - PubMed
    1. Hibsher, D., Epshtein, A., Oren, N. & Landsman, L. Pancreatic mesenchyme regulates islet cellular composition in a patched/hedgehog-dependent manner. Sci. Rep.6, 38008 (2016). - PMC - PubMed
    1. Landsman, L. et al. Pancreatic mesenchyme regulates epithelial organogenesis throughout development. PLoS Biol.9, e1001143 (2011). - PMC - PubMed

LinkOut - more resources