

A phylogenetic approach to comparative genomics
- PMID: 39779997
- PMCID: PMC7617348
- DOI: 10.1038/s41576-024-00803-0
A phylogenetic approach to comparative genomics
Abstract
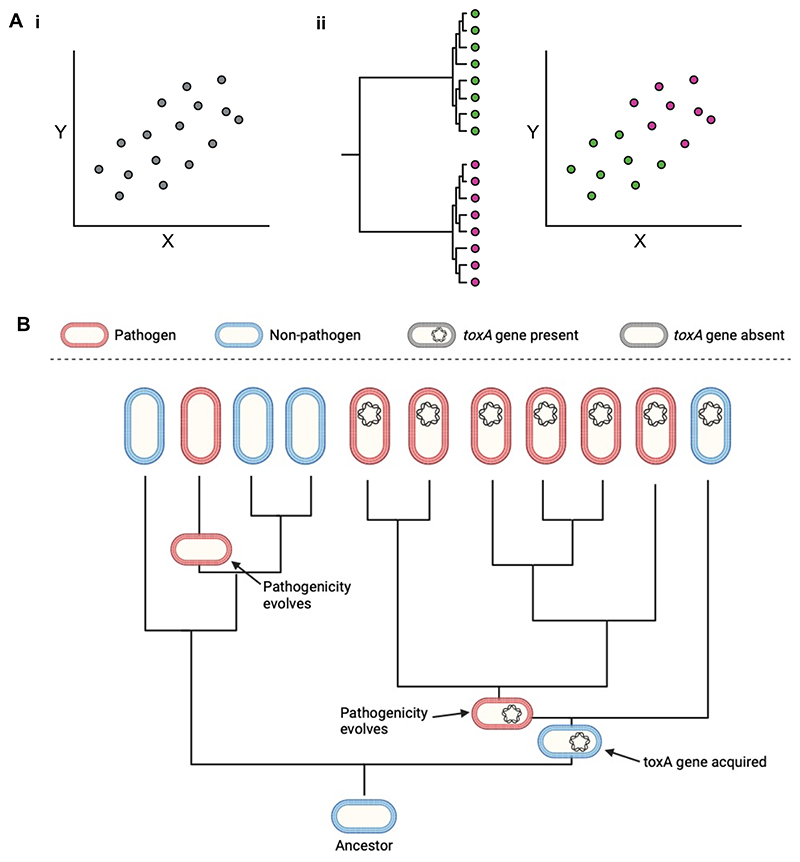
Comparative genomics, whereby the genomes of different species are compared, has the potential to address broad and fundamental questions at the intersection of genetics and evolution. However, species, genomes and genes cannot be considered as independent data points within statistical tests. Closely related species tend to be similar because they share genes by common descent, which must be accounted for in analyses. This problem of non-independence may be exacerbated when examining genomes or genes but can be addressed by applying phylogeny-based methods to comparative genomic analyses. Here, we review how controlling for phylogeny can change the conclusions of comparative genomics studies. We address common questions on how to apply these methods and illustrate how they can be used to test causal hypotheses. The combination of rapidly expanding genomic datasets and phylogenetic comparative methods is set to revolutionize the biological insights possible from comparative genomic studies.
© 2025. Springer Nature Limited.
Conflict of interest statement
Competing interests: The authors declare no competing interests.
Figures
Similar articles
-
Evolutionary Dynamics Based on Comparative Genomics of Pathogenic Escherichia coli Lineages Harboring Polyketide Synthase (pks) Island.mBio. 2021 Mar 2;12(1):e03634-20. doi: 10.1128/mBio.03634-20. mBio. 2021. PMID: 33653937 Free PMC article.
-
Phylogenomics: evolution and genomics intersection.Int J Bioinform Res Appl. 2009;5(5):548-63. doi: 10.1504/IJBRA.2009.028682. Int J Bioinform Res Appl. 2009. PMID: 19778869
-
MapGL: inferring evolutionary gain and loss of short genomic sequence features by phylogenetic maximum parsimony.BMC Bioinformatics. 2020 Sep 22;21(1):416. doi: 10.1186/s12859-020-03742-9. BMC Bioinformatics. 2020. PMID: 32962625 Free PMC article.
-
Trade-offs in detecting evolutionarily constrained sequence by comparative genomics.Annu Rev Genomics Hum Genet. 2005;6:143-64. doi: 10.1146/annurev.genom.6.080604.162146. Annu Rev Genomics Hum Genet. 2005. PMID: 16124857 Review.
-
Phylogenomics and the reconstruction of the tree of life.Nat Rev Genet. 2005 May;6(5):361-75. doi: 10.1038/nrg1603. Nat Rev Genet. 2005. PMID: 15861208 Review.
Cited by
-
Augmenting microbial phylogenomic signal with tailored marker gene sets.bioRxiv [Preprint]. 2025 Mar 15:2025.03.13.643052. doi: 10.1101/2025.03.13.643052. bioRxiv. 2025. PMID: 40161675 Free PMC article. Preprint.
References
-
- Binnewies TT, et al. Ten years of bacterial genome sequencing: comparative-genomics-based discoveries. Funct Integr Genomics. 2006;6:165–185. - PubMed
-
- Hunt M, Lima L, Shen W, Lees J, Iqbal Z. AllTheBacteria - all bacterial genomes assembled, available and searchable. 2024:2024.03.08.584059. doi: 10.1101/2024.03.08.584059. Preprint. - DOI
Publication types
MeSH terms
Grants and funding
LinkOut - more resources
Full Text Sources
