

CASP5 associated with PANoptosis promotes tumorigenesis and progression of clear cell renal cell carcinoma
- PMID: 39780201
- PMCID: PMC11716502
- DOI: 10.1186/s12935-024-03630-9
CASP5 associated with PANoptosis promotes tumorigenesis and progression of clear cell renal cell carcinoma
Abstract
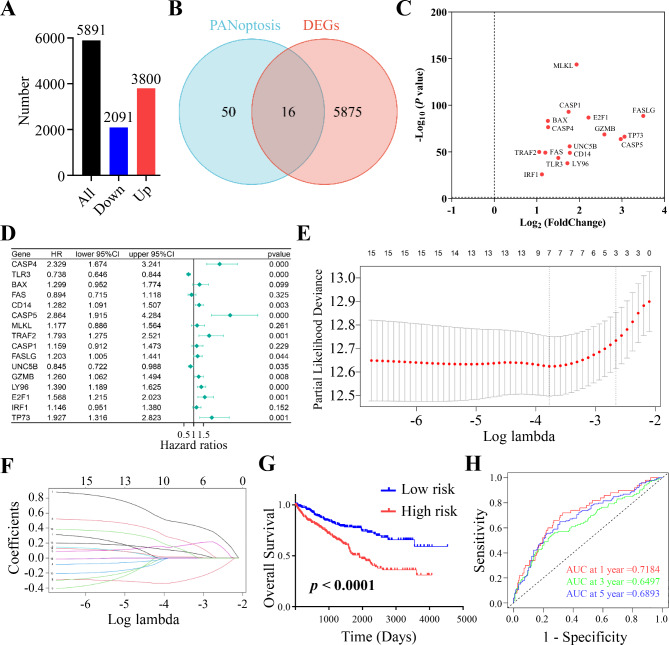
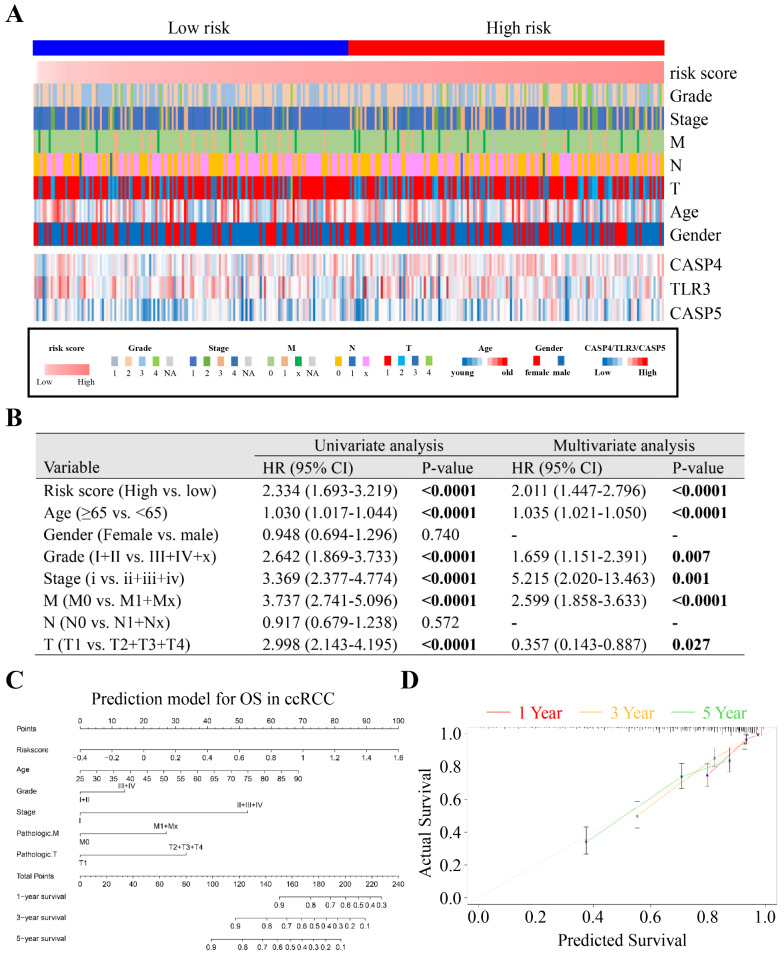
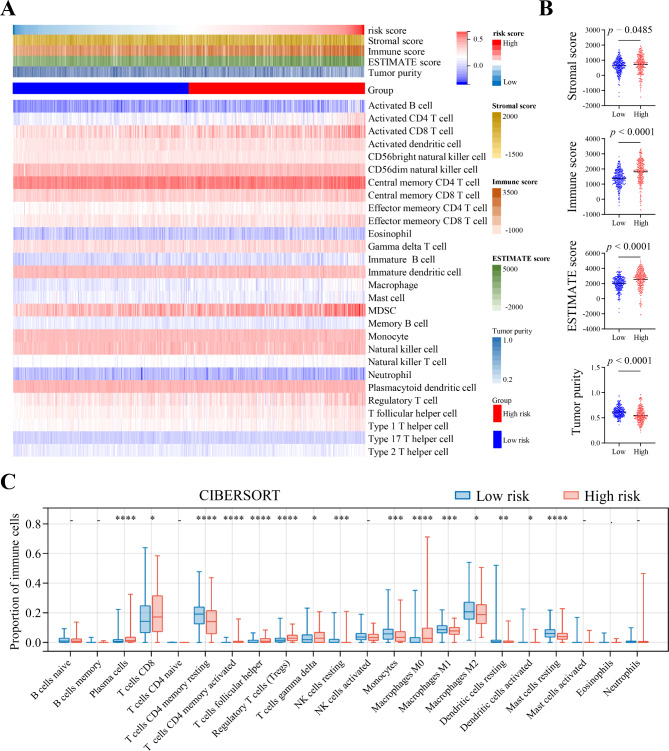
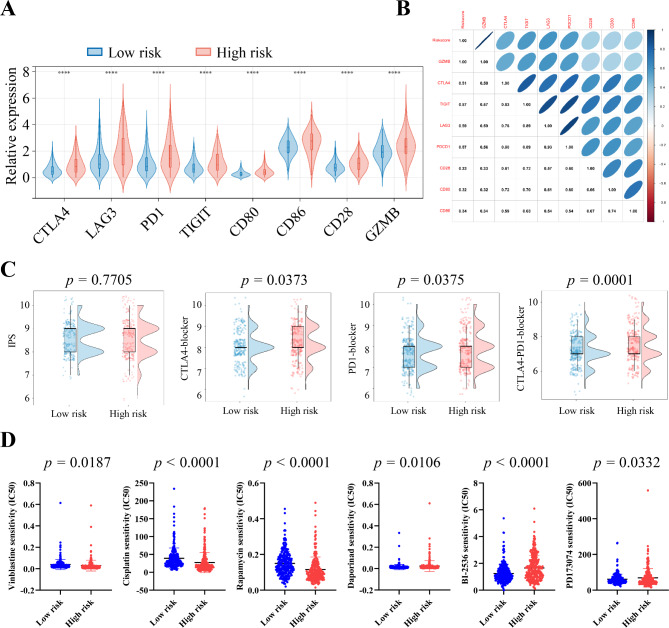
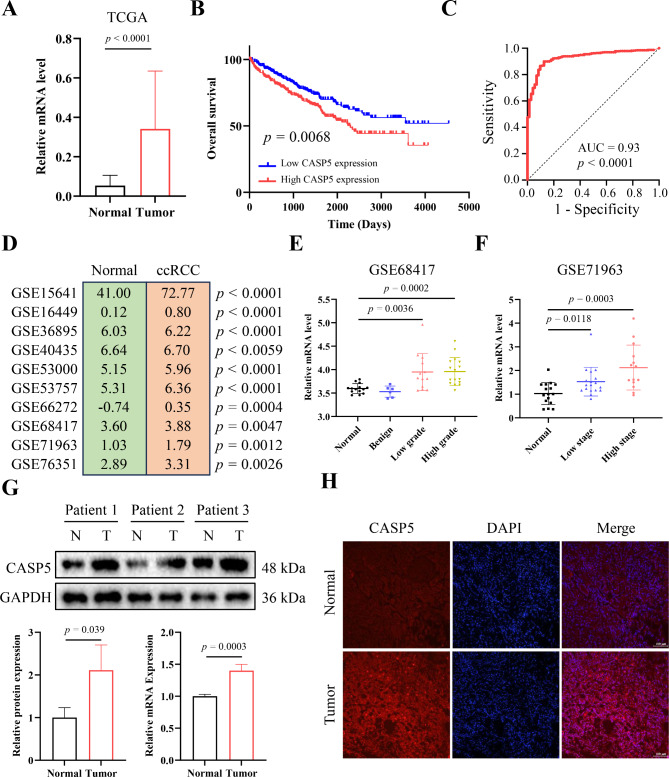
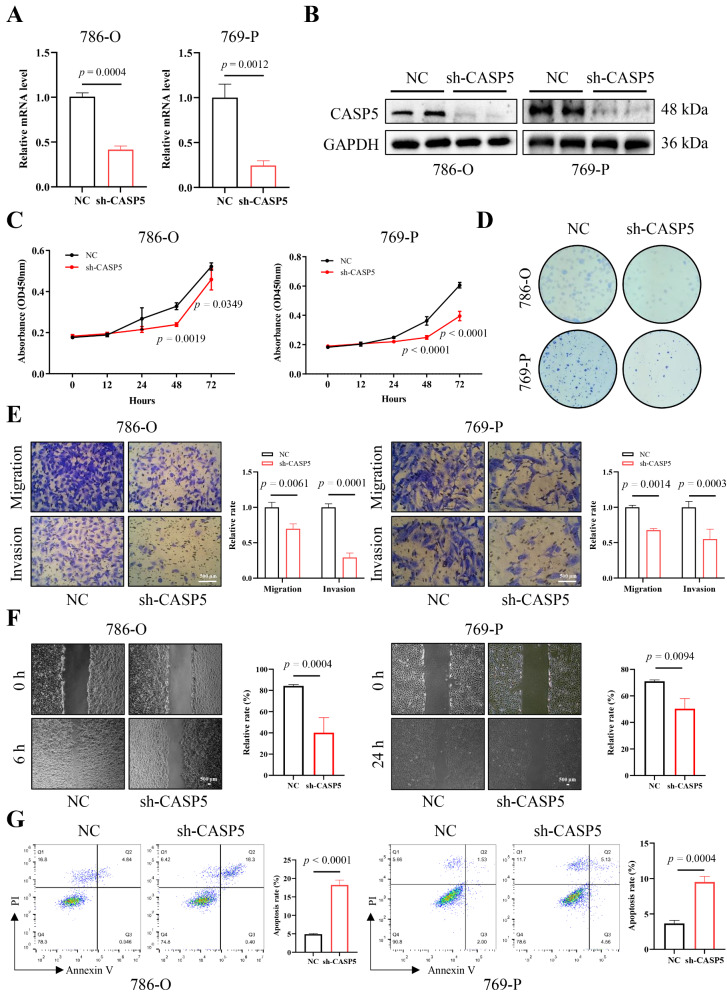
Clear cell renal cell carcinoma (ccRCC) is a globally severe cancer with an unfavorable prognosis. PANoptosis, a form of cell death regulated by PANoptosomes, plays a role in numerous cancer types. However, the specific roles of genes associated with PANoptosis in the development and advancement of ccRCC remain unclear. Our study developed a risk model utilizing three PANoptosis-associated genes (Caspase 4 (CASP4), TLR3, and CASP5). This model demonstrated a high degree of precision in predicting the prognosis for patients with ccRCC. ccRCC patients in the high-risk group had the strongest immune cell activity, experiencing immune evasion, and might potentially derive advantages from treatment involving combined immune checkpoint inhibitors. CASP5 was highly expressed in ccRCC tissues by RT-qPCR, western blotting, and immunofluorescence. Stable CASP5 knockdown cell lines were constructed by lentivirus in vitro transfection technique. Reducing CASP5 level suppressed the growth, migration, and invasion of ccRCC cells, while encouraging cell apoptosis. In addition, the results of in vivo tumorigenesis experiments showed that down-regulating CASP5 expression inhibited the tumorigenic ability of 786-O cells. Together, the innovative risk model using PANoptosis-associated genes effectively forecasts the tumor microenvironment and survival rates for ccRCC, offering a novel approach to the early, precise diagnosis of ccRCC and the advancement of personalized treatment strategies.
Keywords: CASP5; Clear cell renal cell carcinoma; Immune infiltration landscape; PANoptosis; Risk model.
© 2024. The Author(s).
Conflict of interest statement
Declarations. Ethics approval and consent to participate: The study was approved by the Ethics Committee of the Affiliated Central Hospital of Dalian University of Technology (Dalian Central Hospital) (No. YN2024-053-01). All the study subjects provided informed consent. Competing interests: The authors declare no competing interests.
Figures

Similar articles
-
A Novel Defined PANoptosis-Related miRNA Signature for Predicting the Prognosis and Immune Characteristics in Clear Cell Renal Cell Carcinoma: A miRNA Signature for the Prognosis of ccRCC.Int J Mol Sci. 2023 May 28;24(11):9392. doi: 10.3390/ijms24119392. Int J Mol Sci. 2023. PMID: 37298343 Free PMC article.
-
Identification of a novel PANoptosis-related gene signature for predicting the prognosis in clear cell renal cell carcinoma.Medicine (Baltimore). 2024 Sep 27;103(39):e39874. doi: 10.1097/MD.0000000000039874. Medicine (Baltimore). 2024. PMID: 39331898 Free PMC article.
-
Comprehensive analysis of the role of immune-related PANoptosis lncRNA model in renal clear cell carcinoma based on RNA transcriptome and single-cell sequencing.Oncol Res. 2023 Jun 27;31(4):543-567. doi: 10.32604/or.2023.029563. eCollection 2023. Oncol Res. 2023. PMID: 37415739 Free PMC article.
-
Expression of gasdermin D in clear cell renal cell carcinoma and its effect on its biological function.Front Oncol. 2023 Jul 6;13:1163714. doi: 10.3389/fonc.2023.1163714. eCollection 2023. Front Oncol. 2023. PMID: 37483501 Free PMC article.
-
Identification of PANoptosis-related subtypes, construction of a prognosis signature, and tumor microenvironment landscape of hepatocellular carcinoma using bioinformatic analysis and experimental verification.Front Immunol. 2024 Apr 29;15:1323199. doi: 10.3389/fimmu.2024.1323199. eCollection 2024. Front Immunol. 2024. PMID: 38742112 Free PMC article.
Cited by
-
PANoptosis in cancer: bridging molecular mechanisms to therapeutic innovations.Cell Mol Immunol. 2025 Sep;22(9):996-1011. doi: 10.1038/s41423-025-01329-z. Epub 2025 Jul 28. Cell Mol Immunol. 2025. PMID: 40721869 Free PMC article. Review.
References
-
- Linehan WM, Ricketts CJ. The Cancer Genome Atlas of renal cell carcinoma: findings and clinical implications. Nat Reviews Urol. 2019;16(9):539–52. - PubMed
-
- Choueiri TK, Motzer RJ. Systemic therapy for metastatic renal-cell carcinoma. N Engl J Med. 2017;376(4):354–66. - PubMed
-
- Motzer RJ, Hutson TE, Tomczak P, Michaelson MD, Bukowski RM, Rixe O, Oudard S, Negrier S, Szczylik C, Kim ST, et al. Sunitinib versus interferon alfa in metastatic renal-cell carcinoma. N Engl J Med. 2007;356(2):115–24. - PubMed
-
- Hahn AW, Klaassen Z, Agarwal N, Haaland B, Esther J, Ye XY, Wang X, Pal SK, Wallis CJD. First-line treatment of metastatic renal cell carcinoma: a systematic review and network Meta-analysis. Eur Urol Oncol. 2019;2(6):708–15. - PubMed
Grants and funding
LinkOut - more resources
Full Text Sources
