

An integrative analysis reveals cancer risk associated with artificial sweeteners
- PMID: 39780215
- PMCID: PMC11708064
- DOI: 10.1186/s12967-024-06047-0
An integrative analysis reveals cancer risk associated with artificial sweeteners
Abstract
Background: Artificial sweeteners (AS) have been widely utilized in the food, beverage, and pharmaceutical industries for decades. While numerous publications have suggested a potential link between AS and diseases, particularly cancer, controversy still surrounds this issue. This study aims to investigate the association between AS consumption and cancer risk.
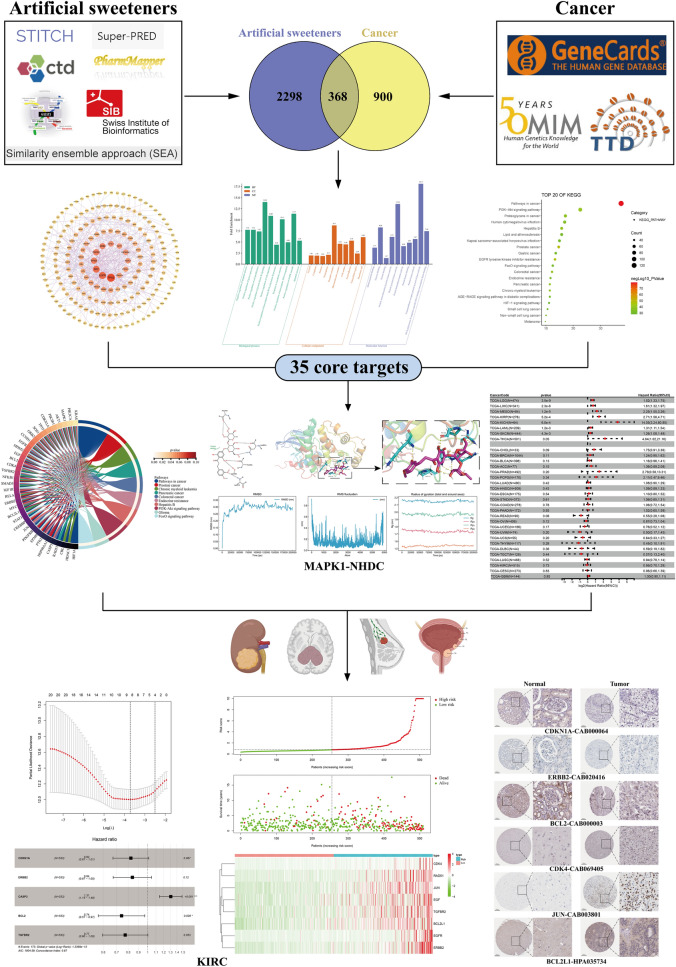
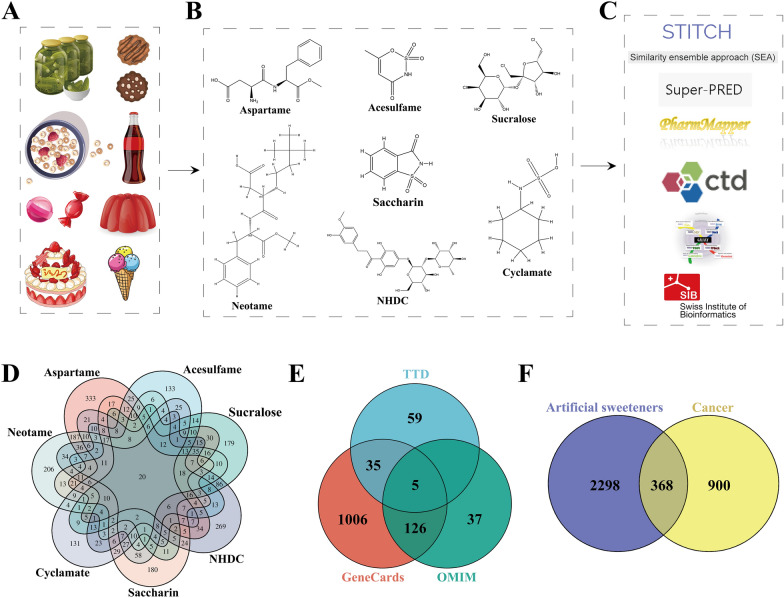
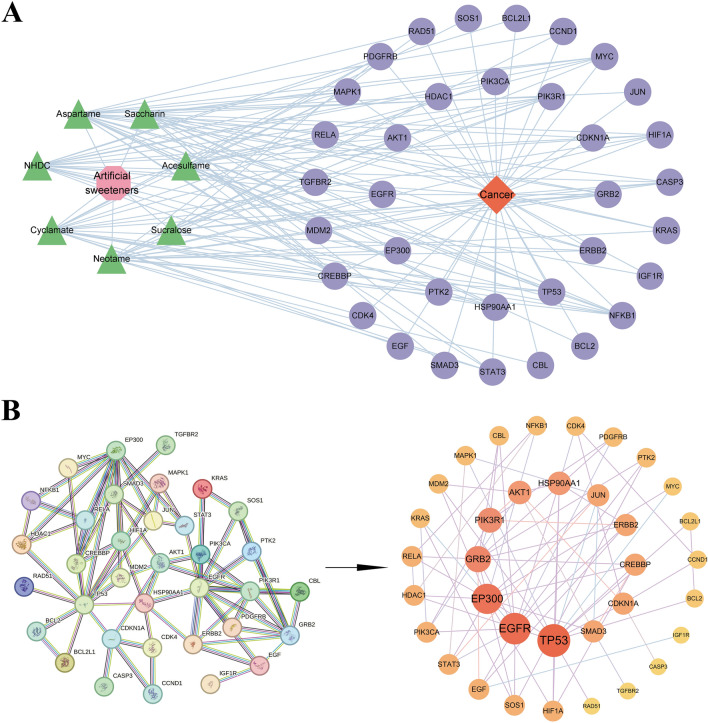
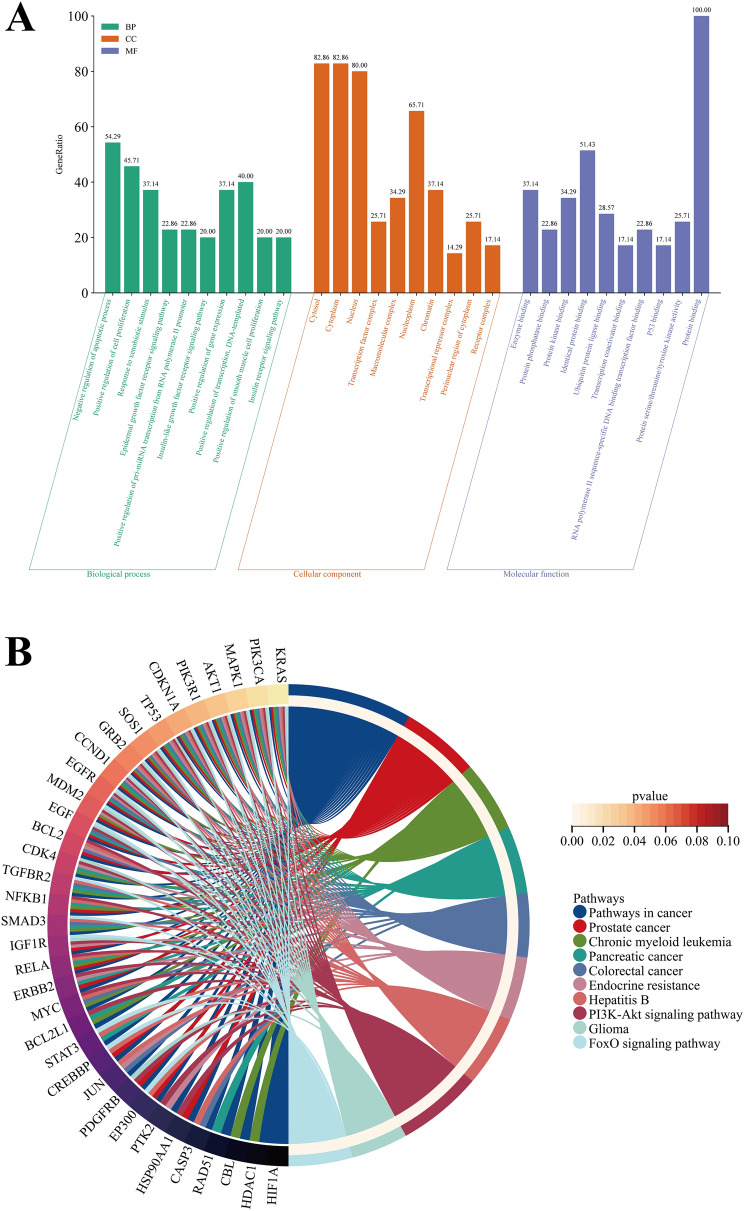
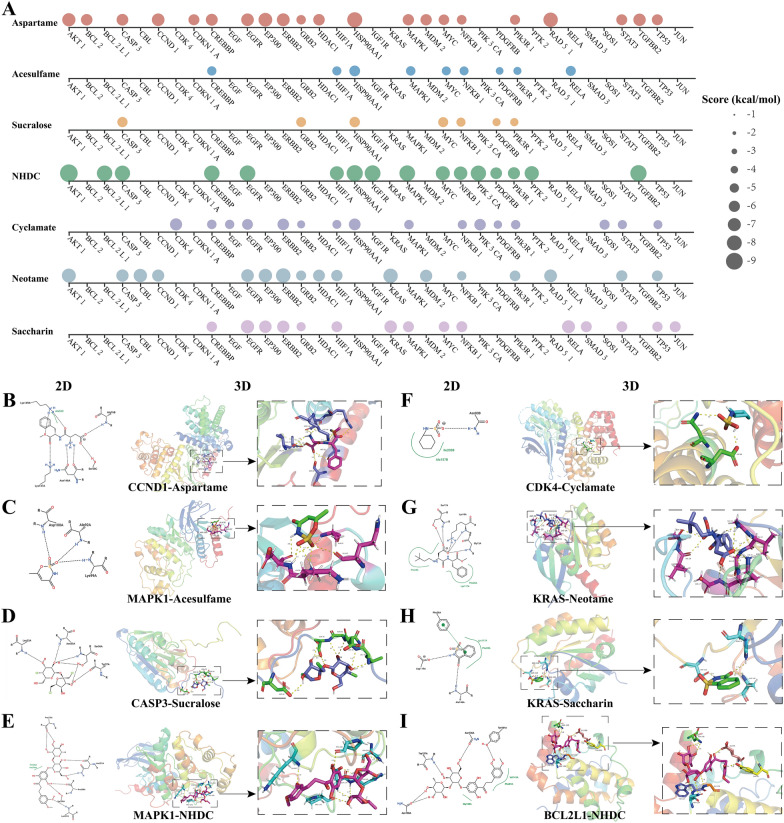
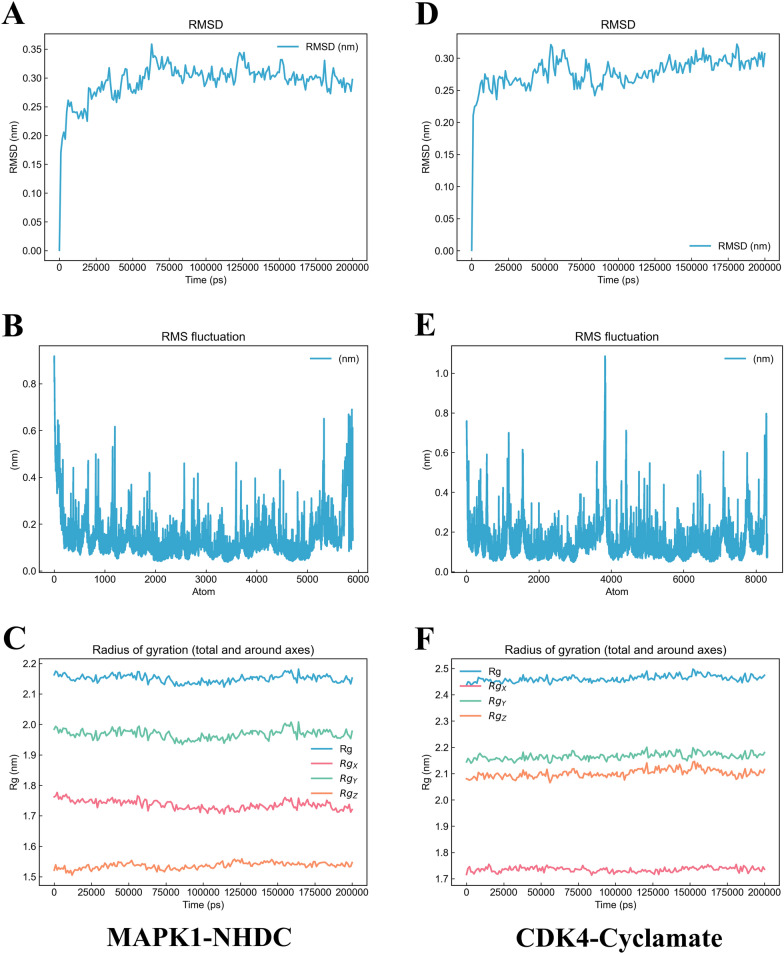
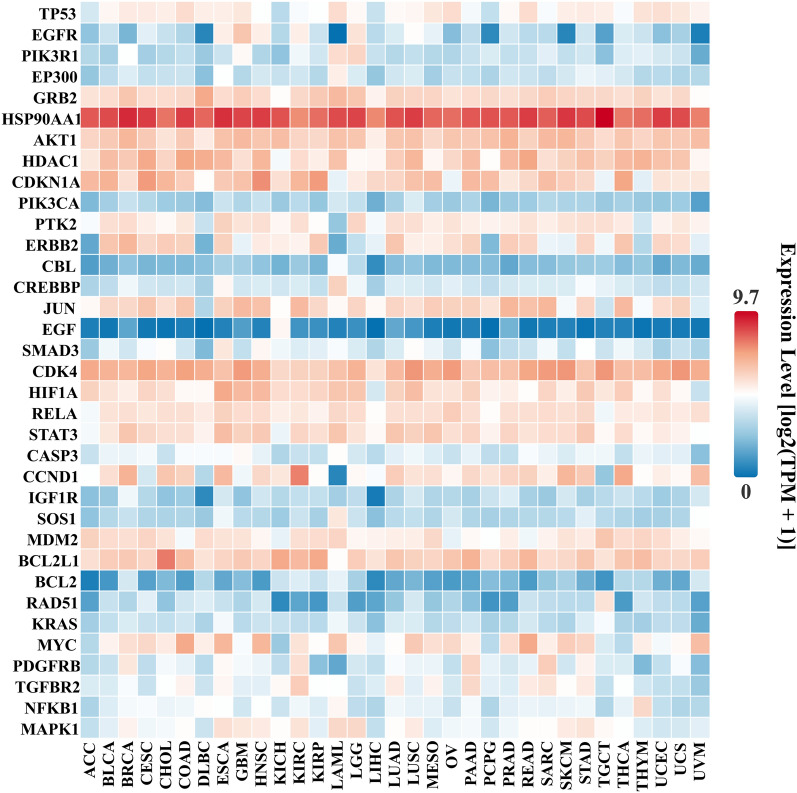
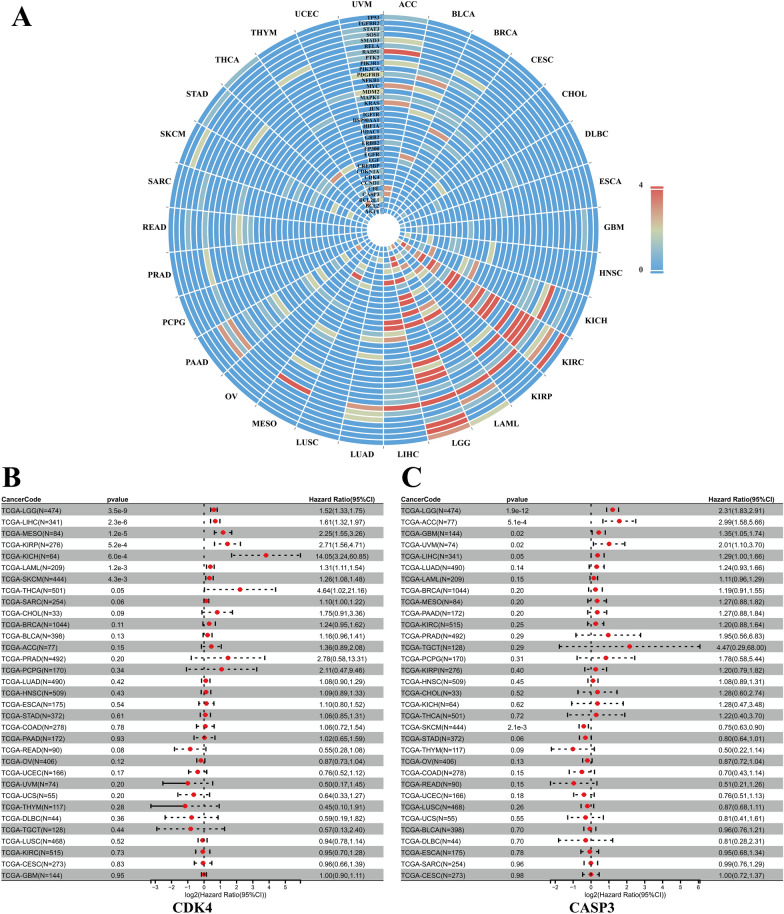
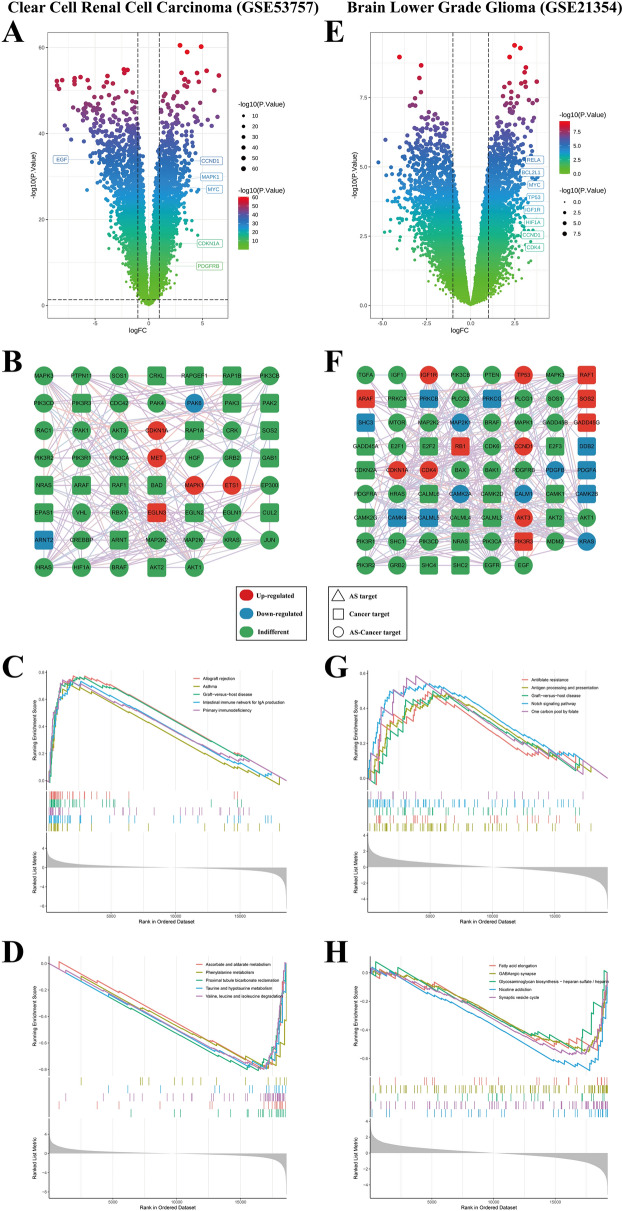
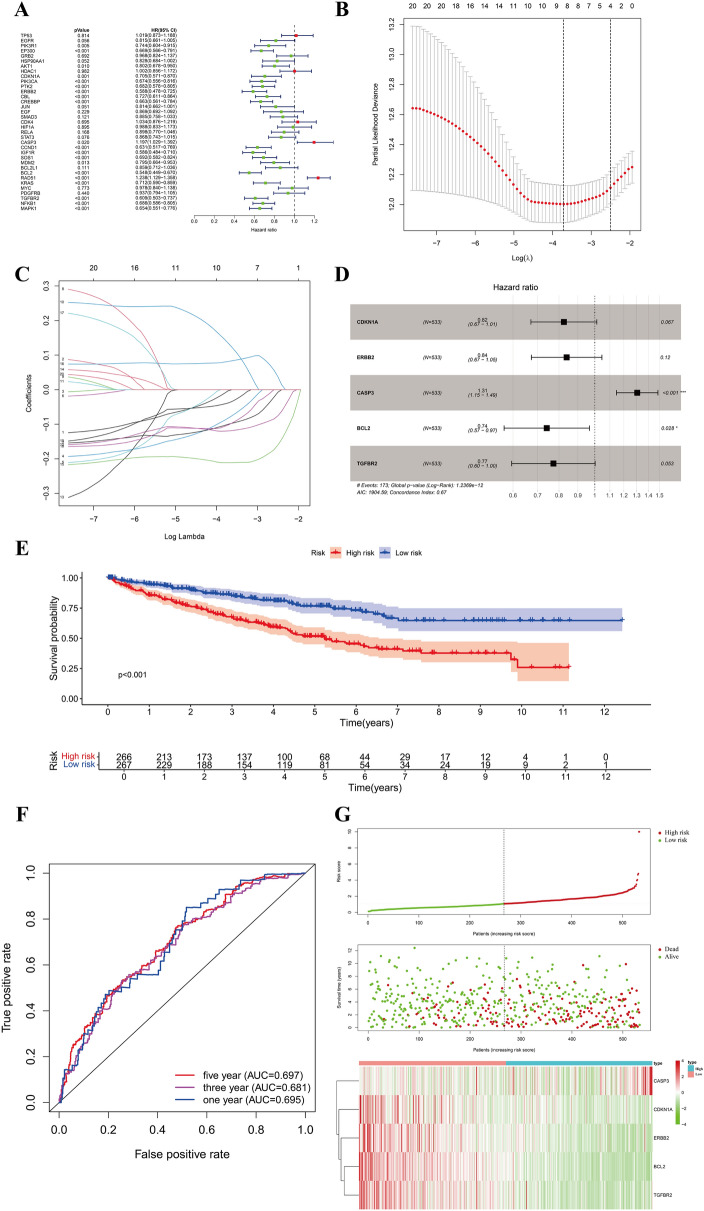
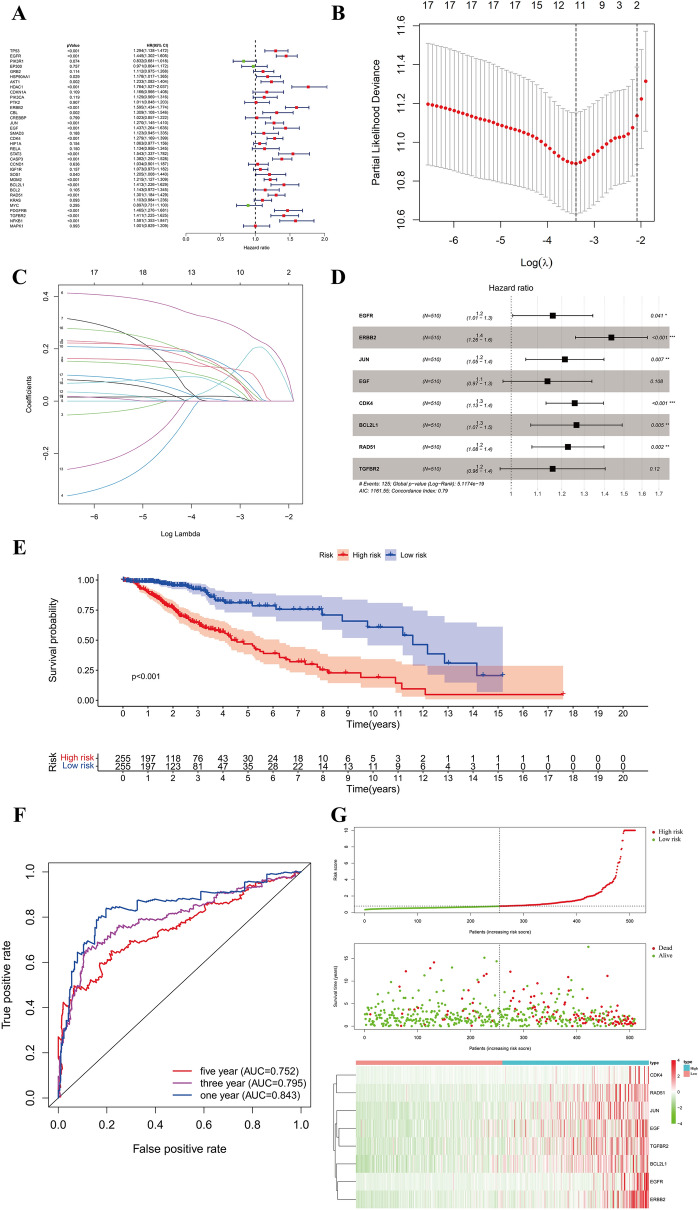
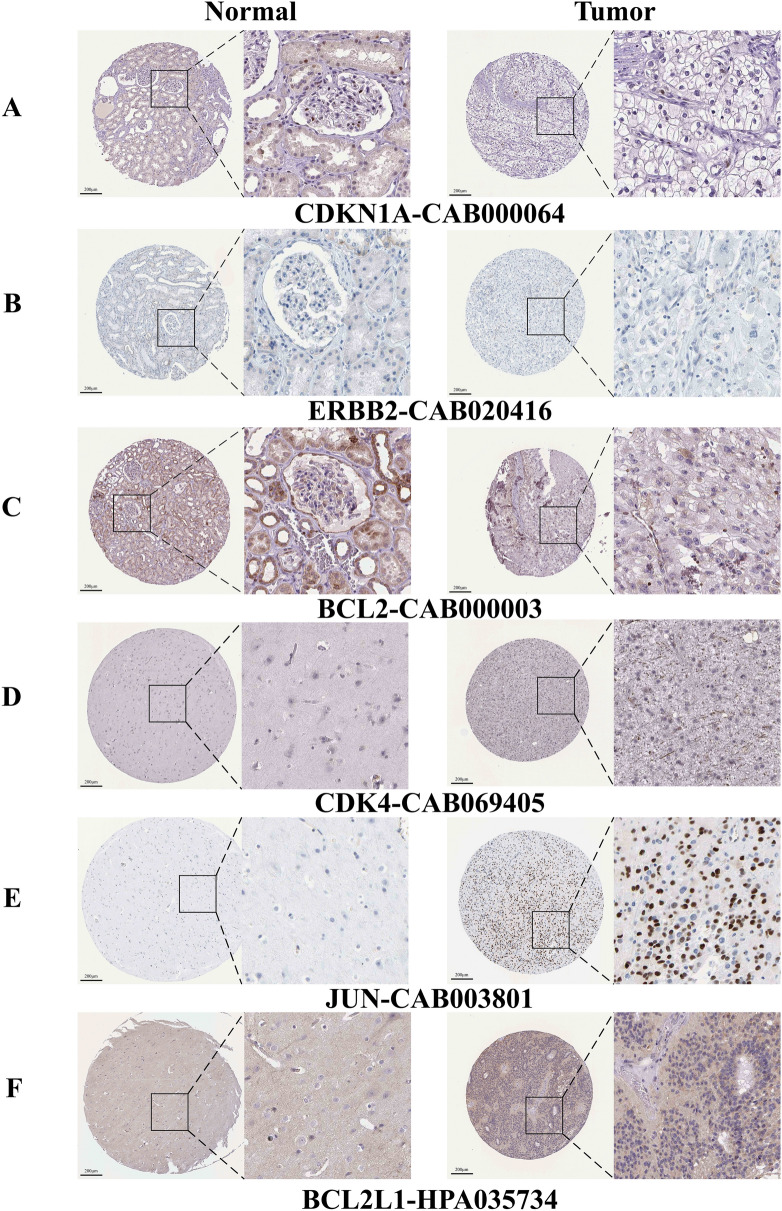
Methods: Targets associated with commonly used AS were screened and validated using databases such as CTD, STITCH, Super-PRED, Swiss Target Prediction, SEA, PharmMapper, and GalaxySagittarius. Cancer-related targets were sourced from GeneCards, OMIM, and TTD databases. AS-cancer targets were identified through the intersection of these datasets. A network visualization ('AS-targets-cancer') was constructed using Cytoscape 3.9.0. Protein-protein interaction analysis was conducted using the STRING database to identify significant AS-cancer targets. GO and KEGG enrichment analyses were performed using the DAVID database. Core targets were identified from significant targets and genes involved in the 'Pathways in cancer' (map05200). Molecular docking and dynamics simulations were employed to verify interactions between AS and target proteins. Pan-cancer and univariate Cox regression analyses of core targets across 33 cancer types were conducted using GEPIA 2 and SangerBox, respectively. Gene chip datasets (GSE53757 for KIRC, GSE21354 for LGG, GSE42568 for BRCA, and GSE46602 for PRAD) were retrieved from the GEO database, while transcriptome and overall survival data were obtained from TCGA. Data normalization and identification of differentially expressed genes (DEGs) were performed on these datasets using R (version 4.3.2). Gene Set Enrichment Analysis (GSEA) was employed to identify critical pathways in the gene expression profiles between normal and cancer groups. A cancer risk prognostic model was constructed for key targets to further elucidate their significance in cancer initiation and progression. Finally, the HPA database was utilized to investigate variations in the expression of key AS-cancer target proteins across KIRC, LGG, BRCA, PRAD, and normal tissues.
Results: Seven commonly used AS (Aspartame, Acesulfame, Sucralose, NHDC, Cyclamate, Neotame, and Saccharin) were selected for study. A total of 368 AS-cancer intersection targets were identified, with 48 notable AS-cancer targets, including TP53, EGFR, SRC, PIK3R1, and EP300, retrieved. GO biological process analysis indicated that these targets are involved in the regulation of apoptosis, gene expression, and cell proliferation. Thirty-five core targets were identified from the intersection of the 48 significant AS-cancer targets and genes in the 'Pathways in cancer' (map05200). KEGG enrichment analysis of these core targets revealed associations with several cancer types and the PI3K-Akt signaling pathway. Molecular docking and dynamics simulations confirmed interactions between AS and these core targets. HSP90AA1 was found to be highly expressed across the 33 cancer types, while EGF showed the opposite trend. Univariate Cox regression analysis demonstrated strong associations of core targets with KIRC, LGG, BRCA, and PRAD. DEGs of AS-cancer core targets across these four cancers were analyzed. GSEA revealed upregulated and downregulated pathways enriched in KIRC, LGG, BRCA, and PRAD. Cancer risk prognostic models were constructed to elucidate the significant roles of key targets in cancer initiation and progression. Finally, the HPA database confirmed the crucial function of these targets in KIRC, LGG, BRCA, and PRAD.
Conclusion: This study integrated data mining, machine learning, network toxicology, molecular docking, molecular dynamics simulations, and clinical sample analysis to demonstrate that AS increases the risk of kidney cancer, low-grade glioma, breast cancer, and prostate cancer through multiple targets and signaling pathways. This paper provides a valuable reference for the safety assessment and cancer risk evaluation of food additives. It urges food safety regulatory agencies to strengthen oversight and encourages the public to reduce consumption of foods and beverages containing artificial sweeteners and other additives.
Keywords: Artificial sweetener; Cancer; Core targets; Machine learning; Molecular dynamics simulation; Network toxicology; Pathways in cancer.
© 2025. The Author(s).
Conflict of interest statement
Declarations. Ethics approval and consent to participate: The public data we used to validate our key genes were sourced from the TCGA, GEO, and HPA databases, as cited in our paper. This data was utilized solely for research purposes. Consent for publication: The authors have all agreed to publication. Competing interests: The authors declare no competing interests.
Figures
Similar articles
-
Research on the Regulatory Mechanism of Ginseng on the Tumor Microenvironment of Colorectal Cancer based on Network Pharmacology and Bioinformatics Validation.Curr Comput Aided Drug Des. 2024;20(5):486-500. doi: 10.2174/1573409919666230607103721. Curr Comput Aided Drug Des. 2024. PMID: 37287284
-
Network pharmacology and transcriptomics reveal the mechanisms of FFBZL in the treatment of oral squamous cell carcinoma.Front Pharmacol. 2024 Sep 11;15:1405596. doi: 10.3389/fphar.2024.1405596. eCollection 2024. Front Pharmacol. 2024. PMID: 39323640 Free PMC article.
-
Exploring the Targets and Molecular Mechanisms of Curcumin for the Treatment of Bladder Cancer Based on Network Pharmacology, Molecular Docking and Molecular Dynamics.Mol Biotechnol. 2025 May;67(5):2138-2159. doi: 10.1007/s12033-024-01190-x. Epub 2024 Jun 1. Mol Biotechnol. 2025. PMID: 38822913
-
Exploring the antitumor potential of cucurbitacin B in hepatocellular carcinoma through network pharmacology, molecular docking, and molecular dynamics simulations.Naunyn Schmiedebergs Arch Pharmacol. 2025 May 21. doi: 10.1007/s00210-025-04273-x. Online ahead of print. Naunyn Schmiedebergs Arch Pharmacol. 2025. PMID: 40397117 Review.
-
Exploring the mechanism of action of Yiyi Fuzi Baijiang powder in colorectal cancer based on network pharmacology and molecular docking studies.Biotechnol Genet Eng Rev. 2023 Oct;39(2):1107-1127. doi: 10.1080/02648725.2023.2167765. Epub 2023 Feb 3. Biotechnol Genet Eng Rev. 2023. PMID: 36735641 Review.
Cited by
-
Multi-omics analysis of the anti-cancer effects of curcumol in endometrial carcinoma.Front Pharmacol. 2025 Jul 3;16:1565959. doi: 10.3389/fphar.2025.1565959. eCollection 2025. Front Pharmacol. 2025. PMID: 40678730 Free PMC article.
-
Metagenomics and transcriptomics analysis of aspartame's impact on gut microbiota and glioblastoma progression in a mouse model.Sci Rep. 2025 Jul 2;15(1):23298. doi: 10.1038/s41598-025-06193-5. Sci Rep. 2025. PMID: 40604039 Free PMC article.
References
-
- What Are Artificial Sweeteners? [https://health.usnews.com/wellness/food/articles/a-guide-to-artificial-s...].
-
- Kmietowicz Z. Artificial sweeteners do not aid weight loss or improve health, says WHO. BMJ. 2023;381:1112. - PubMed
-
- Guidelines Review Committee NaFSN. Use of non-sugar sweeteners: WHO guideline. Geneva: World Health Organization; 2023. - PubMed
MeSH terms
Substances
Grants and funding
- 2022BCE054/Local special projects in major health of Hubei Provincial Science and Technology Department
- 23xjz08A/Key scientific research projects of Hubei polytechnic University
- 23xjz04AK/Hubei polytechnic University · Huangshi Daye Lake high-tech Zone University Science Park joint open fund project
LinkOut - more resources
Full Text Sources
Medical
Research Materials
Miscellaneous
