

Predicting 28-day all-cause mortality in patients admitted to intensive care units with pre-existing chronic heart failure using the stress hyperglycemia ratio: a machine learning-driven retrospective cohort analysis
- PMID: 39780223
- PMCID: PMC11714879
- DOI: 10.1186/s12933-025-02577-z
Predicting 28-day all-cause mortality in patients admitted to intensive care units with pre-existing chronic heart failure using the stress hyperglycemia ratio: a machine learning-driven retrospective cohort analysis
Abstract
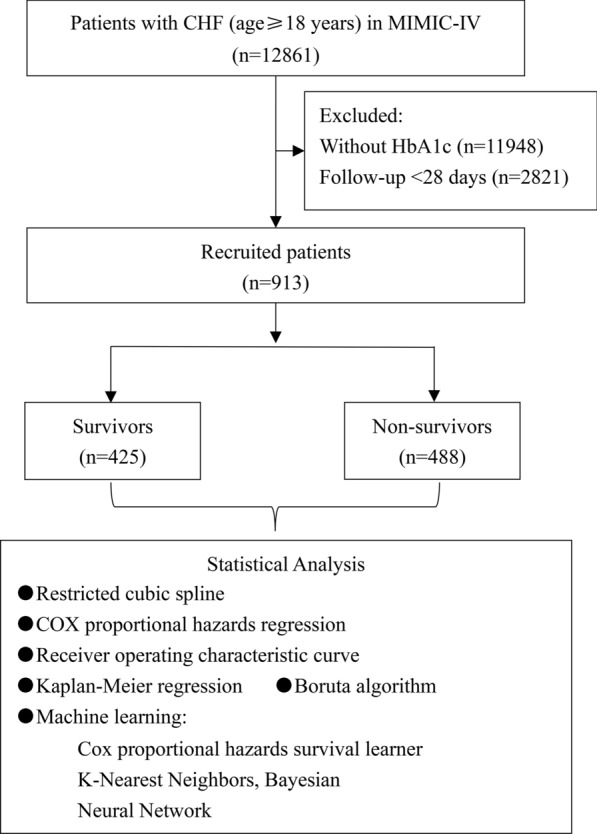
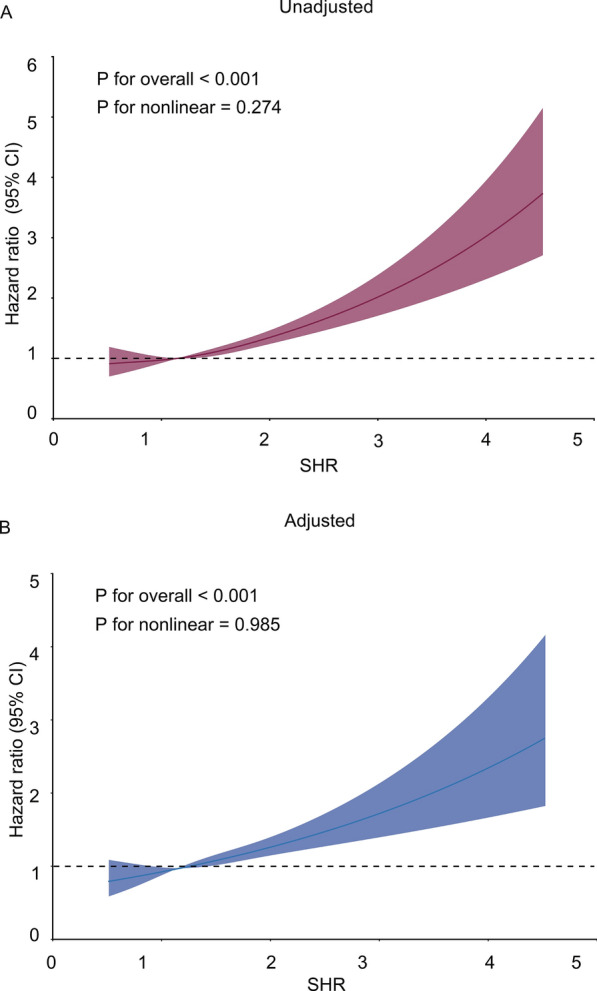
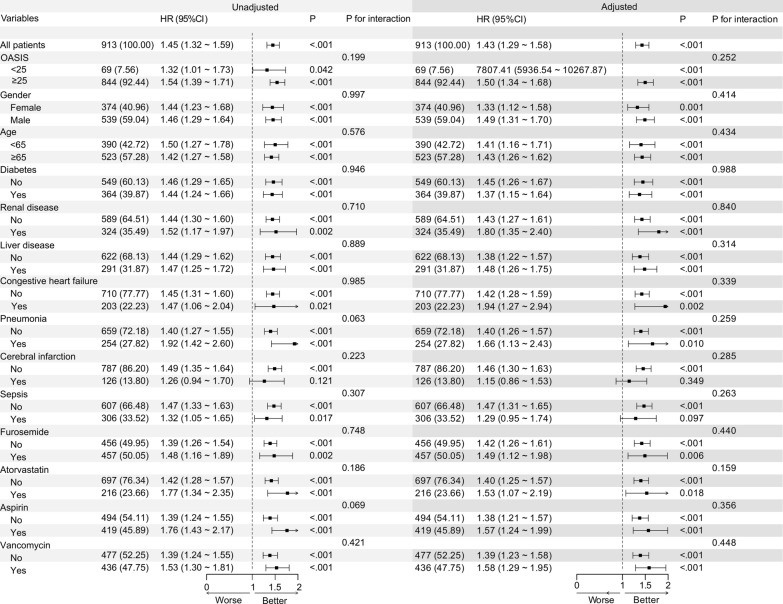
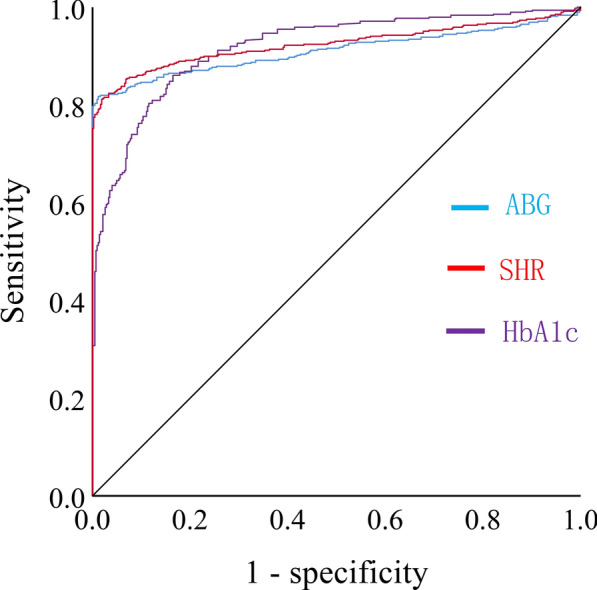
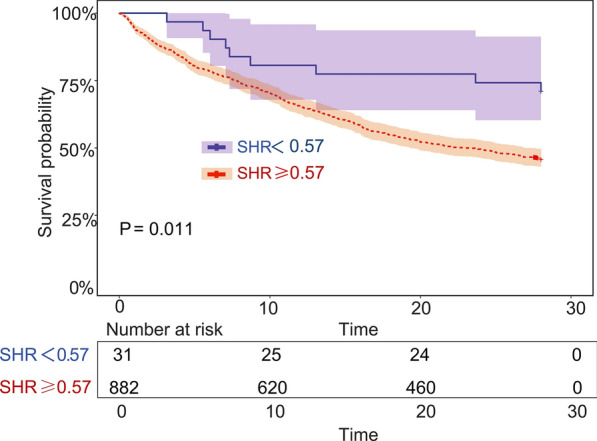
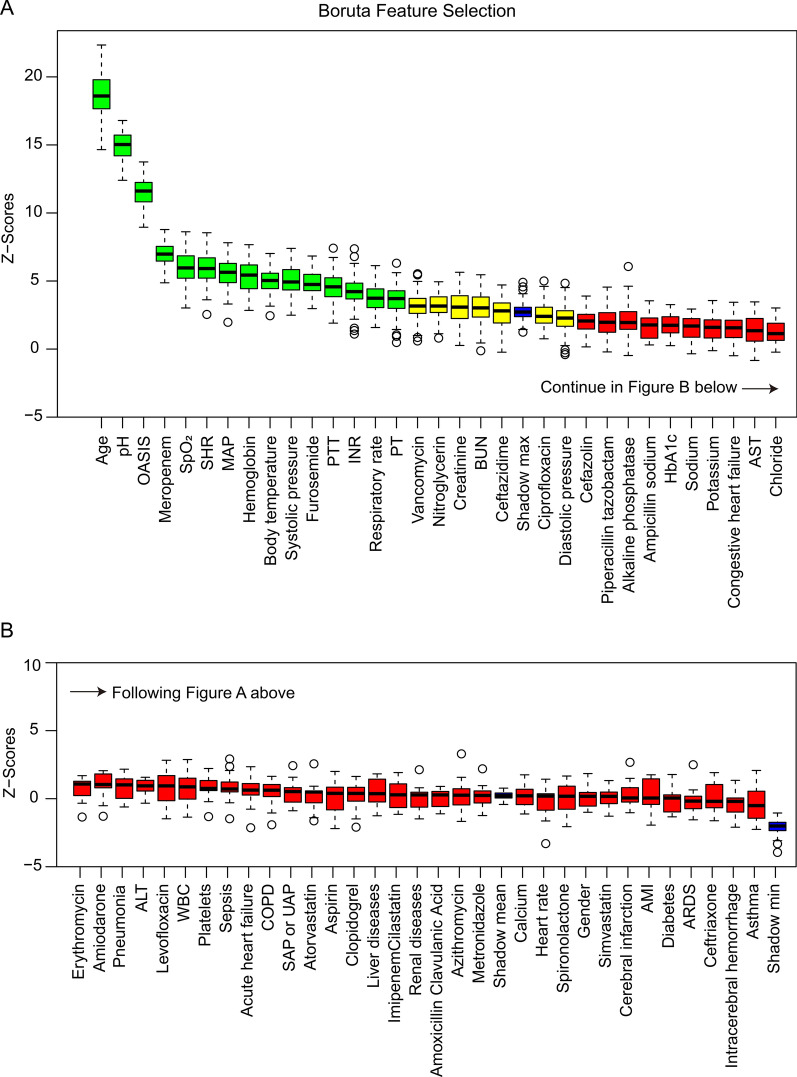
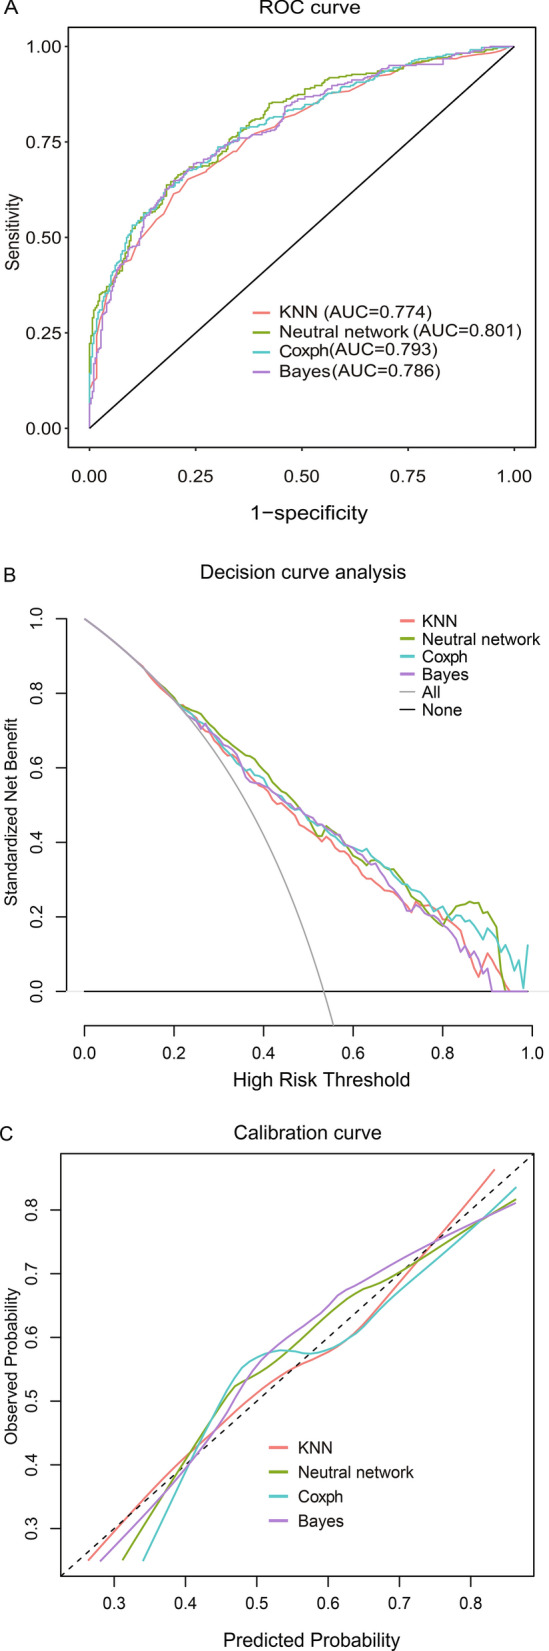
Chronic heart failure (CHF) poses a significant threat to human health. The stress hyperglycemia ratio (SHR) is a novel metric for accurately assessing stress hyperglycemia, which has been correlated with adverse outcomes in various major diseases. However, it remains unclear whether SHR is associated with 28-day mortality in patients with pre-existing CHF who were admitted to intensive care units (ICUs). This study retrospectively recruited patients who were admitted to ICUs with both acute critical illness and pre-existing CHF from the Medical Information Mart for Intensive Care (MIMIC) database. Characteristics were compared between the survival and non-survival groups. The relationship between SHR and 28-day all-cause mortality was analyzed using restricted cubic splines, receiver operating characteristic (ROC) curves, Kaplan-Meier survival analysis, and Cox proportional hazards regression analysis. The importance of the potential risk factors was assessed using the Boruta algorithm. Prediction models were constructed using machine learning algorithms. A total of 913 patients were enrolled. The risk of 28-day mortality increased with higher SHR levels (P < 0.001). SHR was independently associated with 28-day all-cause mortality, with an unadjusted hazard ratio (HR) of 1.45 (P < 0.001) and an adjusted HR of 1.43 (P < 0.001). Subgroup analysis found that none of the potential risk factors, such as demographics, comorbidities, and drugs, affected the relationship (P for interaction > 0.05). The area under the ROC (AUC) curve for SHR was larger than those for admission blood glucose and HbA1c; the cut-off for SHR was 0.57. Patients with SHR higher than the cut-off had a significantly lower 28-day survival probability (P < 0.001). SHR was identified as one of the key factors for 28-day mortality by the Boruta algorithm. The predictive performance was verified through four machine learning algorithms, with the neural network algorithm being the best (AUC 0.801). For patients with both acute critical illness and pre-existing CHF, SHR was an independent predictor of 28-day all-cause mortality. Its prognostic performance surpasses those of HbA1c and blood glucose, and prognostic models based on SHR provide clinicians with an effective tool to make therapeutic decisions.
Keywords: Chronic heart failure; Machine learning; Mortality; Risk factor; Stress hyperglycemia ratio.
© 2025. The Author(s).
Conflict of interest statement
Declarations. Ethics approval: The study was conducted in accordance with the guidelines of the Helsinki Declaration. As the MIMIC-IV database is publicly available, and all data are de-identified to remove patients’ information. The approval was obtained from the Institutional Review Board in advance, and ethical review was not required.
Figures
Similar articles
-
Combined assessment of stress hyperglycemia ratio and glycemic variability to predict all-cause mortality in critically ill patients with atherosclerotic cardiovascular diseases across different glucose metabolic states: an observational cohort study with machine learning.Cardiovasc Diabetol. 2025 May 9;24(1):199. doi: 10.1186/s12933-025-02762-0. Cardiovasc Diabetol. 2025. PMID: 40346649 Free PMC article.
-
Association between the stress hyperglycemia ratio and 28-day all-cause mortality in critically ill patients with sepsis: a retrospective cohort study and predictive model establishment based on machine learning.Cardiovasc Diabetol. 2024 May 9;23(1):163. doi: 10.1186/s12933-024-02265-4. Cardiovasc Diabetol. 2024. PMID: 38725059 Free PMC article.
-
Stress hyperglycemia ratio and machine learning model for prediction of all-cause mortality in patients undergoing cardiac surgery.Cardiovasc Diabetol. 2025 Feb 15;24(1):77. doi: 10.1186/s12933-025-02644-5. Cardiovasc Diabetol. 2025. PMID: 39955587 Free PMC article.
-
The association between the stress hyperglycaemia ratio and mortality in cardiovascular disease: a meta-analysis and systematic review.Cardiovasc Diabetol. 2024 Nov 16;23(1):412. doi: 10.1186/s12933-024-02454-1. Cardiovasc Diabetol. 2024. PMID: 39550575 Free PMC article.
-
Relationship between stress hyperglycaemic ratio (SHR) and critical illness: a systematic review.Cardiovasc Diabetol. 2025 May 2;24(1):188. doi: 10.1186/s12933-025-02751-3. Cardiovasc Diabetol. 2025. PMID: 40317019 Free PMC article.
Cited by
-
Assessment of stress hyperglycemia ratio to predict all-cause mortality in patients with critical cerebrovascular disease: a retrospective cohort study from the MIMIC-IV database.Cardiovasc Diabetol. 2025 Feb 7;24(1):58. doi: 10.1186/s12933-025-02613-y. Cardiovasc Diabetol. 2025. PMID: 39920777 Free PMC article.
-
Association between stress hyperglycemia ratio and contrast-induced nephropathy in ACS patients undergoing PCI: a retrospective cohort study from the MIMIC-IV database.BMC Cardiovasc Disord. 2025 Feb 25;25(1):135. doi: 10.1186/s12872-025-04573-3. BMC Cardiovasc Disord. 2025. PMID: 40000936 Free PMC article.
-
Impact of intensive insulin therapy on dynamic cardiac function in critically ill patients with stress-induced hyperglycemia.World J Diabetes. 2025 Jul 15;16(7):107767. doi: 10.4239/wjd.v16.i7.107767. World J Diabetes. 2025. PMID: 40697606 Free PMC article.
-
The prognostic significance of stress hyperglycemia ratio in evaluating all-cause and cardiovascular mortality risk among individuals across stages 0-3 of cardiovascular-kidney-metabolic syndrome: evidence from two cohort studies.Cardiovasc Diabetol. 2025 Mar 24;24(1):137. doi: 10.1186/s12933-025-02689-6. Cardiovasc Diabetol. 2025. PMID: 40128747 Free PMC article.
-
Development and validation of a machine learning model for in-hospital mortality prediction in children under 5 years with heart failure.Front Pediatr. 2025 May 26;13:1608334. doi: 10.3389/fped.2025.1608334. eCollection 2025. Front Pediatr. 2025. PMID: 40492263 Free PMC article.
References
-
- Force M, McDonagh TA, Metra M, Adamo M, Gardner RS, Baumbach A, Bohm M, Burri H, Butler J, Celutkiene J, et al. 2021 ESC Guidelines for the diagnosis and treatment of acute and chronic heart failure: developed by the task force for the diagnosis and treatment of acute and chronic heart failure of the European society of cardiology (ESC). With the special contribution of the Heart Failure Association (HFA) of the ESC. Eur J Heart Fail. 2022;24(1):4–131. - PubMed
-
- Savarese G, Becher PM, Lund LH, Seferovic P, Rosano GMC, Coats AJS. Global burden of heart failure: a comprehensive and updated review of epidemiology. Cardiovasc Res. 2023;118(17):3272–87. - PubMed
-
- Martin SS, Aday AW, Almarzooq ZI, Anderson CAM, Arora P, Avery CL, Baker-Smith CM, Barone Gibbs B, Beaton AZ, Boehme AK, et al. 2024 heart disease and stroke statistics: a report of US and global data from the American heart association. Circulation. 2024;149(8):e347–913. - PubMed
-
- Khan MS, Shahid I, Bennis A, Rakisheva A, Metra M, Butler J. Global epidemiology of heart failure. Nat Rev Cardiol. 2024;21(10):717–34. - PubMed
-
- Lawson CA, Solis-Trapala I, Dahlstrom U, Mamas M, Jaarsma T, Kadam UT, Stromberg A. Comorbidity health pathways in heart failure patients: a sequences-of-regressions analysis using cross-sectional data from 10,575 patients in the swedish heart failure registry. PLoS Med. 2018;15(3): e1002540. - PMC - PubMed
Publication types
MeSH terms
Substances
Grants and funding
LinkOut - more resources
Full Text Sources
Medical
