. 2025 Jan 8;5(1):6.
doi: 10.1186/s43897-024-00120-4.

Population sequencing of cherry accessions unravels the evolution of Cerasus species and the selection of genetic characteristics in edible cherries

Affiliations

Population sequencing of cherry accessions unravels the evolution of Cerasus species and the selection of genetic characteristics in edible cherries

Yahui Lei et al. Mol Hortic. .

Erratum in

Abstract

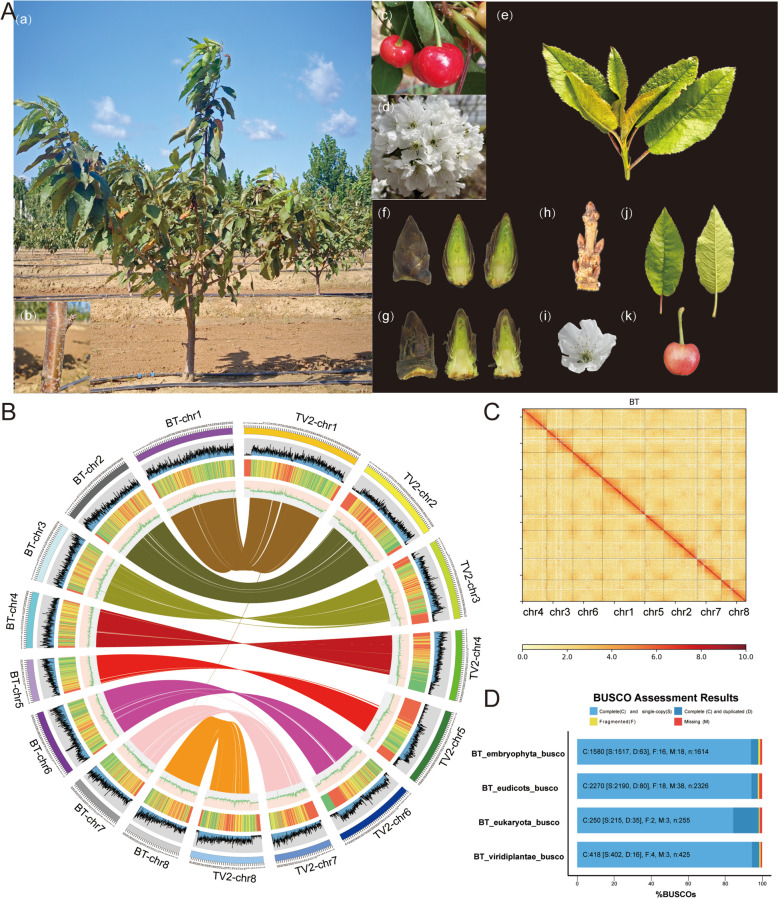
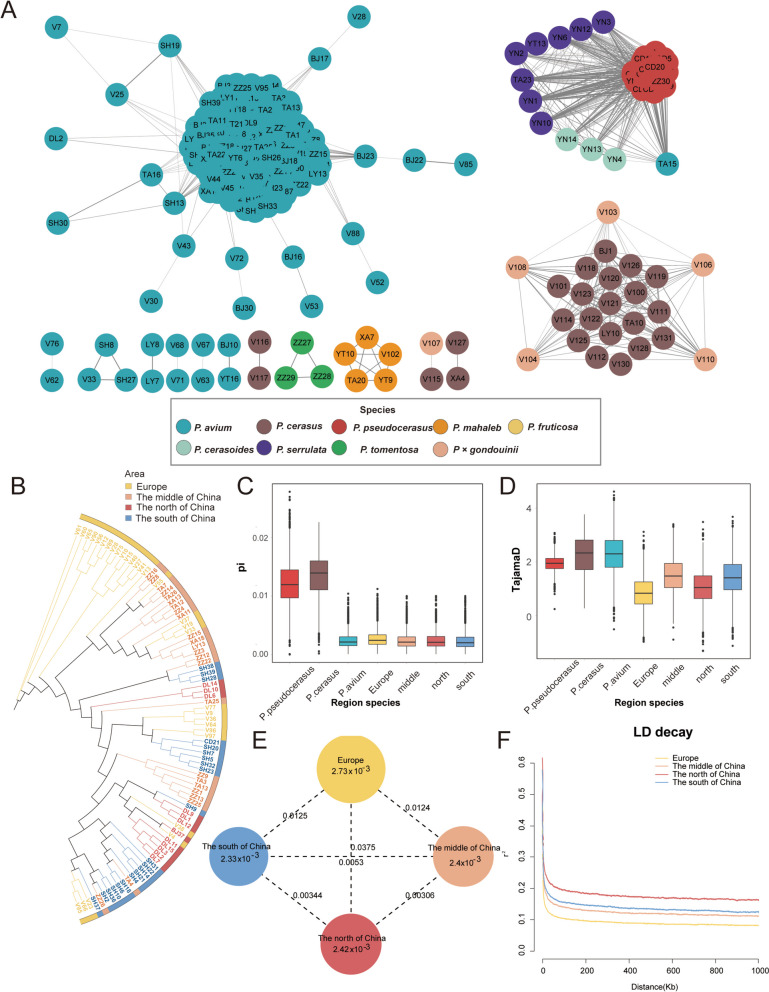
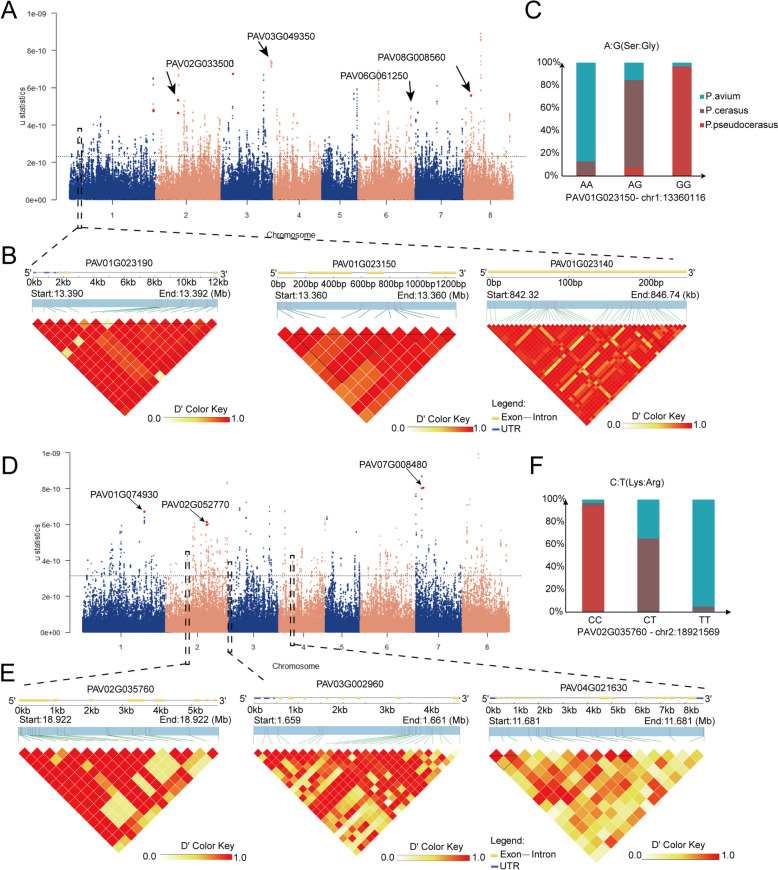
Cerasus is a subgenus of Prunus in the family Rosaceae that is popular owing to its ornamental, edible, and medicinal properties. Understanding the evolution of the Cerasus subgenus and identifying selective trait loci in edible cherries are crucial for the improvement of cherry cultivars to meet producer and consumer demands. In this study, we performed a de novo assembly of a chromosome-scale genome for the sweet cherry (Prunus avium L.) cultivar 'Burlat', covering 297.55 Mb and consisting of eight chromosomes with 33,756 protein-coding genes. The resequencing and population structural analysis of 384 Cerasus representative accessions revealed that they could be divided into four groups (Group 1, Group 2, Group 3, and Group 4). We inferred that Group 1 was the oldest population and Groups 2, 3, and 4 were clades derived from it. In addition, we found selective sweeps for fruit flavor and improved stress resistance in different varieties of edible cherries (P. avium, P. cerasus, and P. pseudocerasus). Transcriptome analysis revealed significant differential expression of genes associated with key pathways, such as sucrose starch and sucrose metabolism, fructose and mannose metabolism, and the pentose phosphate pathway, between the leaves and fruits of P. avium. This study enhances the understanding of the evolutionary processes of the Cerasus subgenus and provides resources for functional genomics research and the improvement of edible cherries.

Keywords: Cerasus subgenus; Edible cherries; Genetic diversity; Population structure; Selection signatures.


Conflict of interest statement

Declarations. Ethics approval and consent to participate: Not applicable. Consent for publication: All authors approve the manuscript and consent to the publication of the work. Competing interests: The authors declare no competing interests. Caixi Zhang is a member of the Editorial Board for Molecular Horticulture. He was not involved in the journal’s review of, and decisions related to, this manuscript.

Figures

Fig. 1
Fig. 1
Characteristics of the P. avium cv. ‘Burlat’ genome. A Phenotypic characteristics of P. avium cv. ‘Burlat' trunks, flowers, leaf buds, flower buds, leaves, berries collected between February and May of 2022 and 2023. B Landscape of the P. avium genome assembly. The circles (outer to inner) represent chromosome ideogram (chr1 to chr 8), gene density, repetitive sequences density, GC content, and duplicated gene links between ‘Burlat’ and ‘Tieton v2’ genomes. Chromosomes are shown in a 50 kb window. C Hi-C contact map revealing extensive hierarchical chromatin interactions in the genome of P. avium. D Benchmarking Universal Single-Copy Orthologs (BUSCO) assessment of the completeness of the P. avium genome
Fig. 2
Fig. 2
Population structure and geographic distribution of the 384 accessions of Cerasus subgenus germplasm. A Geographic locations and fruit phenotypes of representative varieties from 384 Cerasus accessions. The size of each pie chart represents the sample size. The fruit images of P. cerasoides, P. fruticosa, and P. × gondouinii were sourced from external references. P. cerasoides fruit image adapted from Gao Xinxin, sourced from https://ppbc.iplant.cn/tu/2594155; P. fruticosa fruit image adapted from Gao Xiaohui, sourced from https://ppbc.iplant.cn/tu/653724; P. × gondouinii fruit image adapted from the article "Analysis of agromorphological between duke cherry (P. × gondouinii (Poit. & Turpin) Rehd.) and its progenitors: sweet cherry (Prunus avium L.) and sour cherry (Prunus cerasus L.)". B Maximum likelihood phylogenetic tree for 384 accessions based on SNPs. Four P. persica accessions were used as the outgroup species. C Model-based clustering analysis with different cluster numbers (k = 2–6). The y-axis quantifies cluster membership, and the x-axis lists the different accessions. The orders and positions of these accessions on the x-axis are consistent with those presented in the tree. D Principal component analysis of the first two components of the 384 accessions. E Histogram of species distribution of the accessions in each group
Fig. 3
Fig. 3
Demographic history of Cerasus subgenus species. A Demographic history of diploid Cerasus species (P. avium, P. mahaleb, P. serrulata, and P. tomentosa) germplasm inferred from the estimation of the historical effective population size (Ne) using the pairwise sequentially Markovian coalescent method. B Genetic differentiation (FST) within nine Cerasus subgenus species. C–D Population splits and migrations among Cerasus species. Colored lines represent gene flows, and arrows indicate the direction of the gene flow
Fig. 4
Fig. 4
Genetic diversity and differentiation across Cerasus and P. avium accessions from different geographic regions. A Degree relationship network of 384 Cerasus accessions. The shades of line color are proportional to the calculated identity-by-descent (IBD) values. B Phylogenetic tree of 87 P. avium accessions from different geographic regions after IBD filtering. C Nucleotide diversity (π) estimation from different geographic regions. D Tajima’s D estimation from different geographic regions. E Nucleotide diversity (π) and genetic differentiation (FST) within different geographic regions calculated using the sliding window approach (100 kb windows with 100 kb steps). The circle size represents the mean value of π in each region. The numbers marked between each regions indicate the mean value of FST. F Linkage disequilibrium decay among different regions
Fig. 5
Fig. 5
Identification of selection signatures and gene associations in edible cherries using RAiSD and linkage disequilibrium analysis. A μ statistics calculated by RAiSD across the genome in P. cerasus. The dashed lines mark the regions at the top 0.5%. The four non-synonymous mutated genes (PAV02G033500, PAV03G049350, PAV06G061250, and PAV08G008560) with the highest scores are labelled by arrows. B The gene structure (top) and linkage disequilibrium heat map (bottom) for genes associated with fructose metabolic process. The upper part: yellow rectangles and lines indicate exons and introns, respectively. C The bar plots for the candidate gene PAV01G023150, based on genotype. D μ statistics calculated by RAiSD across the genome in P. pseudocerasus. The three non-synonymous mutated genes (PAV01G074930, PAV02G052770, and PAV07G008480) with the highest scores are labelled by arrows. E The gene structure (top) and linkage disequilibrium heat map (bottom) for genes associated with regulation of innate immune response. F The bar plots for the candidate gene PAV02G035760, based on genotype
Fig. 6
Fig. 6
Differential gene expression and metabolic pathway changes between leaves and fruits in P. avium. A Differentially expressed genes. Two vertical lines indicate gene expression fold change (leaf vs fruit) > 2 and < 0.5 and the horizontal line indicates the adjusted P value of 0.05. Genes with significant differential expression (FC_P) are indicated by red dots (up-regulated and down-regulated); genes with no significant differential expression (NS) are represented by black dots; genes with differential expression and p-value > 0.05 (FC) are indicated by blue dots (up-regulated and down-regulated). B Heatmaps of edible cherry selective candidate differentially expressed genes. Among them, R_leaf, L_leaf, B_leaf and L_fruit, R_fruit, B_fruit refer to gene expression levels for leaves and fruits from three distinct P. avium cultivars (‘Bing’, ‘Lapins’ and ‘Rainier’). CE DEGs involved in main sugar metabolic pathways in P. avium (leaf vs fruit). C Starch and sucrose metabolism. D Fructose and mannose metabolism. E Pentose phosphate pathway. Enzymes regulated by key DEGs are highlighted in yellow; Enzymes regulated by genes without significant differential expression are highlighted in blue

References

    1. Akdemir KC, Chin L. HiCPlotter integrates genomic data with interaction matrices. Genome Biol. 2015;16:1–8. - PMC - PubMed
    1. Alachiotis N, Pavlidis P. RAiSD detects positive selection based on multiple signatures of a selective sweep and SNP vectors. Commun Biol. 2018;1(1):1–11. - PMC - PubMed
    1. Alexander DH, Novembre J, Lange K. Fast model-based estimation of ancestry in unrelated individuals. Genome Res. 2009;19(9):1655–64. - PMC - PubMed
    1. Altschul SF, Gish W, Miller W, Myers EW, Lipman DJ. Basic local alignment search tool. J Mol Biol. 1990;215(3):403–10. - PubMed
    1. Baek S, Choi K, Kim GB, Yu HJ, Cho A, Jang H, et al. Draft genome sequence of wild Prunus yedoensis reveals massive inter-specific hybridization between sympatric flowering cherries. Genome Biol. 2018;19(1):1–17. - PMC - PubMed

LinkOut - more resources