. 2025 Jan 8;21(1):2.
doi: 10.1186/s12993-024-00265-8.

Fecal microbiota transplantation attenuates Alzheimer's disease symptoms in APP/PS1 transgenic mice via inhibition of the TLR4-MyD88-NF-κB signaling pathway-mediated inflammation

Affiliations

Fecal microbiota transplantation attenuates Alzheimer's disease symptoms in APP/PS1 transgenic mice via inhibition of the TLR4-MyD88-NF-κB signaling pathway-mediated inflammation

Xiang Li et al. Behav Brain Funct. .

Abstract

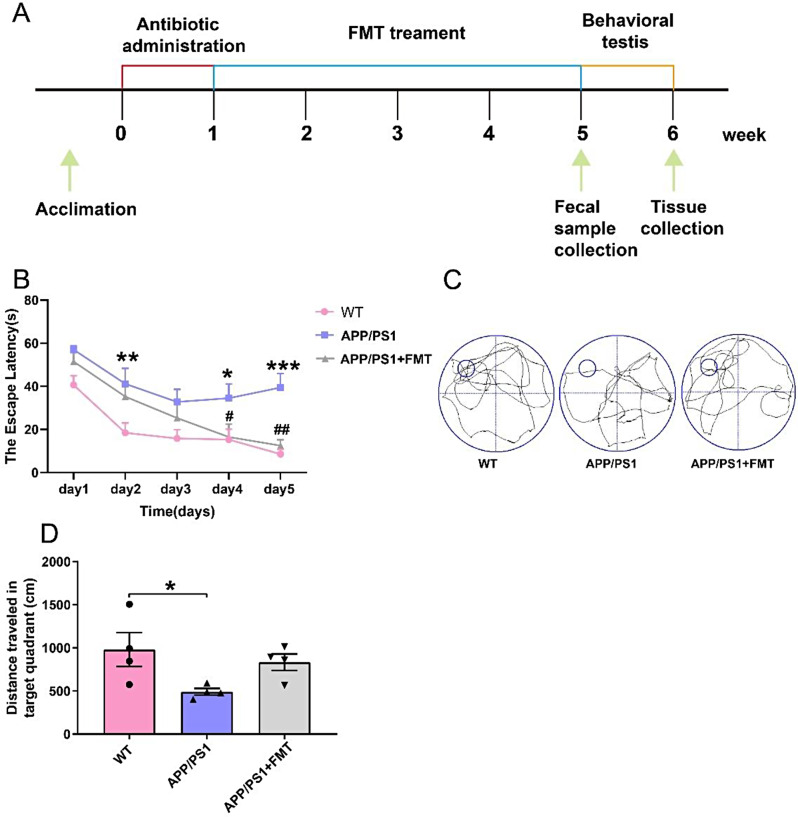
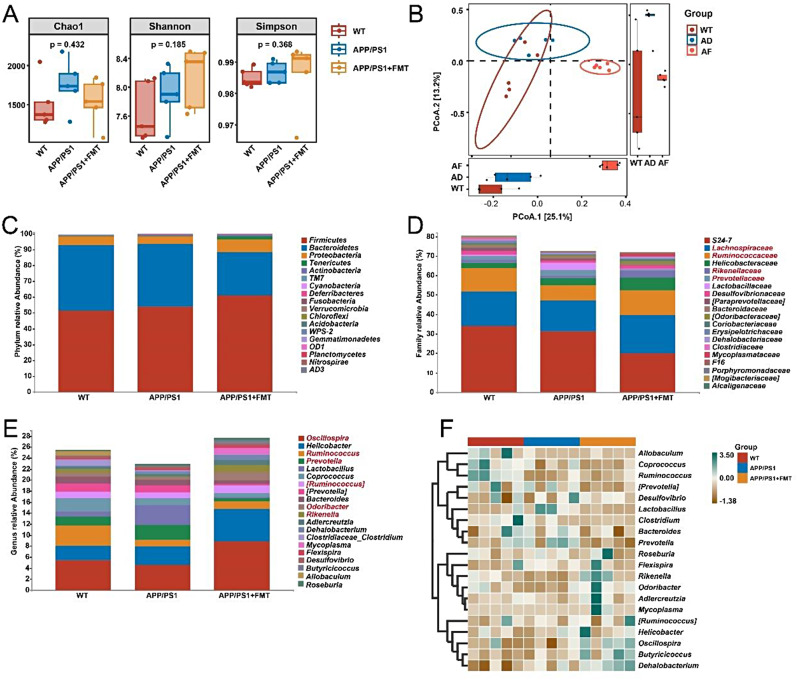
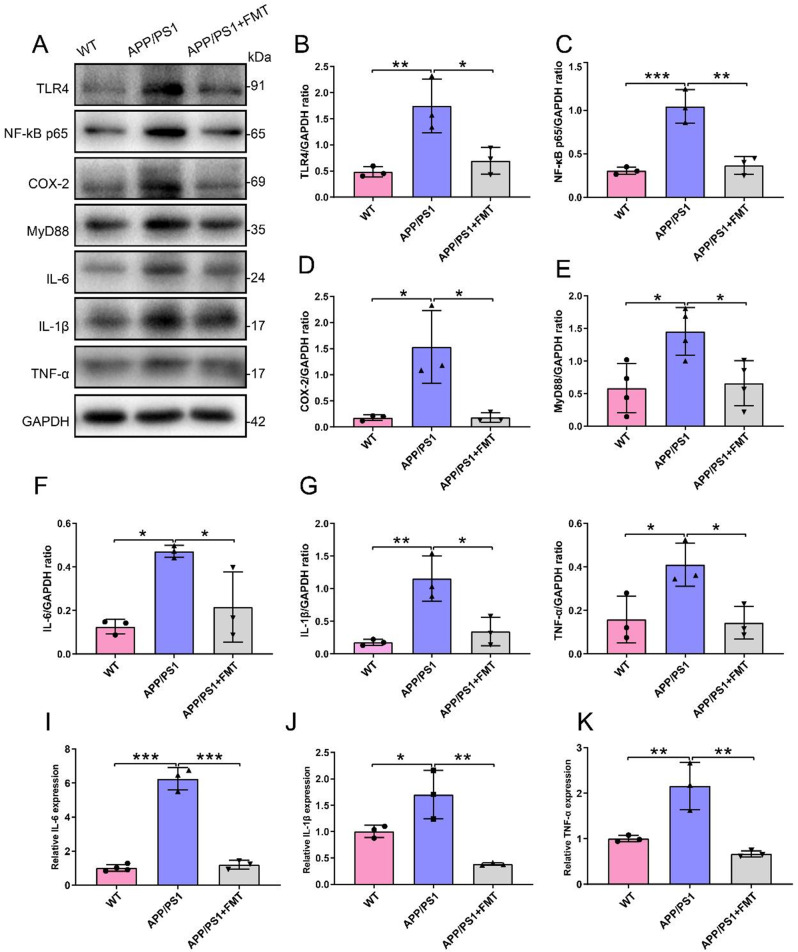
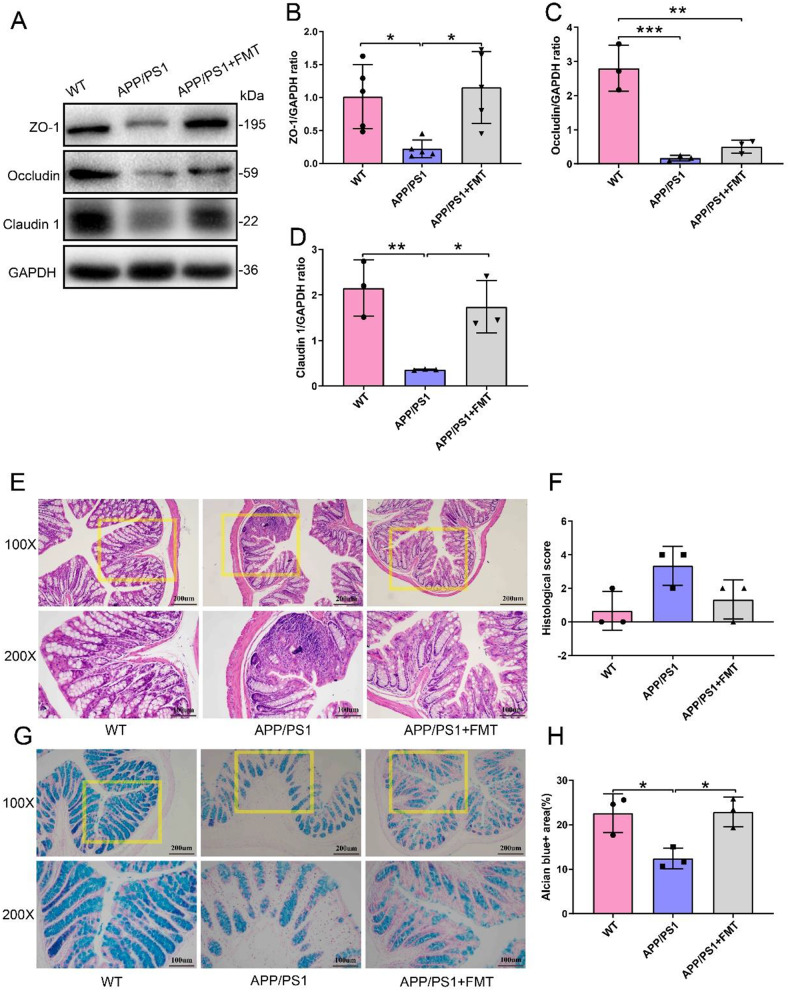
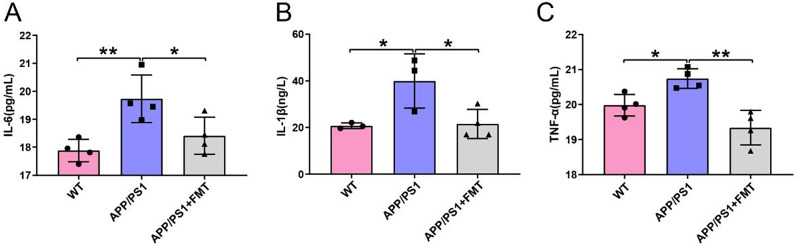
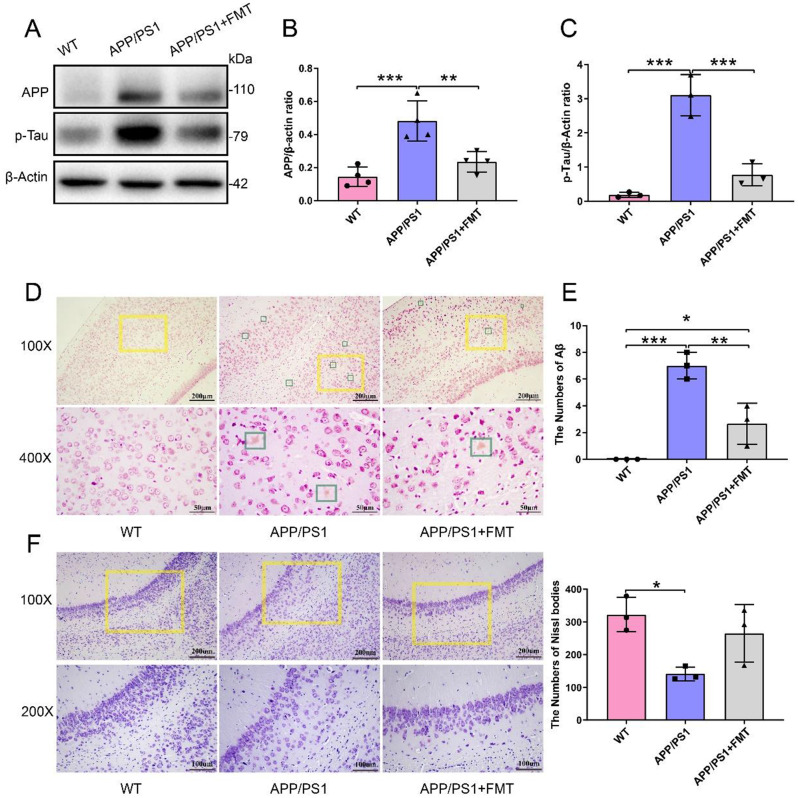
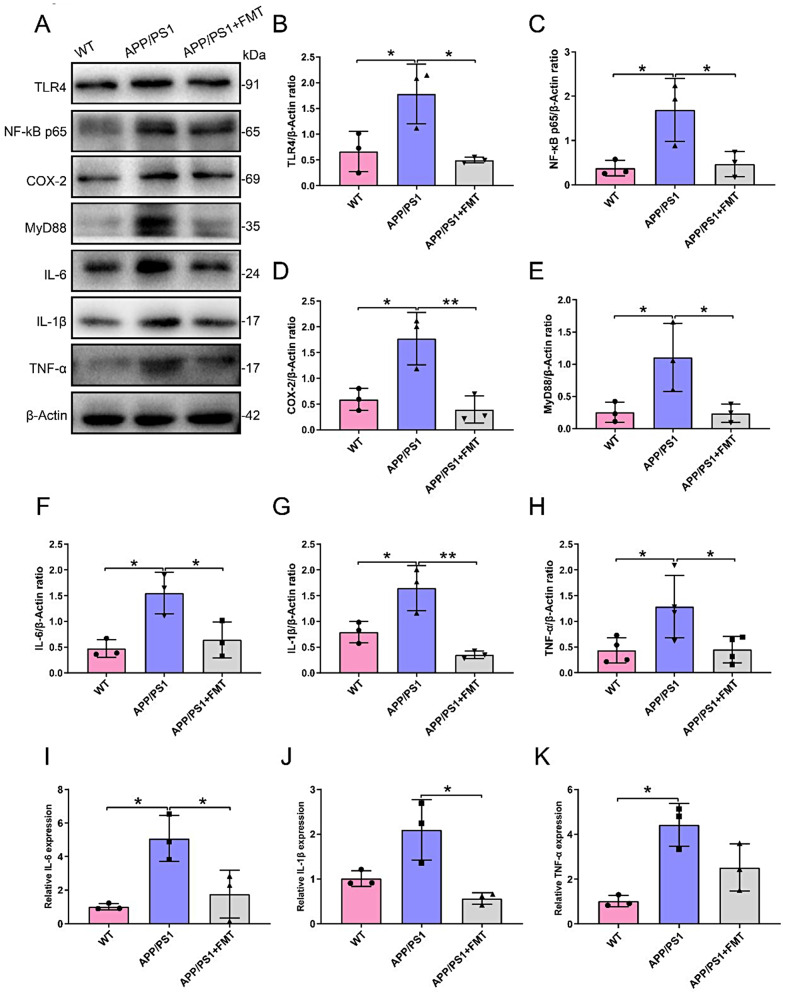
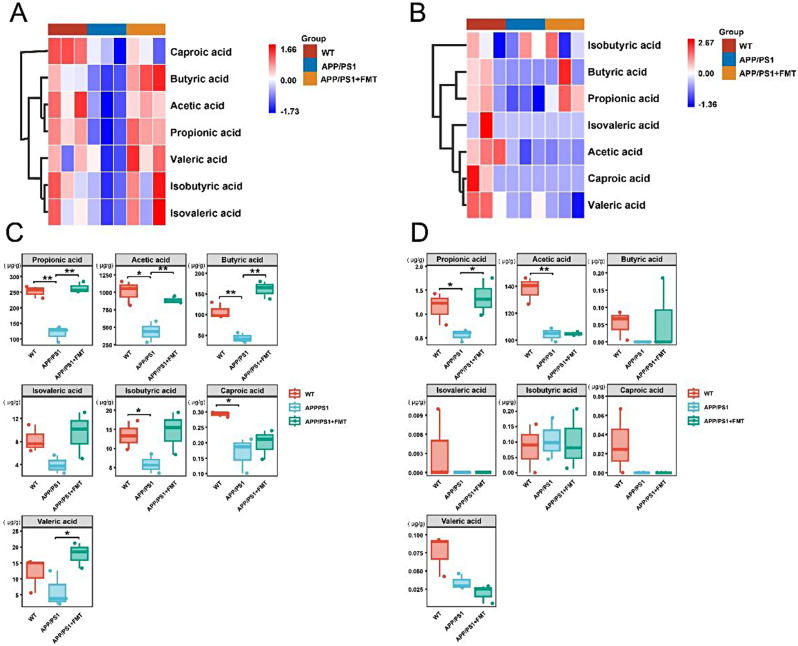
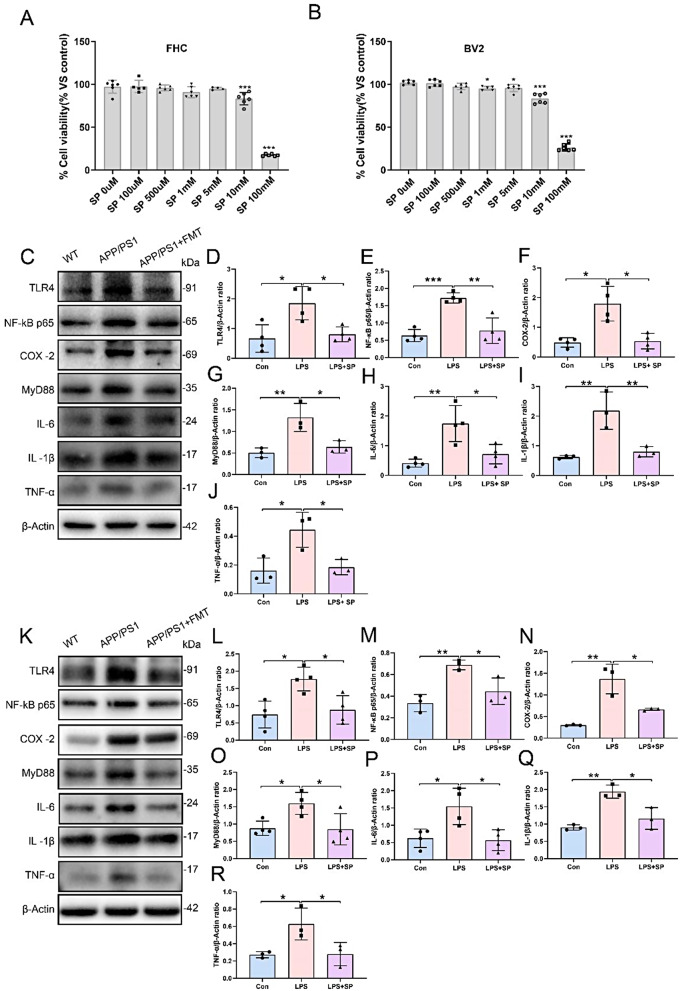
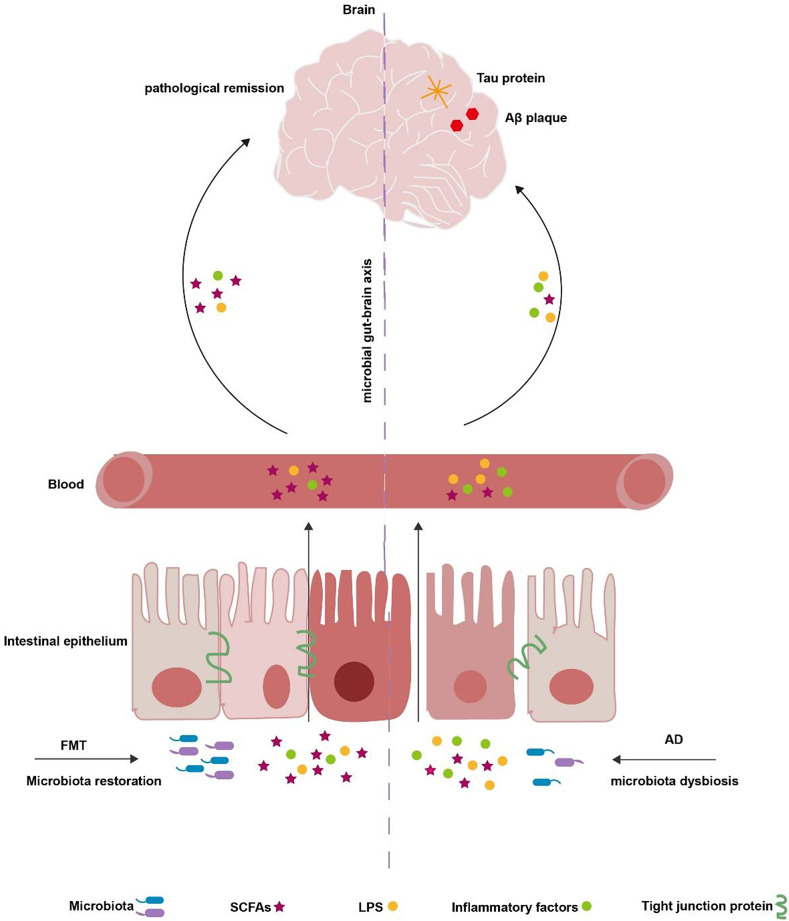
Alzheimer's disease (AD) is a prevalent and progressive neurodegenerative disorder that is the leading cause of dementia. The underlying mechanisms of AD have not yet been completely explored. Neuroinflammation, an inflammatory response mediated by certain mediators, has been exhibited to play a crucial role in the pathogenesis of AD. Additionally, disruption of the gut microbiota has been found to be associated with AD, and fecal microbiota transplantation (FMT) has emerged as a potential therapeutic approach. However, the precise mechanism of FMT in the treatment of AD remains elusive. In this study, FMT was performed by transplanting fecal microbiota from healthy wild-type mice into APP/PS1 mice (APPswe, PSEN1dE9) to assess the effectiveness of FMT in mitigating AD-associated inflammation and to reveal its precise mechanism of action. The results demonstrated that FMT treatment improved cognitive function and reduced the expression levels of inflammatory factors by regulating the TLR4/MyD88/NF-κB signaling pathway in mice, which was accompanied by the restoration of gut microbial dysbiosis. These findings suggest that FMT has the potential to ameliorate AD symptoms and delay the disease progression in APP/PS1 mice.

Keywords: Alzheimer’s disease; Fecal microbiota transplantation; Inflammation; Intestinal microbiota; Microbiota-gut-brain axis; Short-chain fatty acids.


Conflict of interest statement

Declarations. Ethical approval and consent to participate: All animal protocols were approved by the Experimental Animal Ethics Committee of Wenzhou Medical University (Approval No. wydy2022-0375). Competing interests: The authors declare no competing interests.

Figures

Fig. 1
Fig. 1
Cognitive and behavioral changes in APP/PS1 mice treated with FMT. (A) Experimental protocol for FMT treatment. (B) Escape latency of mice during the training period of the MWM test (n = 6 for each group). (C) Representative swimming routes in the platform-free exploration period of the MWM test. (D) Distance traveled through the target quadrant in the MWM test (F = 3.893; P = 0.0605; df = 11) (n = 4 for each group). Data were analyzed using one-way ANOVA, followed by Dunnett’s multiple comparisons test (D) and repeated measures ANOVA, followed by Tukey’s multiple comparisons test (B). Data were expressed as mean ± SEM. *P < 0.05, **P < 0.01, ***P < 0.001 vs. WT group; #P < 0.05, ##P < 0.01 vs. APP/PS1 group
Fig. 2
Fig. 2
Effects of FMT treatment on the dysregulation of intestinal microbiota in APP/PS1 mice. (A) Chao1(P = 0.432), Shannon (P = 0.185) and Simpson (P = 0.368) index analysis of alpha diversity of the gut microbiota (n = 5 for each group). (B) PCoA distribution plot of the Bray-Curtis algorithm for beta diversity (n = 5 for each group). (C-E) Relative abundance of intestinal flora at the phylum level, family level and genus level in different groups (n = 5 for each group)( The parts marked in red are specifically mentioned). (F) Heat map of species composition at the genus level (n = 5 for each group)
Fig. 3
Fig. 3
Effects of FMT treatment on colonic inflammatory signaling pathways in APP/PS1 mice. (A) Representative images of TLR4, NF-κB, COX-2, MyD88, IL-6, IL-1β and TNF-α in the colon in Western blot. (B-H) Quantitative analysis results of TLR4 (F = 12.10; P = 0.0078; df = 8) (n = 3 for each group), NF-κB p65 (F = 30.76; P = 0.0007; df = 8) (n = 3 for each group), COX-2(F = 11.18; P = 0.0095; df = 8) (n = 3 for each group), MyD88 (F = 7.075; P = 0.0142; df = 11) (n = 4 for each group), IL-6 (F = 10.41; P = 0.0112; df = 8) (n = 3 for each group), IL-1β (F = 14.56; P=0.0050; df = 8) (n = 3 for each group) and TNF-α (F = 7.440; P = 0.0237; df = 8) (n = 3 for each group) in colon tissue. (I-K) Expression of mRNA for IL-6 (F = 179.8; P < 0.0001; df = 9) (WT, n = 4; APP/PS1, n = 3; APP/PS1 + FMT, n = 3), IL-1β (F = 17.24; P = 0.0033; df = 8) (n = 3 for each group), and TNF-α (F = 19.69; P = 0.0023; df = 8) (n = 3 for each group) in the colon. All data were analyzed by one-way ANOVA, followed by Tukey’s multiple comparisons test. Data are expressed as mean ± SD. *P < 0.05; **P < 0.01; ***P < 0.001
Fig. 4
Fig. 4
Effects of FMT treatment on intestinal barrier in APP/PS1 mice. (A) Representative images of colonic ZO-1, Occludin and Claudin-1 in the colon from Western blot analysis. (B-D) Quantitative analysis of ZO-1 (F = 6.870; P = 0.0103; df = 14) (n = 5 for each group), Occludin (F = 36.82; P = 0.0004; df = 8) (n = 3 for each group) and Claudin-1 (F = 11.14; P = 0.0095; df = 8) (n = 3 for each group) in colon tissue from Western blotting results. (E, F) Representative images and histological scores of colonic H&E staining. (G, H) Representative images of colonic Alcian blue staining and quantitative analysis of the density with positive areas (F = 9.146; P = 0.0151; df = 8) (n = 3 for each group). All data were analyzed by one-way ANOVA followed by Tukey’s multiple comparisons test. Data are expressed as mean ± SD. *P < 0.05; **P < 0.01; ***P < 0.00
Fig. 5
Fig. 5
Alterations of inflammatory cytokine levels in the plasma from APP/PS1 mice after FMT treatment. (A) The level of IL-6 (F = 8.257; P = 0.0092; df = 11) (n = 4 for each group) in plasma by ELISA kit. (B) The level of IL-1β (F = 6.622; P = 0.0234; df = 9) (WT, n = 3; APP/PS1, n = 3; APP/PS1 + FMT, n = 4) in plasma by ELISA kit. (C) The level of TNF-α (F = 14.20; P = 0.0016; df = 11) (n = 4 for each group) in plasma by ELISA kit. All data were analyzed by one-way ANOVA, followed by Tukey’s multiple comparisons test. Data were expressed as mean ± SD. *P < 0.05; **P < 0.01
Fig. 6
Fig. 6
Influence of FMT treatment on brain pathological changes in APP/PS1 mice. (A) Representative images of APP, p-Tau proteins in the hippocampus by Western blot analysis. (B-C) Quantification of APP (F = 16.83; P = 0.0009; df = 11) (n = 4 for each group), p-Tau (F = 45.08; P = 0.0002; df = 8) (n = 3 for each group) proteins in hippocampus according to Western blot results. (D, E) Representative images of cortex Congo red staining and the number of Aβ (F = 33.70; P = 0.0005; df = 8) (n = 3 for each group). (F, G) Typical images of hippocampal Nissl staining and the number of Nissl bodies (F = 7.095; P = 0.0262; df = 8) (n = 3 for each group). All data were analyzed by one-way ANOVA, followed by Tukey’s multiple comparisons test. Data were expressed as mean ± SD. *P < 0.05; **P < 0.01; ***P < 0.001
Fig. 7
Fig. 7
Influence of FMT treatment on inflammation-related signaling pathways in the brain of APP/PS1 mice. (A) Representative images of hippocampal TLR4, NF-κB, COX-2, MyD88, IL-6, IL-1β and TNF-α in Western blot experiments. (B-H) Quantification of TLR4 (F = 9.016; P = 0.0156; df = 8) (n = 3 for each group), NF-κB p65(F = 7.862; P = 0.0211; df = 8) (n = 3 for each group), COX-2 (F = 13.44; P = 0.0061; df = 8) (n = 3 for each group), MyD88 (F = 6.879; P = 0.0280; df = 8) (n = 3 for each group), IL-6(F = 9.593; P = 0.0135; df = 8) (n = 3 for each group), IL-1β (F = 16.40; P = 0.0037; df = 8) (n = 3 for each group) and TNF-α (F = 8.155; P = 0.0195; df = 8) (n = 3 for each group) proteins in hippocampus according to Western blot results. (I-K) Expression of mRNA for IL-6 (F = 10.78; P = 0.0103; df = 8) (n = 3 for each group), IL-1β (F = 10.98; P = 0.0099; df = 8) (n = 3 for each group) and TNF-α (F = 12.53; P = 0.0072; df = 8) (n = 3 for each group) in the hippocampus. Data were analyzed using one-way ANOVA, followed by Tukey’s multiple comparisons test (B-I, K) and Kruskal-Wallis test, followed by Dunn’s multiple comparisons test (J). Data were expressed as mean ± SD. *P < 0.05; **P < 0.01
Fig. 8
Fig. 8
Impact of FMT treatment on short-chain fatty acid levels in the colon and brain of APP/PS1 mice. (A) Heat map of SCFAs in colon contents (n = 4 for each group). (B) Heat map of SCFAs in the brain (n = 3 for each group). (C) Statistical chart of SCFAs in colon contents (Propionic acid: WT vs. APP/PS1, P = 0.0020, t = 7.204, df = 4; APP/PS1 vs. APP/PS1 + FMT, P = 0.0013, t = 8.039, df = 4; Acetic acid: WT vs. APP/PS1, P = 0.0129, t = 4.271, df = 4; APP/PS1 vs. APP/PS1 + FMT, P = 0.0081, t = 4.897, df = 4; Butyric acid: WT vs. APP/PS1, P = 0.0082, t = 4.873, df = 4; APP/PS1 vs. APP/PS1 + FMT, P = 0.0012, t = 8.267, df = 4; Isobutyric acid: WT vs. APP/PS1, P = 0.0448, t = 2.884, df = 4; Caproic acid: WT vs. APP/PS1, P = 0.0201, t = 3.743, df = 4; Valeric acid: APP/PS1 vs. APP/PS1 + FMT, P = 0.0440, t = 2.902, df = 4) (n = 4 for each group). (D) Statistical chart of SCFAs in the brain (Propionic acid: WT vs. APP/PS1, P = 0.0485, t = 2.806, df = 4; APP/PS1 vs. APP/PS1 + FMT, P = 0.0294, t = 3.318, df = 4; Acetic acid: WT vs. APP/PS1, P = 0.0068, t = 5.149, df = 4) (n = 3 for each group). Data were analyzed using the two-tailed unpaired t-test (B, D). *P < 0.05; **P < 0.01
Fig. 9
Fig. 9
Effects of sodium propionate treatment on FHC cells and microglia. (A) FHC cell (n = 6 for each group) viability analysis by CCK8 assay (F = 155.5; P < 0.0001; df = 38). (B) BV2 microglia (n = 6 for each group) viability analysis by CCK8 assay (F = 281.7; P < 0.0001; df = 40). (C) Representative images of FHC cell TLR4, NF-κB p65, COX-2, MyD88, IL-6, IL-1β and TNF-α in Western blot experiments. (D-J) Quantitative analysis results of TLR4 (F = 8.576; P = 0.0082; df = 11) (n = 4 for each group), NF-κB (F = 22.28; P = 0.0003; df = 11) (n = 4 for each group), COX-2(F = 15.29; P = 0.0089) (n = 4 for each group), MyD88 (F = 12.53; P = 0.0072; df = 8) (n = 3 for each group), IL-6(F = 11.75; P = 0.0031; df = 11) (n = 4 for each group), IL-1β (F = 15.30; P = 0.0044; df = 8) (n = 3 for each group) and TNF-α (F = 8.792; P = 0.0165; df = 8) (n = 3 for each group) on FHC cells. (K) Representative images of BV2 microglia TLR4, NF-κB p65, COX-2, MyD88, IL-6, IL-1β and TNF-α in Western blot experiments. (L-R) Quantitative analysis results of TLR4 (F = 8.567; P = 0.0083; df = 11) (n = 4 for each group), NF-κB(F = 12.66; P = 0.0070; df = 8) (n = 3 for each group), COX-2 (F = 22.59; P = 0.0016; df = 8) (n = 3 for each group), MyD88 (F = 6.217; P = 0.0201; df = 11) (n = 4 for each group), IL-6(F = 8.227; P = 0.0093; df = 11) (n = 4 for each group), IL-1β (F = 18.60; P = 0.0027; df = 8) (n = 3 for each group) and TNF-α (F = 6.929; P = 0.0276; df = 8) (n = 3 for each group) on BV2 microglia. Data were analyzed using one-way ANOVA, followed by Tukey’s multiple comparisons test (D-E; G-J; L-R); one-way ANOVA, followed by Brown-Forsythe and Welch ANOVA test (F); one -way ANOVA, followed by Dunnett’s multiple comparisons test (A, B). Data were expressed as mean ± SD. *P < 0.05; **P < 0.01; ***P < 0.001
Fig. 10
Fig. 10
The pattern of FMT’s protective effects on APP/PS1 mice through the microbial-gut-brain axis. In simple terms, FMT treatment works to normalize the imbalances in gut microbiota and short-chain fatty acids (SCFAs), while also slowing down the advancement of pro-inflammatory factors (IL-6, IL-1β, and TNF-α) from the gut to the circulatory system. The reduced levels of these pro-inflammatory factors entering the brain via the gut-brain axis help suppress neuroinflammation, ultimately leading to a delay in the progression of the disease

Similar articles

Cited by

References

    1. Tiwari S, Atluri V, Kaushik A, Yndart A, Nair M. Alzheimer’s disease: pathogenesis, diagnostics, and therapeutics. Int J Nanomed. 2019;14:5541–54. - PMC - PubMed
    1. McKhann GM, Knopman DS, Chertkow H, Hyman BT, Jack CR Jr., Kawas CH, et al. The diagnosis of dementia due to Alzheimer’s disease: recommendations from the National Institute on Aging-Alzheimer’s Association workgroups on diagnostic guidelines for Alzheimer’s disease. Alzheimers Dement. 2011;7:263–9. - PMC - PubMed
    1. Singh N, Das B, Zhou J, Hu X, Yan R. Targeted BACE-1 inhibition in microglia enhances amyloid clearance and improved cognitive performance. Sci Adv. 2022;8:eabo3610. - PMC - PubMed
    1. Hampel H, Mesulam MM, Cuello AC, Farlow MR, Giacobini E, Grossberg GT, et al. The cholinergic system in the pathophysiology and treatment of Alzheimer’s disease. Brain. 2018;141:1917–33. - PMC - PubMed
    1. Al-Ghraiybah NF, Wang J, Alkhalifa AE, Roberts AB, Raj R, Yang E et al. (2022).Glial Cell-Mediated Neuroinflammation in Alzheimer’s Disease. Int J Mol Sci, 23. - PMC - PubMed

LinkOut - more resources