. 2025 Jul;35(4):e13330.
doi: 10.1111/bpa.13330. Epub 2025 Jan 8.

Fetal growth restriction adversely impacts trajectory of hippocampal neurodevelopment and function

Affiliations

Fetal growth restriction adversely impacts trajectory of hippocampal neurodevelopment and function

Ingrid Dudink et al. Brain Pathol. 2025 Jul.

Abstract

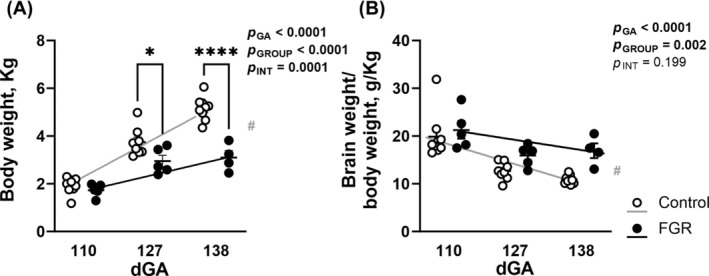
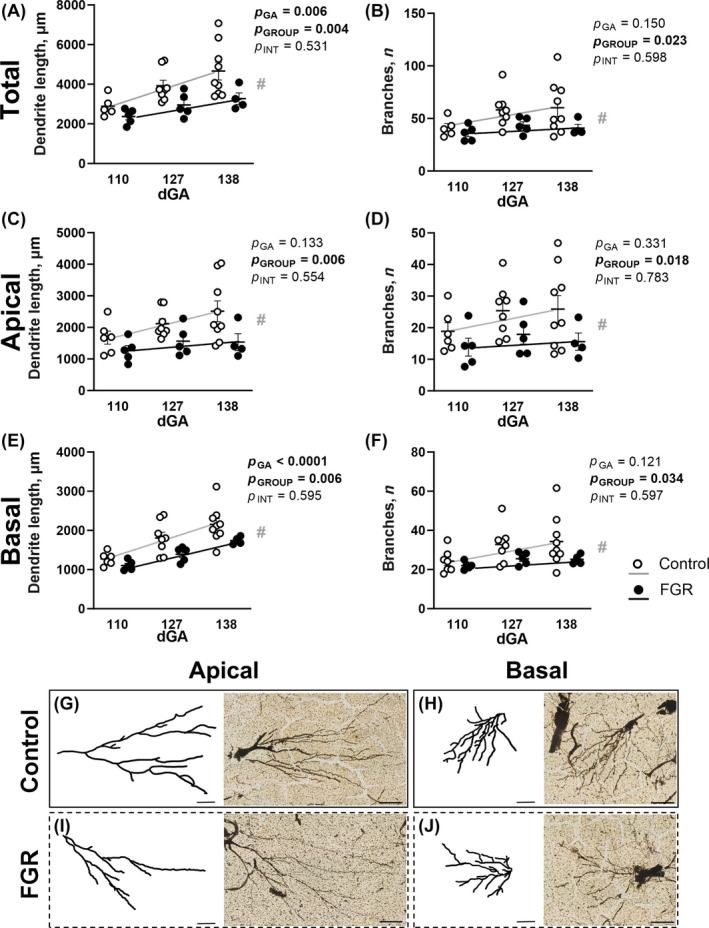
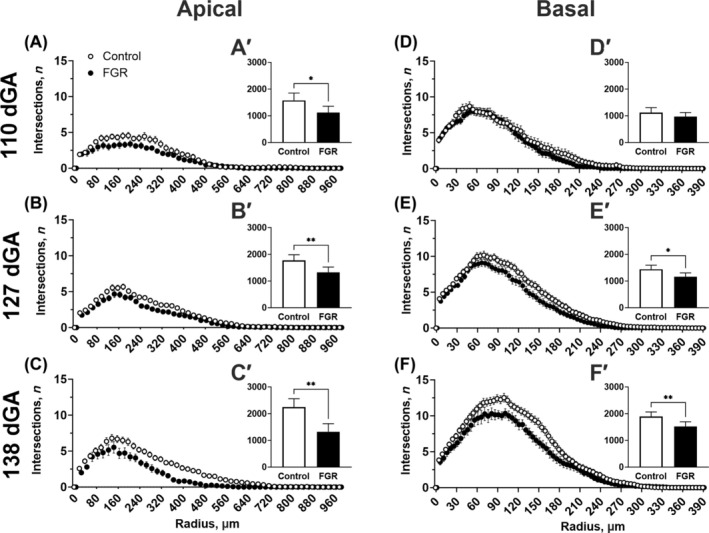
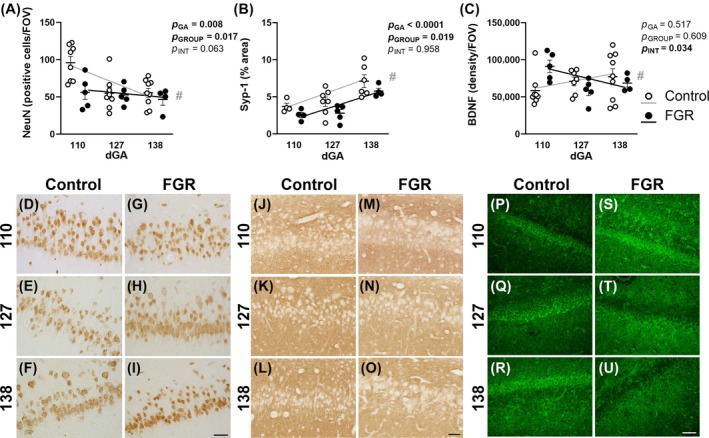
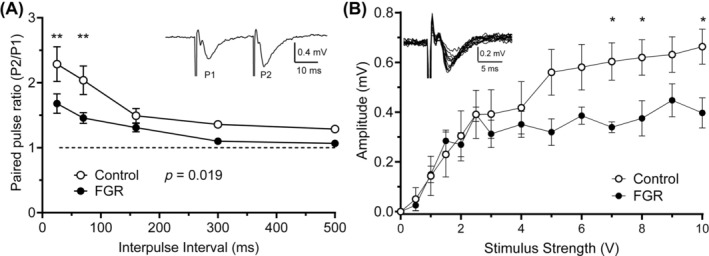
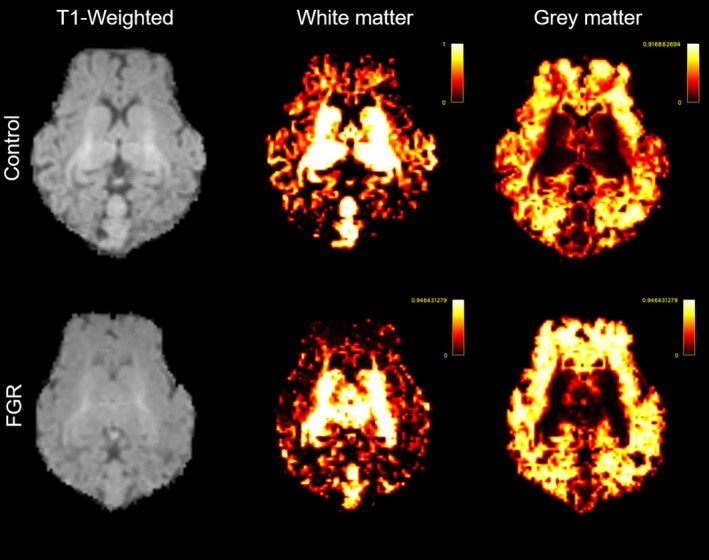
The last pregnancy trimester is critical for fetal brain development but is a vulnerable period if the pregnancy is compromised by fetal growth restriction (FGR). The impact of FGR on the maturational development of neuronal morphology is not known, however, studies in fetal sheep allow longitudinal analysis in a long gestation species. Here we compared hippocampal neuron dendritogenesis in FGR and control fetal sheep at three timepoints equivalent to the third trimester of pregnancy, complemented by magnetic resonance image for brain volume, and electrophysiology for synaptic function. We hypothesized that the trajectory of hippocampal neuronal dendrite outgrowth would be decreased in the growth-restricted fetus, with implications for hippocampal volume, connectivity, and function. In control animals, total dendrite length increased with advancing gestation, but not in FGR, resulting in a significantly reduced trajectory of dendrite outgrowth in FGR fetuses for total length, branching, and complexity. Ex vivo electrophysiology analysis shows that paired-pulse facilitation was reduced in FGR compared to controls for cornu ammonis 1 hippocampal outputs, reflecting synaptic dysfunction. Hippocampal brain-derived neurotrophic factor density decreased over late gestation in FGR fetuses but not in controls. This study reveals that FGR is associated with a significant deviation in the trajectory of dendrite outgrowth of hippocampal neurons. Where dendrite length significantly increased over the third trimester of pregnancy in control brains, there was no corresponding increase over time in FGR brains, and the trajectory of dendrite outgrowth in FGR offspring was significantly reduced compared to controls. Reduced hippocampal dendritogenesis in FGR offspring has severe implications for the development of hippocampal connectivity and long-term function.

Keywords: FGR; IUGR; MRI; brain injury; brain volume; electrophysiology; preterm.


Conflict of interest statement

The authors declare that there are no conflicts of interest.

Figures

FIGURE 1
FIGURE 1
Fetal body weight and brain:body weight ratio across gestation. Body weight (A) and brain weight were corrected for body weight (B) in control (white) and fetal growth restriction (FGR; black) fetuses at 110, 127, and 138 days gestation (dGA). Data are mean ± SEM N = 4–9 per group. Two‐way ANOVA with gestational age and group (control vs. FGR) as variables with Šídák's multiple comparisons test. ****p < 0.0001, *p < 0.05 between groups (control vs. FGR). Linear regression analysis is overlaid for control (grey line) and FGR (black line) fetuses, # indicates significantly different slope or intercept between groups (control vs. FGR).
FIGURE 2
FIGURE 2
Hippocampal neuron analysis of dendrite length and branch number. Golgi‐stained analysis for total summated dendrite length (A), total summated branch number (B), apical dendrite length (C), apical branch number (D), basal dendrite length (E) and basal branch number (F) in control (white) and fetal growth restriction (FGR; black) fetuses at 110, 127, and 138 days gestation (dGA). Representative dendrite morphology using mean values for dendrite length and branching at 127 dGA in control (G, H) and FGR (I, J) fetuses, shown for both apical and basal arbors with corresponding Golgi‐stained sections. Scale bar = 50 μm. Data are mean ± SEM N = 4–9 per group. Two‐way ANOVA with gestational age and group (control vs. FGR) as variables with Šídák's multiple comparisons test. Linear regression analysis is overlaid for control (grey line) and FGR (black line) fetuses, # indicates significantly different intercepts between groups (control vs. FGR). Scale bar = 50 μm.
FIGURE 3
FIGURE 3
Hippocampal neuron analysis of spines. Golgi‐stained analysis for total summated spine number (A) and total spine density (B) in control (white) and fetal growth restriction (FGR; black) fetuses at 110, 127, and 138 days gestation (dGA) with representative images of spines from control (C) and FGR (D) at 127 dGA. Data are mean ± SEM N = 4–9 per group. Two‐way ANOVA with gestational age and group (control vs. FGR) as variables with Šídák's multiple comparisons test. Linear regression analysis is overlaid for control (grey line) and FGR (black line) fetuses, # indicates significantly different intercepts between groups (control vs. FGR). Scale bar = 10 μm.
FIGURE 4
FIGURE 4
Hippocampal neuron analysis of dendrite complexity. Sholl analysis (A–F) and total area under the curve (A′–F′) for control (white) and fetal growth restriction (FGR; black) fetuses at 110, 127, and 138 days gestation (dGA). Data are mean ± SEM N = 4–9 per group. Two‐tailed unpaired t‐test **p < 0.01, *p < 0.05 between groups (control vs. FGR).
FIGURE 5
FIGURE 5
Immunohistochemical analysis. Neuronal cell counts (NeuN, A), synapsin‐1 (Syp‐1) % area positive staining (B) and brain‐derived neurotrophic factor (BDNF) staining density (C) in the hippocampus for control (white) and fetal growth restriction (FGR black) fetuses at 110, 127, and 138 days gestation (dGA) with representative photomicrographs of NeuN (D–I), Syp‐1 (J–O) and BDNF (P–U) staining in control and FGR fetuses at 110, 127, and 138 dGA. Data are mean ± SEM. N = 4–9 per group. Two‐way repeated measures ANOVA with gestational age and group (control vs. FGR) as variables with Šídák's multiple comparisons test. Linear regression analysis is overlaid for control (grey line) and FGR (black line) fetuses, # indicates significantly different slope or intercept between groups (control vs. FGR). Scale bar = 50 μm.
FIGURE 6
FIGURE 6
Hippocampal electrophysiology. Paired‐pulse facilitation (PPF) in hippocampal cornu ammonis 1 region for interpulse intervals of 25–500 ms (A) with inset example trace data of PPF with an interpulse interval of 25 ms. Input/output relationships (B) for control (white) and fetal growth restriction (FGR; black) fetuses at 127 days gestation with inset example of data traces for the responses evoked by increasing stimulus strengths. Data are mean ± SEM. N = 6 control and n = 5 FGR. Two‐way repeated measures ANOVA with Tukey multiple comparisons test. **p < 0.01, *p < 0.05 between groups (control vs. FGR).
FIGURE 7
FIGURE 7
Magnetic resonance imaging brain volume. Non‐binary partial volume images for each class in a representative control brain (top panels) and fetal growth restriction brain (bottom panels) at 127 days gestation, showing white matter and grey matter voxel‐based tissue volumes. Each voxel contains a value in the range 0–1 (as shown in the scale) that represents the tissue classification present in that voxel.

Similar articles

References

    1. Dall'Asta A, Melito C, Morganelli G, Lees C, Ghi T. Determinants of placental insufficiency in fetal growth restriction. Ultrasound Obstet Gynecol. 2023;61(2):152–157. - PubMed
    1. Gordijn SJ, Beune IM, Thilaganathan B, Papageorghiou A, Baschat AA, Baker PN, et al. Consensus definition of fetal growth restriction: a Delphi procedure. Ultrasound Obstet Gynecol. 2016;48(3):333–339. - PubMed
    1. Lees CC, Stampalija T, Baschat AA, da Silva Costa F, Ferrazzi E, Figueras F, et al. ISUOG practice guidelines: diagnosis and management of small‐for‐gestational‐age fetus and fetal growth restriction. Ultrasound Obstet Gynecol. 2020;56(2):298–312. - PubMed
    1. Malhotra A, Allison BJ, Castillo‐Melendez M, Jenkin G, Polglase GR, Miller SL. Neonatal morbidities of fetal growth restriction: pathophysiology and impact. Front Endocrinol (Lausanne). 2019;10:55. - PMC - PubMed
    1. Rock CR, White TA, Piscopo BR, Sutherland AE, Miller SL, Camm EJ, et al. Cardiovascular and cerebrovascular implications of growth restriction: mechanisms and potential treatments. Int J Mol Sci. 2021;22(14):7555. - PMC - PubMed

Substances

LinkOut - more resources