. 2025 Jan 9;380(1917):20230211.
doi: 10.1098/rstb.2023.0211. Epub 2025 Jan 9.

A global biogeographic regionalization for butterflies

Affiliations

A global biogeographic regionalization for butterflies

Collin P Gross et al. Philos Trans R Soc Lond B Biol Sci. .

Abstract

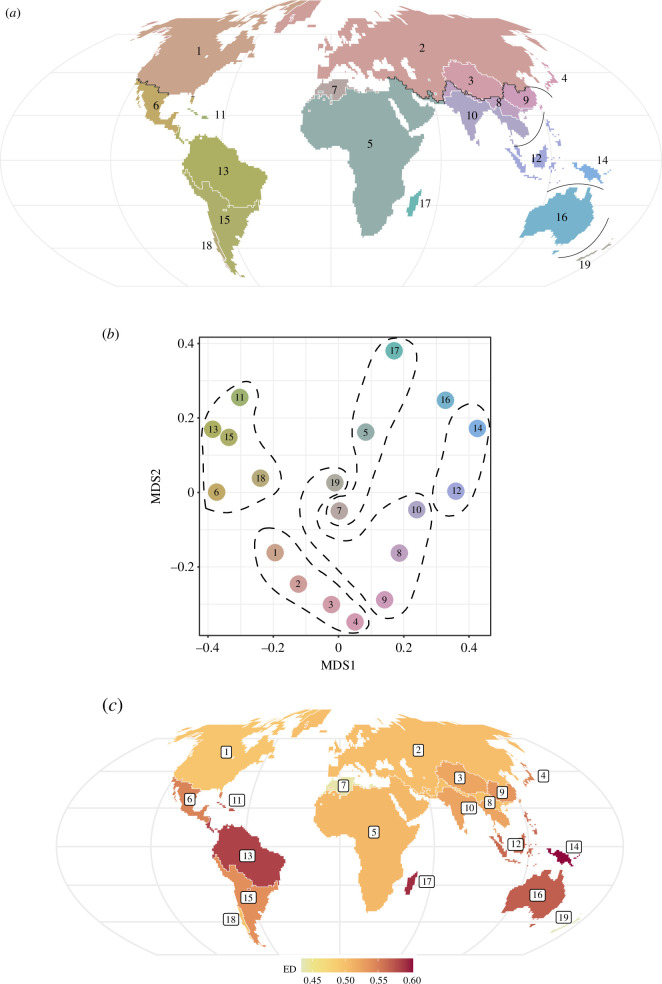
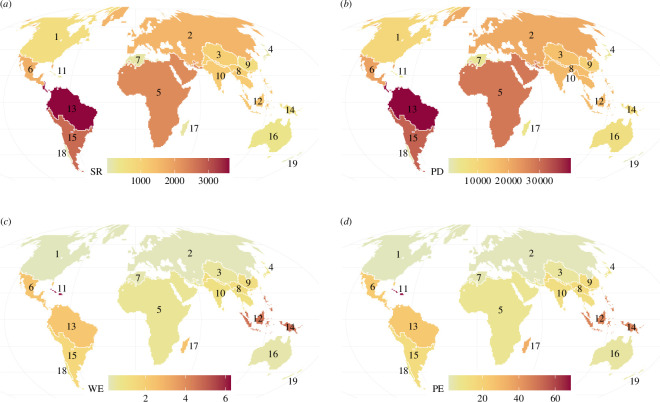
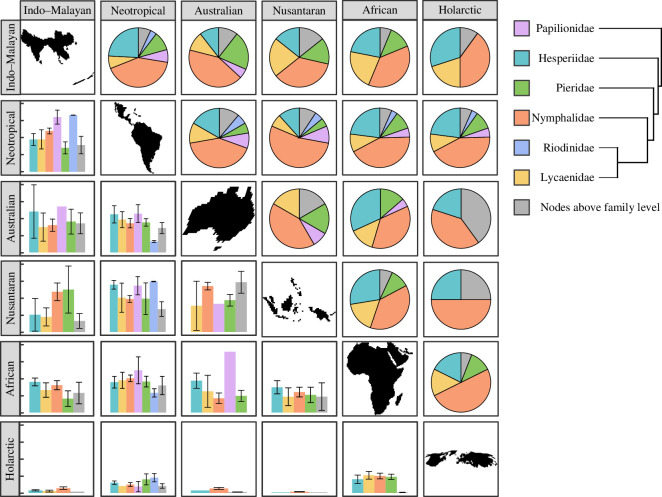
The partitioning of global biodiversity into biogeographic regions is critical for understanding the impacts of global-scale ecological and evolutionary processes on species assemblages as well as prioritizing areas for conservation. However, the lack of globally comprehensive data on species distributions precludes fine-scale estimation of biogeographical regionalization for numerous taxa of ecological, economic and conservation interest. Using a recently published phylogeny and novel curated native range maps for over 10 000 species of butterflies around the world, we delineated biogeographic regions for the world's butterflies using phylogenetic dissimilarity. We uncovered 19 distinct phylogenetically delimited regions (phyloregions) nested within 6 realms. Regional boundaries were predicted by spatial turnover in modern-day temperature and precipitation seasonality, but historical climate change also left a pronounced fingerprint on deeper- (realm-) level boundaries. We use a culturally and ecologically important group of insects to expand our understanding of how historical and contemporary factors drive the distribution of organismal lineages on the Earth. As insects and global biodiversity more generally face unprecedented challenges from anthropogenic factors, our research provides the groundwork for prioritizing regions and taxa for conservation, especially with the goal of preserving the legacies of our biosphere's evolutionary history.This article is part of the discussion meeting issue 'Bending the curve towards nature recovery: building on Georgina Mace's legacy for a biodiverse future'.

Keywords: biogeographic regionalization; butterflies; lepidoptera; phylogenetic beta diversity.


Conflict of interest statement

We declare we have no competing interests.

Figures

A global phylogenetic regionalization of butterfly species (n = 10 372 species)
Figure 1.
A global phylogenetic regionalization of butterfly species (n = 10 372 species). (a) Map showing the 19 major butterfly regions around the world, defined by phylogenetic similarity. White lines represent divisions between regions (80% of variation in phylogenetic dissimilarity explained), while black lines represent deeper divisions between realms (65% of variation explained). (b) Non-metric multidimensional scaling (NMDS) plot showing relationships between regions (numbered circles) and realms (dotted outlines). (c) Regions coloured by evolutionary distinctiveness (ED). A region is darker if the mean value of phylogenetic beta diversity between it and all other regions is greater. Numbered regions: 1) North American, 2) Eurasian, 3) Tibetan, 4) Japanese, 5) Afrotropical, 6) Mesoamerican, 7) Maghrebi, 8) Hengduan–Himalayan, 9) Chinese, 10) Indian, 11) Caribbean, 12) Malesian, 13) Amazonian, 14) Papuasian, 15) Pampeo-Andean, 16) Australian, 17) Madagascan, 18) Valdivian and 19) Novozelandic. Maps are Mollweide projections.
Diversity and endemism in the 19 major regions of butterflies around the world
Figure 2.
Diversity and endemism in the 19 major butterfly regions around the world. Species richness (a) and phylogenetic diversity (Faith’s PD; (b) are calculated across all species in each region. Weighted species (c) and phylogenetic endemism (d) are averaged across 100 km × 100 km grid cells within a region.
Effect sizes from spatially-explicit hierarchical generalized linear models
Figure 3.
Effect sizes from spatially explicit hierarchical generalized linear models of whether a 100 km × 100 km grid cell was in contact with (a) any border between butterfly phyloregions, (b) deep boundaries between realms or (c) shallow regional boundaries within realms. Terrain ruggedness index (TRI) represents the mean absolute difference in elevation between each cell and eight adjacent cells; climate heterogeneity represents the coefficient of variation between each cell and eight adjacent cells. Bars indicate effect sizes (Fisher’s z); error bars represent 95% confidence intervals of z. Asterisks represent effect sizes significantly different from zero; 0 < p < 0.001: ***; 0.001 < p < 0.01: **; 0.01 < p < 0.05: *.
Contributions of 83 potential ‘indicator’ butterfly clades to divisions between 6 biogeographic realms, totaling 411 pairwise comparisons
Figure 4.
Contributions of 83 potential ‘indicator’ butterfly clades to divisions between 6 biogeographic realms, totaling 411 pairwise comparisons. Colours represent nodes within families (including between and within subfamilies, tribes and genera) or older nodes above the level of family. Above the diagonal, each pie chart represents the relative contribution of each type of node to distinguishing between the pair of realms. Below the diagonal, bars indicate the mean R2 value in a model of specific overrepresentation score (SOS) response to realm identity across all the nodes within a group for each realm pair (electronic supplementary material, table S5). Y-axis tick marks correspond to 0.0, 0.25, 0.50, 0.75 and 1.00. Hedylidae, sister to Hesperiidae, is not shown because neither nodes within the family nor the node subtending Hesperiidae and Hedylidae contributed to divisions between realms.

References

    1. Holt BG, et al. . 2013. An update of Wallace’s zoogeographic regions of the world. Science 339, 74–78. (10.1126/science.1228282) - DOI - PubMed
    1. Whittaker RJ, Riddle BR, Hawkins BA, Ladle RJ. 2013. The geographical distribution of life and the problem of regionalization: 100 years after Alfred Russel Wallace. J. Biogeogr. 40, 2209–2214. (10.1111/jbi.12235) - DOI
    1. Wallace AR. 1876. The geographical distribution of animals. Cambridge, UK: Cambridge University Press.
    1. Andrew ME, Wulder MA, Coops NC. 2011. How do butterflies define ecosystems? A comparison of ecological regionalization schemes. Biol. Conserv. 144, 1409–1418. (10.1016/j.biocon.2011.01.010) - DOI
    1. Elliott TL, Davies TJ. 2019. A comparison of phylogenetic and species beta diversity measures describing vegetation assemblages along an elevation gradient. J. Veg. Sci. 30, 98–107. (10.1111/jvs.12700) - DOI