. 1985 Jan 15;24(2):376-83.
doi: 10.1021/bi00323a021.

Time-resolved fluorescence anisotropies of diphenylhexatriene and perylene in solvents and lipid bilayers obtained from multifrequency phase-modulation fluorometry

Time-resolved fluorescence anisotropies of diphenylhexatriene and perylene in solvents and lipid bilayers obtained from multifrequency phase-modulation fluorometry

J R Lakowicz et al. Biochemistry. .

Abstract

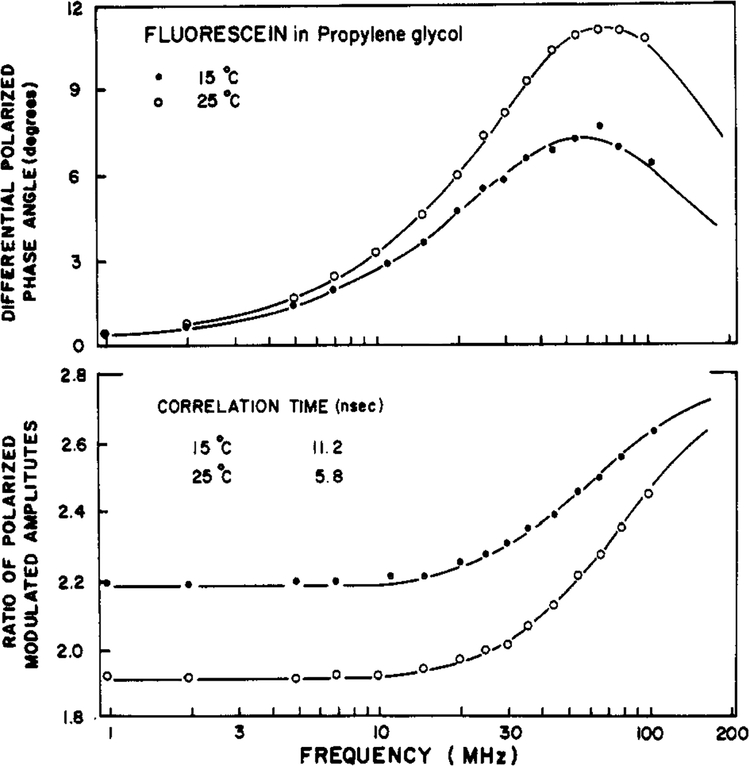
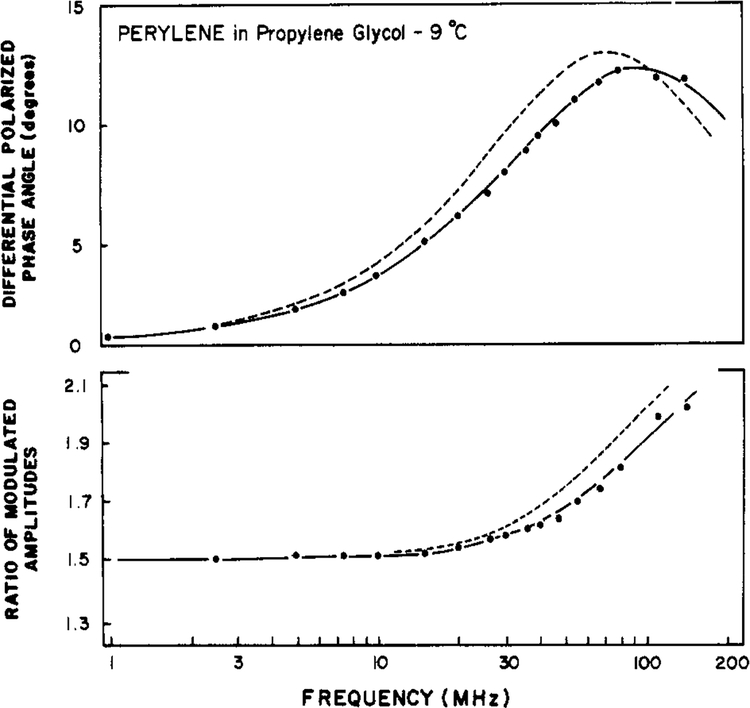
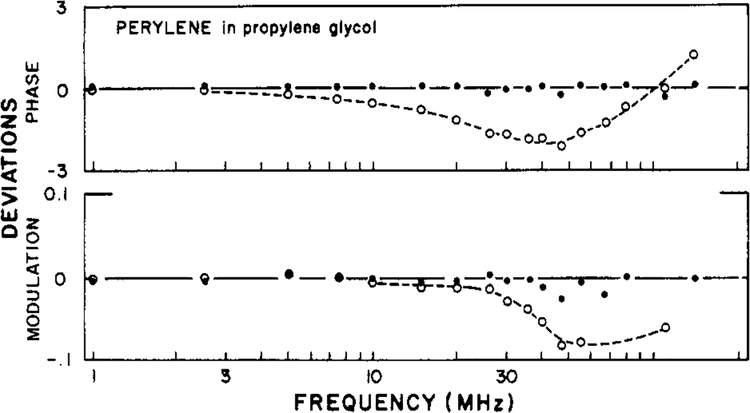
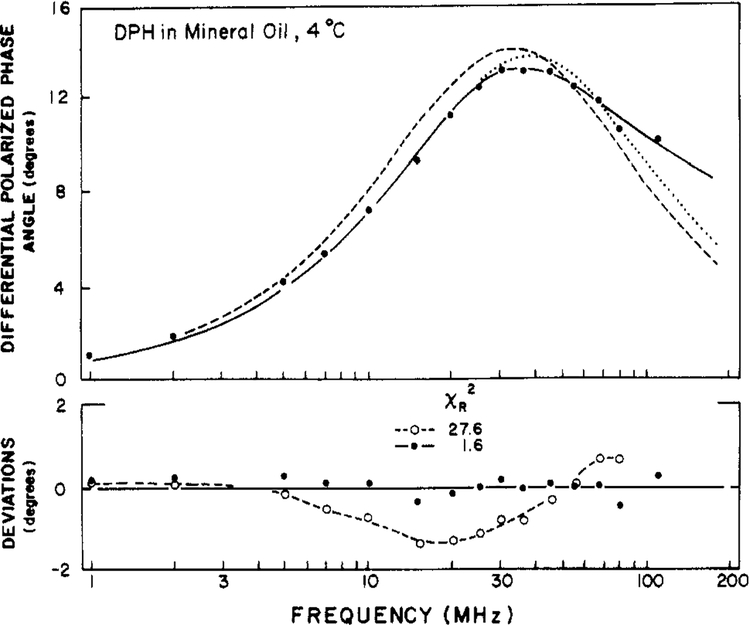
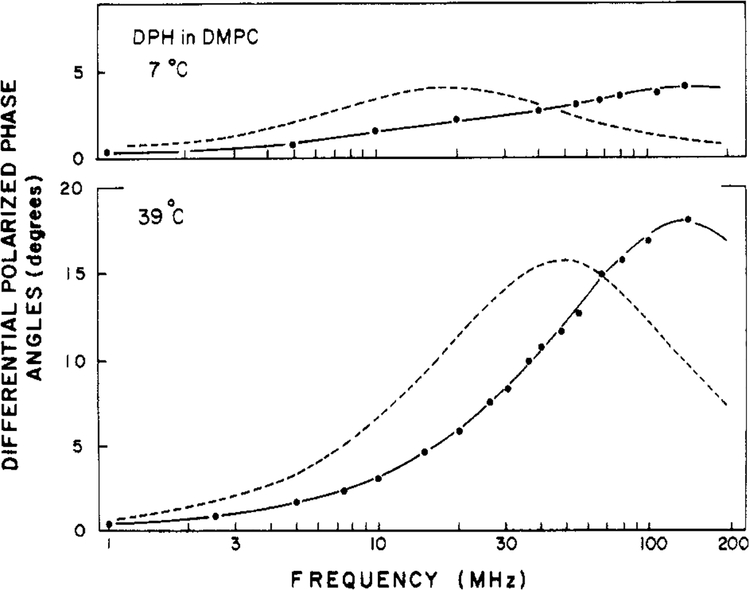
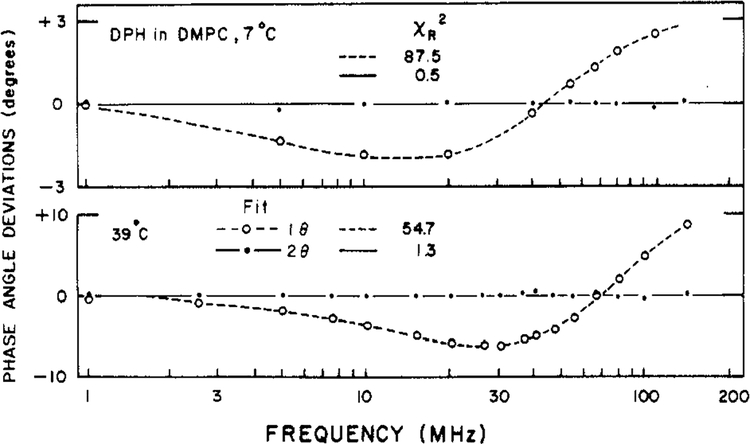
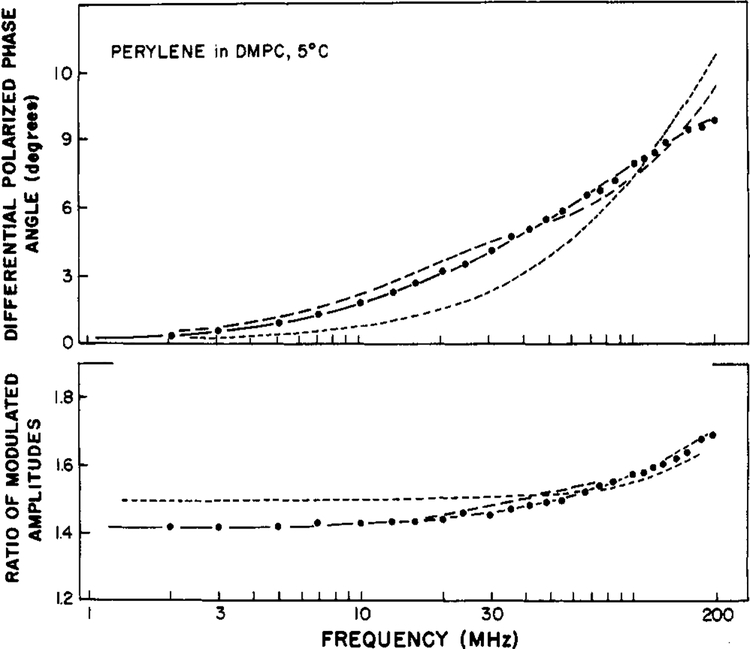
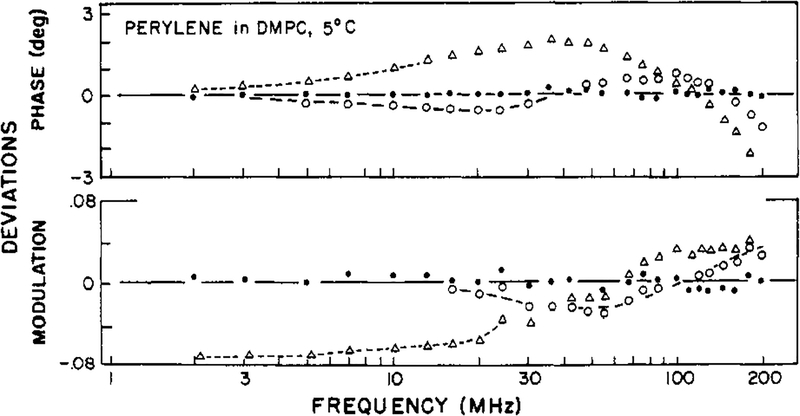
Time-resolved decays of fluorescence anisotropy were obtained from frequency-domain measurements of the phase angle difference between the parallel and perpendicular components of the polarized emission and the ratio of the modulated amplitudes. These data were measured at modulation frequencies ranging from 1 to 200 MHz. To demonstrate the general applicability of this method, we describe the resolution of both simple and complex decays of anisotropy. In particular, we resolved single, double, and triple exponential decays of anisotropy and the hindered rotational motions of fluorophores within lipid bilayers. The ease and rapidity with which these results were obtained indicate that frequency-domain measurements are both practical and reliable for the determination of complex decays of anisotropy.


Figures

FIGURE 1:
FIGURE 1:
Differential polarized phase angles (top) and modulated amplitude ratio (bottom) for fluorescein in propylene glycol. Data are shown at 15 (●) and 25 (○) °C.
FIGURE 2:
FIGURE 2:
Differential polarized phase angles (top) and modulated amplitude ratio (bottom) for perylene in propylene glycol at −9 °C. The solid line shows the best fit to the data (●) obtained by using two correlation times, χR2 = 0.7. The dashed line is the best fit obtained by using a single correlation time, χR2 = 25.
FIGURE 3:
FIGURE 3:
Deviation between the measured and calculated data for perylene in propylene glycol at −9 °C. Deviations are shown for the best fits obtained by using a single correlation time (○) and two correlation times (●). In both cases r0 was held constant at the measured value of 0.312.
FIGURE 4:
FIGURE 4:
Differential polarized phase angles for DPH in mineral oil at 4 °C. Data (●) and theoretical curves are shown for the models by using two correlation times (—), a single correlation time with a nonzero r (⋯), and a single correlation time with r = 0 (---). The lower panel shows the deviations between the measured and calculated values for the two correlation time model [(●) χR2 = 1.6] and the single correlation time model with r = 0 [(○) χR2 = 27.6].
FIGURE 5:
FIGURE 5:
Differential polarized phase angles for DPH in DPPC vesicles. The solid line represents the best fit to the data (●) by using the model with two correlation times. The dashed line represents the best fit by using a single correlation time and r = 0.
FIGURE 6:
FIGURE 6:
Deviations between the measured and calculated differential phase angles for DPH in DMPC vesicles. Deviations are shown for the two correlation time model (●) and for the single correlation time model with r = 0 (○).
FIGURE 7:
FIGURE 7:
Differential polarized phase angles and modulated amplitude ratios for perylene in DMPC vesicles at 5 °C. The best fits are shown to the data (●) by using the three-correlation time model (—), two-correlation time model (--), and a single correlation time with a nonzero r(---).
FIGURE 8:
FIGURE 8:
Deviations between the measured and calculated frequency-domain data for perylene in DMPC vesicles at 5 °C. Deviations are shown for the three-correlation time model (●), the two-correlation time model (○) and the hindered model (Δ).

References

    1. Barkley MD, Kowalczyk AA, & Brand L (1981) J.Chem. Phys 75, 3581–3593.
    1. Bevington PR (1969) Data Reduction and Error Analysis in the Physical Sciences, McGraw Hill, New York.
    1. Chen LA, Dale RE, Roth S, & Brand L (1977) J. Biol. Chem 252, 2319–2324. - PubMed
    1. Dale RE, Chen LA, & Brand L (1977) J. Biol. Chem 252, 7500–7510. - PubMed
    1. Gratton E, & Limkeman M (1983) Biophys. J 44, 315–324. - PMC - PubMed

Publication types