. 2025 Jan 7;10(1):e70060.
doi: 10.1002/lio2.70060. eCollection 2025 Feb.

Social network analysis as a new tool to measure academic impact of physicians

Affiliations

Social network analysis as a new tool to measure academic impact of physicians

Niketna Vivek et al. Laryngoscope Investig Otolaryngol. .

Abstract

Introduction: H-index is a widely used metric quantifying a researcher's productivity and impact based on an author's publications and citations. Though convenient to calculate, h-index fails to incorporate collaborations and interrelationships between physicians into its assessment of academic impact, leading to limited insight into grouped networks. We present social network analysis as a tool to measure relationships between physicians and quantify their academic impact.

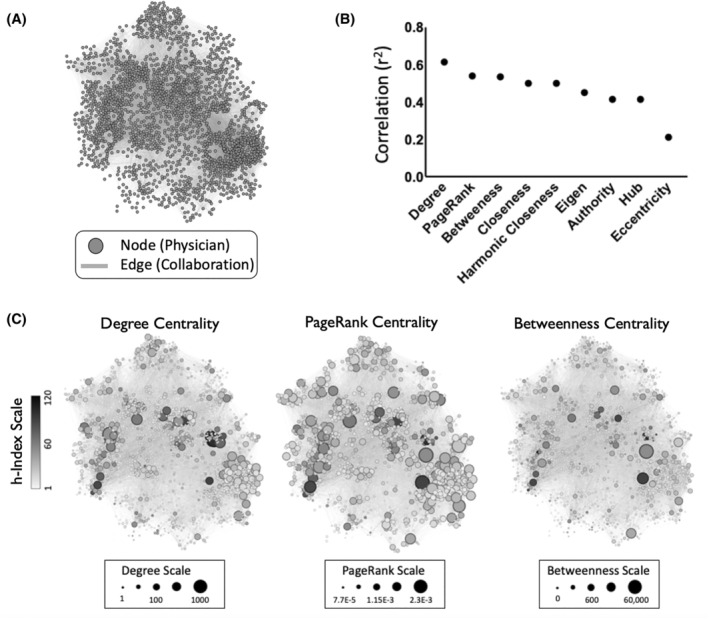
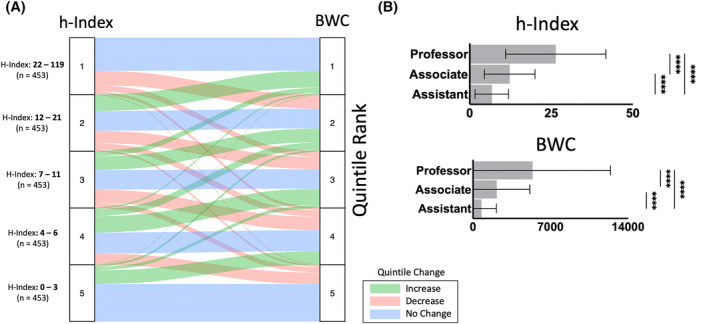
Methods: A bibliometric multicenter analysis was conducted on physician faculty from 129 US ACGME accredited otolaryngology programs who have publications with a physician co-author in the field. Using web searches, 2494 physician faculty were identified. Scopus IDs, h-indices, and publication data for these physicians were identified using multiple Elsevier APIs queried in December 2023. Publications with multiple otolaryngology physician co-authors were included. Network and sub network maps were generated using Gephi and analyzed with custom R scripts. Centrality measures (degree, PageRank, betweenness centralities) quantified collaboration propensity. Non-parametric correlation analysis between centrality measures and h-index was conducted. Sankey diagrams were plotted using ggplot2.

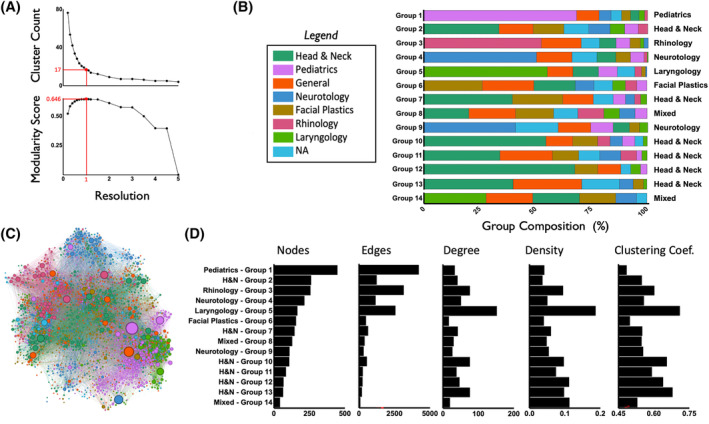
Results: A co-authorship network of 2259 physicians was constructed. Physicians were visualized as nodes with collaborations as links. Centrality measures correlated strongly with h-index (h-index vs. degree centrality: r 2 = 0.62, h-index vs. PageRank: r 2 = 0.55, h-index vs. betweenness centrality: r 2 = 0.55; p < .0001). Analysis revealed novel insights into physician network structure, identifying 14 communities primarily populated by single subspecialties with varied node density.

Conclusion: Social network analysis showed moderate correlation between social connectedness measures and h-index, supporting its use in measuring academic impact. In otolaryngology, collaborative interactions within the academic community are strongly shaped by sub-specialty affiliation and academic institution.

Keywords: academic otolaryngology; faculty; h‐index; otolaryngology; publication; social network.


Conflict of interest statement

The authors report no conflicts of interest.

Figures

FIGURE 1
FIGURE 1
Network plots of American otolaryngologists were generated and visualized using Gephi. Each node (n = 2259) representing a physician and each edge (n = 28,409) representing a collaboration (co‐authorship) on a published, peer‐reviewed manuscript. From the 24,095 manuscripts with at least two otolaryngologist co‐authors, a total of 89,929 connections were identified. Repeat connections between physicians was used to determine edge weights (A). Following network generation, centrality measures for each node were determined using built in Gephi software. Centrality measures including Degree, PageRank, Betweenness, Closeness, Harmonic closeness, Eigenvector (eigen), Authority, Hub, and Eccentricity. The coefficient of determination (r 2) was then calculated for each centrality measure compared to h‐index using Spearman's correlation analysis to account for non‐normal distribution. Coefficients of determination values were ranked from largest to smallest and visualized using a dot plot (B). Network plots were used to visualize h‐Index and the three most highly correlated centrality measures, Degree, PageRank, and Betweenness. H‐index is represented by node color, with darker nodes having a higher h‐index. The respective centrality values are represented by variations in node size with larger nodes having increased centrality (C).
FIGURE 2
FIGURE 2
A Sankey diagram comparing h‐index and betweenness centrality (BWC) was generated. Physicians were grouped into h‐index quintiles of equal physician number (n = 453) for ease of visualization and interpretation. Quintiles were ranked with a quintile 1 (largest h‐index or BWC values) to quintile 5 (smallest h‐index or BWC values). To compare h‐index quintiles with BWC quintiles, the percent of each h‐index quintile that remained in the same, decreased, or increased in rank from h‐index to BWC was quantified as a percent of the total group (H Quintile 1: Same: 58.28%, Decrease: 41.7%, H Quintile 2: Same: 34.87%, Decrease: 35.98%, Increase: 29.13%, H Quintile 3: Same: 34.22%, Decrease: 32.45%, Increase: 33.33%, H Quintile 4: Same: 36.86%, Decrease: 19.87%, Increase: 43.27%, H Quintile 5: Same: 66.00%, Increase: 34.00%) (A). Network data was then separated based on academic appointment, Assistant Processor, Associate Professor, and Professor. Average h‐index and BWC values for each group was determined and compared. A significant increase in both h‐index and BWC values was observed as academic appointment rank increased (Average h‐index: Assistant Professor vs. Associate Professor, 6.78 ± 5.51 vs. 12.26 ± 7.79, p < .0001; Assistant Professor vs. Professor, 6.78 ± 5.51 vs. 26.38 ± 15.36, p < .0001; Associate Professor vs. Professor, 12.26 ± 7.79 vs. 26.38 ± 15.36, p < .0001. Average BWC: Assistant Professor vs. Associate Professor, 769.81 ± 1347.19 vs. 2154.53 ± 2974.60, p < .0001; Assistant Professor vs. Professor, 769.81 ± 1347.19 vs. 5392.23 ± 7033.32, p < .0001; Associate Professor vs. Professor, 2154.53 ± 2974.60 vs. 5392.23 ± 7033.32, p < .0001) (B).
FIGURE 3
FIGURE 3
Modularity maximization and elbow plot analysis was implemented to determine the optimal number of communities (clusters) within the larger network. Modularity score values were generated using Gephi's Louvain algorithm over a range of resolution values. Higher modularity scores indicate better community detection, with communities containing a higher density of inter‐node connections and restricted connections with nodes from other communities. Lower resolution values result in increased numbers of clusters and higher resolution values result in fewer clusters. Resolution values were plotted against modularity score and cluster count. The Louvain algorithm was run multiple times (n = 5) at each resolution to ensure stability, and the average modularity score and cluster count were plotted. The maximum modularity of 0.646 is achieved at a resolution of 1.0, producing 17 total clusters (A). A total of 14 of the sub communities were included for downstream analysis, with three communities being eliminated due to exclusion criteria (nodes <50). Each community's population was isolated and the composition of physicians by specialty was quantified as a percent of the total group. Group 1–7 and 9–13 were dominated by a single specialty and were labeled according to said specialty. Groups 8 and 14 had multiple large specialties occupying the cluster and were denoted as “Mixed” (B). Nodes in the full network map were colored based on specialty. Nodes for each respective specialty shared similar geographical regions of the network map (C). Node count, edge count, average weighted degree, cluster density, and average cluster coefficient were quantified for each of the 14 groups (D).

Similar articles

References

    1. Hirsch JE. An index to quantify an individual's scientific research output. Proc Natl Acad Sci U S A. 2005;102(46):16569‐16572. doi:10.1073/PNAS.0507655102/ASSET/8BAD4608-B7BF-4215-8D0A-5C29F690AE48/ASSETS/GRAPHIC/ZPQ0420598740002.JPEG - DOI - PMC - PubMed
    1. Eloy JA, Blake DM, D'Aguillo C, Svider PF, Folbe AJ, Baredes S. Academic benchmarks for otolaryngology leaders. Ann Otol Rhinol Laryngol. 2015;124(8):622‐629. doi:10.1177/0003489415573073 - DOI - PubMed
    1. Moffatt DC, Shah P, Wright AE, Zon K, Pine HS. An Otolaryngologist's guide to understanding the H‐index and how it could affect your future career. OTO Open. 2022;6(2):1‐6. doi:10.1177/2473974X221099499 - DOI - PMC - PubMed
    1. Svider PF, Choudhry ZA, Choudhry OJ, Baredes S, Liu JK, Eloy JA. The use of the h‐index in academic otolaryngology. Laryngoscope. 2013;123(1):103‐106. doi:10.1002/LARY.23569 - DOI - PubMed
    1. Wang R, Lewis M, Zheng‐Pywell R, Julson J, Smithson M, Chen H. Using the H‐index as a factor in the promotion of surgical faculty. Heliyon. 2022;8(4):e09319. doi:10.1016/j.heliyon.2022.e09319 - DOI - PMC - PubMed

LinkOut - more resources