. 2024 Oct 29;3(11):pgae486.
doi: 10.1093/pnasnexus/pgae486. eCollection 2024 Nov.

Death and survival of gut CD4 T cells following HIV-1 infection ex vivo

Affiliations

Death and survival of gut CD4 T cells following HIV-1 infection ex vivo

Kaylee L Mickens et al. PNAS Nexus. .

Abstract

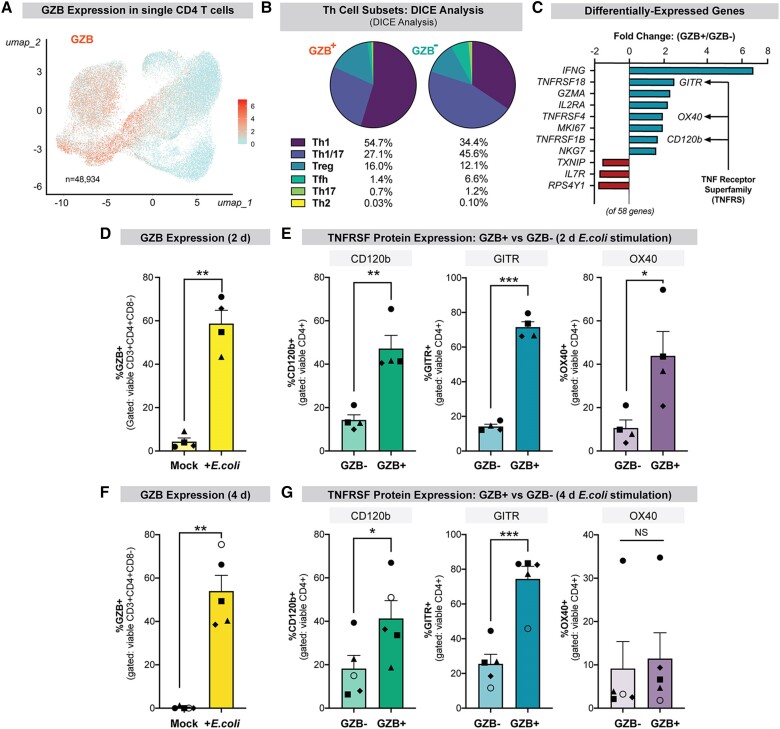
The gastrointestinal tract is ground zero for the massive and sustained CD4 T cell depletion during acute HIV-1 infection. To date, the molecular mechanisms governing this fundamental pathogenic process remain unclear. HIV-1 infection in the gastrointestinal tract is associated with chronic inflammation due to a disrupted epithelial barrier that results in microbial translocation. Here, we utilized the lamina propria aggregate culture model to demonstrate that the profound induction of granzyme B by bacteria in primary gut CD4 T cells ex vivo significantly contributes to HIV-1-mediated CD4 T cell death. Counterintuitively, a substantial fraction of gut granzyme B+ CD4 T cells harboring high levels of HIV-1 infection survive via a pathway linked to CD120b/TNFR2. Our findings underscore previously undescribed mechanisms governing the death and survival of gut CD4 T cells during HIV-1 infection that could inform strategies to counter HIV-1 pathogenesis and persistence in this critical tissue compartment.

Keywords: HIV-1; TNF response; cytotoxic CD4+ T lymphocytes; granzyme B; gut immunology.


Figures

Fig. 1.
Fig. 1.
HIV-1 infection and survival of GZB+ CD4 T cells in the LPAC model. A) Infection time course. At 0 dpi, LPMCs are spinoculated with TF HIV-1 for 2 h and then immediately cultured with commensal E. coli lysate. At 2 and 4 dpi, HIV-1 infection and viable CD4 T cell counts are measured. B) Gating strategy for GZB+ and GZBneg cells. Note that CD4 T cells were determined from CD3+ CD8− cells. C) Up-regulation of (Left) HIV-1-infected CD4 T cells (n = 9 donors; paired t test) and (Right) GZB (n = 8 donors for mock, n = 9 donors for HIV-1-infected; mixed-effects model) following E. coli stimulation. D) HIV-1 infection in GZB+ versus GZB− CD4 T cells, based on the gating strategy in Fig. 1B (n = 9 donors; two-tailed paired t test). E) Survival of GZB+ versus GZB− CD4 T cells following HIV-1 infection (n = 9 donors; one-way ANOVA with Sidak's multiple comparisons test) in the presence of E.coli lysate. Δ corresponds to the average CD4 T cell depletion relative to mock. CD4 T cell counts were normalized to mock-infected cultures as 100% for each donor. For each of C to E, each shape corresponds to a distinct LPMC donor. Bars represent mean (± SEM); *P < 0.05, ***P < 0.001. ns, not significant.
Fig. 2.
Fig. 2.
HIV-1 infection and GZB expression are associated with apoptosis. LPMCs were spinoculated with TF HIV-1 or mock infected and cultured with commensal E. coli lysate for 2 or 4 days. A) Gating strategy. Early apoptotic cells are defined as viable (Aqua Viability dye negative) and Annexin V positive. B) Percentages of early apoptotic GZB+ or GZB− CD3+ CD8− T cells CD3+ CD8− T cells at 2 dpi (n = 6) and 4 dpi (n = 5). C) Gating strategy for early apoptotic HIV-1-infected (p24+) or uninfected (p24−) CD4 T cells. D) Percentages of early apoptotic infected or bystander CD3+ CD8− T cells at 2 dpi (n = 6) and 4 dpi (n = 5). Statistical analyses for B and D were performed using two-tailed paired t test. **P < 0.01.
Fig. 3.
Fig. 3.
Effect of CD4 T cell-intrinsic GZB on HIV-1-mediated CD4 T cell death. A), B) LPMCs were spinoculated with TF HIV-1 or mock and cultured with or without commensal E. coli lysate in the presence/absence of the GZB inhibitor Z-AAD-CMK (250 μM) for 4 days. A) Intracellular GZB activity in cell lysates (n = 6 donors; two-tailed paired t test) was determined using a colorimetric assay. GZB cleavage of Ac-IEPD-pNA releases pNA, which can be detected at 405 nm. B). Total CD4 T cell survival normalized to donor-matched mock infection (n = 6 donors; Repeated Measures (RM) one-way ANOVA with Sidak's multiple comparisons test). C) LPMCs depleted of CD8 cells (–CD8) using magnetic beads were confirmed by flow cytometry (n = 4 donors, two-tailed paired t test). D) to F) Total or CD8-depleted LPMCs were spinoculated with TF HIV-1 or mock then cultured with E. coli lysate for 4 days. D) HIV-1 infection levels in LPMC versus CD8-depleted LPMCs (n = 4 donors, two-tailed paired t test). E) Intracellular GZB activity in cell lysates measured as in A. F) Total CD4 T cell survival normalized to matched mock control (n = 4 donors, RM one-way ANOVA with Sidak's multiple comparisons test). For A to F, bars correspond to mean values; P < 0.05, NS, not significant; P-values < 0.1 were noted. G) Model of HIV-1-mediated CD4 T cell death ± GZB activity (Biorender.com). Microbial translocation up-regulates GZB in gut CD4 T cells. When GZB activity is present, more HIV-1-mediated CD4 T cell death occurs for both infected and bystander CD4 T cells (blebbing cells). When GZB activity is blocked, less HIV-1-mediated CD4 T cell death occurs, leaving a larger surviving population of CD4 T cells.
Fig. 4.
Fig. 4.
A subset of GZB+ CD4 T cells express markers associated with cell survival. A) to C) Viable CD4 T cells from LPMC (n = 6 donors) cultured with E. coli lysate for 2 days were sorted prior to generation of V3 Chromium Single Cell 3′ Transcriptome libraries. Of 48,934 CD4 T cells captured, 15,317 (31%) were GZB+. A) Uniform Manifold Approximation and Projection (UMAP) graph of scRNAseq data; each dot represents a single cell; darker dots correspond to GZB+ CD4 T cells; lighter dots depict GZB− CD4 T cells. B) DICE analysis of CD4 T cell subsets in GZB+ and GZB− CD4 T cells. C) Select transcripts up-regulated (blue) and down-regulated (red) in GZB+ versus GZB− CD4 T cells. Arrows indicate TNFRSF genes. The full list of altered 58 genes is given in Table S1. D), F) GZB expression at 2 days (n = 4) and 4 days (n = 5) ± E. coli lysate stimulation. E), G) TNFRSF protein expression measured by flow cytometry at 2 days (n = 4) and 4 days (n = 5). For D) to G), differences between groups were evaluated by two-tailed paired t test. Bars represent mean ± SEM; *P < 0.05, **P < 0.01, ***P < 0.001. ns, not significant.
Fig. 5.
Fig. 5.
CD120b marks infected GZB+ CD4 T cells in the LPAC model. LPMCs were spinoculated with TF HIV-1 and then cultured for 4 days (A, B) or 6 days (C). HIV-1 infection (in CD3+ CD8− cells) was measured using intracellular p24 flow cytometry. Two-tailed paired t test, n = 5 donors (A, B), n = 6 donors (C). A), C) HIV-1 infection in CD120b ± GZB+ CD4 T cells 4 and 6 dpi. B) HIV-1 infection in GITR ± GZB+ CD4 T cells. D) to F). Single-cell transcriptome analysis (n = 6 donors; described in Fig. 4A) of 15,317 GZB+ CD4 T cells from LPMC cultured with E. coli lysate for 2 days. D) UMAP graph of scRNAseq data; each dot represents a single cell; darker dots correspond to CD120b+ GZB+ CD4 T cells; lighter dots depict CD120b− GZB+ CD4 T cells. E) DICE analysis of CD4 T cell subsets found in CD120b+ versus CD120b− GZB+ CD4 T cells. F) Select transcripts up-regulated in CD120b+ versus CD120b− GZB+ CD4 T cells. The full list of genes, fold-changes, and adjusted P-values are given in Table S2. Bars represent mean ± SEM. For A to D, *P < 0.05; **P < 0.01; ***P < 0.001. ns, not significant.
Fig. 6.
Fig. 6.
CD120b signaling is associated with GZB+ CD4 T cell survival in the LPAC model. LPMCs were spinoculated with TF HIV-1 and then cultured with E. coli lysate for 6 days. A) CD120b expression in gut CD4 T cells in HIV-1- versus mock-infected cultures with E. coli (n = 6 donors). B) Difference in absolute CD4 T cell counts between HIV-1-infected and mock (n = 6). C) Percent survival of GZB+ versus GZB− CD4 T cells (n = 6). D) Percent survival of CD120b+ versus CD120b− GZB+ CD4 T cells (n = 6 donors). E), F) Effect of CD120b blockade on CD4 T cell survival following HIV-1 infection. LPMCs were incubated with anti-CD120b (αCD120b) or a matched isotype control at 0 dpi. E) Percent survival of CD120b ± GZB+ CD4 T cells. F) Absolute number of infected (p24+) CD120b+ GZB+ CD4 T cells with or without αCD120 treatment. For C, D, and F, the percent survival was calculated relative to mock (100%) for each donor; Δ corresponds to the mean CD4 T cell depletion relative to mock. Group differences in A and B were evaluated by two-tailed paired t test; those in C to E were evaluated using RM one-way ANOVA with Sidak's multiple comparisons test. Bars represent mean (± SEM); *P < 0.05; **P < 0.01; ***P < 0.001. ns, not significant. G) Model of HIV-1 persistence in CD120b+ GZB+ CD4 T cells (Biorender.com). Cells with a receptor tag represent CD120b+ GZB+ CD4 T cells which have a survival advantage over CD120b− cells. Moreover, CD120b+ cells are more likely to be infected (integrated provirus).

Similar articles

References

    1. Fahey JL, et al. 1990. The prognostic value of cellular and serologic markers in infection with human immunodeficiency virus type 1. N Engl J Med. 322:166–172. - PubMed
    1. Brenchley JM, Douek DC. 2008. HIV infection and the gastrointestinal immune system. Mucosal Immunol. 1:23–30. - PMC - PubMed
    1. Doitsh G, et al. 2014. Cell death by pyroptosis drives CD4 T-cell depletion in HIV-1 infection. Nature. 505:509–514. - PMC - PubMed
    1. Miller SM, et al. 2017. Follicular regulatory T cells are highly permissive to R5-tropic HIV-1. J Virol. 91:e00430–17. - PMC - PubMed
    1. Mehandru S, Dandekar S. 2008. Role of the gastrointestinal tract in establishing infection in primates and humans. Curr Opin HIV AIDS. 3:22–27. - PubMed