. 2024 Jan 7:29:0130.
doi: 10.34133/bmr.0130. eCollection 2025.

Intratumoral Injection of Engineered Mycobacterium smegmatis Induces Antitumor Immunity and Inhibits Tumor Growth

Affiliations

Intratumoral Injection of Engineered Mycobacterium smegmatis Induces Antitumor Immunity and Inhibits Tumor Growth

Hang Zhou et al. Biomater Res. .

Abstract

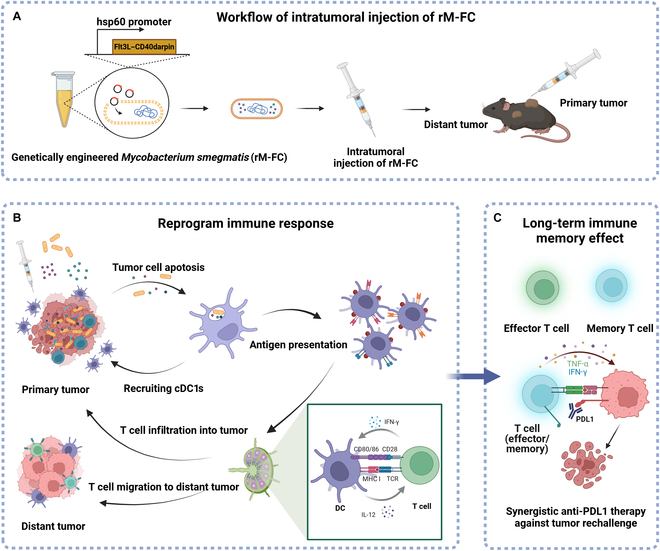
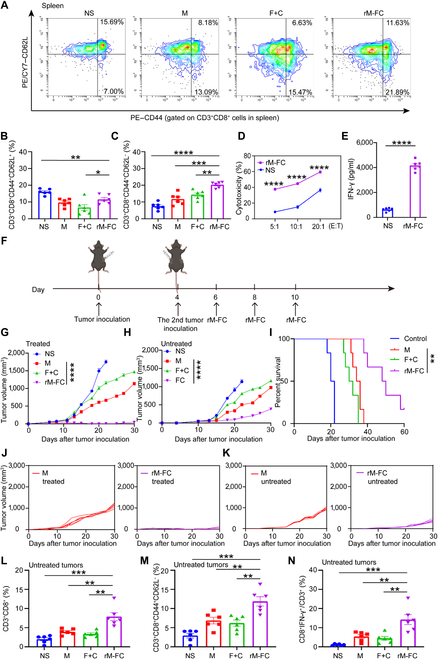
Conventional type 1 dendritic cells are essential for antigen presentation and successful initiation of antitumor CD8+ T cells. However, their abundance and function within tumors tend to be limited. Mycobacterium smegmatis, a fast-growing, nonpathogenic mycobacterium, proves to be easily modified with synthetic biology. Herein, we construct an engineered M. smegmatis expressing a fusion protein of Fms-like tyrosine kinase 3 ligand and costimulator CD40darpin (rM-FC) since the 2 drugs are reported to have a good synergistic effect. Intratumoral delivery of rM-FC effectively recruits and activates dendritic cells (DCs), especially CD103+ DCs and CD80+CD86+ DCs, further inducing sufficient migration of effector memory T cells into the tumor microenvironment. This successfully converts the so-called immune-desert tumors to the "hot" phenotype. In B16F10 mouse melanoma tumor models, local injection of rM-FC into the primary tumor triggers a robust T cell immune response to restrain the growth of both the treated tumors and the distant untreated ones. The population of PDL1+ tumor cells increased after the in situ vaccination, and murine tumors became more responsive to programmed death ligand 1 (PDL1) blockade, prompting the combination therapy. Overall, our findings demonstrate that rM-FC acts as a strong DC agonist and remarkably enhances antitumor immunity.


Conflict of interest statement

Competing interests: The authors declare that they have no competing interests.

Figures

Fig. 1.
Fig. 1.
Antitumor immune activation and regulatory mechanisms of recombinant Mycobacterium smegmatis expressing a fusion protein of human Fms-related tyrosine kinase 3 ligand (hFlt3L)–human CD40darpin (hCD40darpin) (rM-FC). (A) Schematic diagram of the engineered recombinant M. smegmatis. Briefly, the Fms-like tyrosine kinase 3 ligand (Flt3L)–CD40darpin gene fragment was cloned into a bacterial expression vector, and after induced protein expression, mice were treated by intratumoral injection. (B) Engineered M. smegmatis (rM-FC) induces a strong antitumor immune response and remodels the tumor microenvironment (TME), which combats the growth of distant tumors. Briefly, Flt3L could recruit conventional type 1 dendritic cells (cDC1s) into the TME and CD40darpin could further activate dendritic cells (DCs). M. smegmatis itself could lead to tumor cell lysis and upgrade the expression of CD40 on DCs in the TME after intratumoral injection. Flt3L, CD40darpin, and M. smegmatis have strong synergistic effects. (C) Engineered M. smegmatis synergistic anti-programmed death ligand 1 (anti-PDL1) therapy and generates long-term immune memory, which is against tumor rechallenge. IFN-γ, interferon-γ; MHC I, major histocompatibility complex class I; IL-12, interleukin 12; TNF-α, tumor necrosis factor-α.
Fig. 2.
Fig. 2.
In vitro DC and T cell activation and biodistribution analysis of rM-FC. (A) Plasmid map of a MycobacteriumEscherichia coli shuttle vector using pMV261 expressing the hFlt3L–hCD40darpin fusion protein. (B) Western blotting analysis of the induced engineered M. smegmatis (rM-FC). Lane marker: molecular mass marker; lane 1: whole bacteriological lysate of wild-type M. smegmatis (M) after heat shock; lane 2: rM-FC without heat shock; lane 3: rM-FC induced by heat shock. (C) The percentage of mature dendritic cells (mDCs; CD11c+CD80+CD86+) after coincubation with different concentrations of M or rM-FC in vitro for 20 h (n = 3). (D) Cellular uptake of DiO-labeled rM-FC after 2 h of incubation with bone-marrow-derived dendritic cells (BMDCs), as assessed by flow cytometry (n = 3). (E) Colocalization analysis of rM-FC (DiO, green) in BMDCs (DiI, red) by confocal microscopy (coincubated for 2 h). (F) The Flt3L–CD40darpin–His fusion protein was extracted from the lysates of rM-FC. Confocal laser scanning microscopy images of mouse BMDCs treated with the Flt3L–CD40darpin fusion protein, allophycocyanin (APC)–antimouse Fms-like tyrosine kinase 3 (Flt3), and phycoerythrin (PE)–antimouse CD40 for 2 h. White scale bars, 40 μm. (G) BMDCs were cultured in RPMI 1640 medium (Gibco) containing 10% fetal bovine serum (FBS), with 20 ng/ml granulocyte–macrophage colony-stimulating factor (GM-CSF) and lysates of 107 colony-forming units (CFU) M/rM-FC added on day 0, day 3, day 5, and day 7. On day 8, 10 nmol ovalbumin (OVA) peptides were added to the medium and coincubated with BMDCs for 24 h. CD11c+CD103+ DCs and CD11c+OVA+ DCs were tested on day 9 by flow cytometry (n = 3). (H) Splenocytes from C57BL/6 mice were incubated with 104 CFU M or 104 CFU rM-FC for 24 h. The quantification of CD69 and CD25 expression on CD8+ and CD4+ T cell subsets in the T cells (n = 6). (I) Assessment of IFN-γ in co-culture supernatants after splenocytes from C57BL/6 mice stimulated by M or rM-FC for 24 h in vitro (n = 6). (J) Luminescence was detected by the addition of d-luciferin to B16F10-Luc cells after incubation with splenocytes, M, and rM-FC for 24 h (n = 6). (K) Representative in vivo near-infrared imaging of tumor-bearing mice at 24, 48, 72, 168, and 360 h after intratumoral injection of 108 CFU rM-FC (n = 3). (L) Total radiant efficiency of the rM-FC signal in tumors in vivo or ex vivo over time (n = 3). (M) Total radiant efficiency of the rM-FC signal in tumor-draining lymph nodes (TDLNs) ex vivo over time (n = 3). For the experiments in (C), (D), and (G) to (J), the error bars represent mean ± standard error of the mean (SEM). P values were calculated by 2-tailed unpaired Student t tests. ns represents P > 0.05, * represents P < 0.05, ** represents P < 0.01, *** represents P < 0.001, and **** represents P < 0.0001. For the experiments in (L) and (M), the error bars represent mean ± SEM. ORI, origin of replication; KANA, kanamycin; LPS, lipopolysaccharides.
Fig. 3.
Fig. 3.
In situ vaccination inhibits established tumors. (A) Schematic diagram of intratumoral injection route of rM-FC in CT26 tumor-bearing mice. BALB/c mice were implanted with CT26 cells (1 × 10⁶) subcutaneously on the left lower sides of the abdomen on day 0 and received treatments on days 6, 8, and 10. When the tumor volume reached about 75 mm3, mice were randomly divided into 4 groups as follows: NS (normal saline), M (1 × 10⁸ CFU wild-type M. smegmatis), F+C (30 μg of Flt3L + 50 μg of CD40darpin), and rM-FC (1 × 10⁸ CFU). All drugs were dissolved in 100 μl of NS for intratumoral injection. (B) Average tumor-growth curves, (C) body weight, and (D) survival data of BALB/c mice bearing CT26 tumor with different treatments as indicated (n = 6). (E) Schematic diagram of intratumoral injection route of rM-FC in the B16F10 tumor suppression experiment. C57BL/6 mice were challenged with 1 × 10⁵ B16F10 tumor cells, and the dosing regimen was consistent with the above. (F) Average tumor-growth curves of C57BL/6 mice bearing B16F10 melanoma tumors with different treatments as indicated. (G) Representative photos of tumors harvested from C57BL/6 mice in all groups on the 10th day after treatments (n = 3). (H) Immunohistochemistry analysis of PDL1 expression in C57BL/6 treated tumors 10 d after treatments (n = 3). (I) Tumor-growth curves of each C57BL/6 mouse in different groups (n = 6). (J) Survival data of C57BL/6 mice in different groups for 60 d (n = 6). (K) Average body weight of C57BL/6 mice in different groups for 30 d (n = 6). The error bars represent mean ± SEM. For the experiments in (B) and (F), the error bars represent mean ± SEM. P values were calculated by 2-way analysis of variance (ANOVA) and Tukey posttest and correction. * represents P < 0.05, ** represents P < 0.01, and **** represents P < 0.0001. For the experiments in (D) and (K), the error bars represent mean ± SEM. Differences in survival were determined by using the Kaplan–Meier method, and the P value was calculated via the log-rank (Mantel–Cox) test. ** represents P < 0.01, and **** represents P < 0.0001.
Fig. 4.
Fig. 4.
Immune response induced by the rM-FC. B16F10 tumor-bearing mice were randomly divided into 4 groups and received the same treatment regimen as described above. Ten days after the last treatment, these mice were sacrificed with their tumors and TDLNs were collected to analyze the changes in immune cells by flow cytometry. Representative flow cytometry images of (A) mDCs (CD11c+CD80+CD86+, gated on CD11c+ cells) in TDLNs and (B) central memory T cell (TCM; CD3+CD8+CD44+CD62L+, gated on CD3+CD8+ cells) and effector memory T cells (TEM; CD3+CD8+CD44+CD62L, gated on CD3+CD8+ cells) in treated tumors. Percentage of (C) mDCs (gated on CD11c+ cells), (D) CD3+CD8+ cells (gated on CD3+ cells), and (E) CD11c+MHC II+ cells (gated on CD11c+ cells) in lymph nodes. Percentage of (F) TEM, (G) CD8+IFN-γ+ cells (gated on CD3+ cells), and (H) CD8+Granzyme B+ cells (gated on CD3+ cells) in tumors. Percentage of (I) CD11c+CD103+ cells (gated on CD11c+ cells) and (J) CD11c+CD40+ cells (gated on CD11c+ cells) in tumors. Percentage of (K) M1-like macrophages (gated on CD11b+F4/80+ macrophages in the tumor analyzed by flow cytometry after the last administration for 10 d (n = 6). For the experiments in (C) to (K), the error bars represent mean ± SEM. P values were calculated by 2-tailed unpaired Student t tests. ** represents P < 0.01, *** represents P < 0.001, and **** represents P < 0.0001.
Fig. 5.
Fig. 5.
Immune memory induced by intratumoral injection of rM-FC. (A) Representative flow cytometry images of TCM and TEM in spleens. Percentages of (B) TCM and (C) TEM in spleens (n = 6). (D) The cytotoxic effects of splenocytes on B16F10-luc cells (n = 6). Splenocytes of mice in the NS or rM-FC group were incubated with B16F10-luc tumor cells at effector-to-target ratios (E:T) of 5:1, 10:1, and 20:1. Luminescence was detected by the addition of d-luciferin to B16F10-luc after incubated with splenocytes for 24 h. Cytotoxicity % = luminescence of B16F10-luc tumor cells after incubation with splenocytes of mice for 24 h/initial luminescence of B16F10-luc tumor cells. (E) The concentration of IFN-γ secreted in the supernatant of splenocytes of mice at an E:T of 20:1 (n = 6). (F) Schematic illustration of the experimental schedule for evaluating the abscopal effect of rM-FC on distant tumors. Average tumor-growth curves of (G) the treated primary and (H) untreated distant tumors of B16F10 melanoma tumor-bearing mice post different treatments as indicated (n = 6). (I) Survival data of C57BL/6 mice in different groups for 60 d (n = 6). (J and K) Tumor-growth curves of each mouse following the treatment (n = 6). Percentages of (L) CD3+CD8+ cells, (M) TEM, and (N) CD8+IFN-γ+ cells (gated on CD3+ cells) in the untreated tumors (n = 6). For the experiments in (B) to (E) and (L) to (N), the error bars represent mean ± SEM. P values were calculated by 2-tailed unpaired Student t tests. * represents P < 0.05, ** represents P < 0.01, *** represents P < 0.001, and **** represents P < 0.0001. For the experiments in (G) and (H), the error bars represent mean ± SEM. P values were calculated by 2-way ANOVA and Tukey posttest and correction. **** represents P < 0.0001. Differences in survival were determined by using the Kaplan–Meier method, and the P value was calculated via the log-rank (Mantel–Cox) test. ** represents P < 0.01.
Fig. 6.
Fig. 6.
Combination therapy of rM-FC with anti-PDL1. The expression of (A) PD-1 on CD8+ tumor-infiltrating T lymphocytes (TILs) and (B) PDL1 on tumor cells of C57BL/6 mice in different groups after the last administration for 10 d (n = 6). (C) Representative flow cytometry images of PD-1 on CD8+ TILs and PDL1 on tumor cells of C57BL/6 mice in different groups after the last administration for 10 d. (D) Schematic diagram of the administration route for rM-FC combined with anti-PDL1 therapy. (E) Average tumor-growth curves of C57BL/6 mice bearing B16F10 melanoma tumor with different treatments as indicated (n = 6). (F) Survival data of C57BL/6 mice in different groups for 60 d (n = 6). (G) Schematic illustration of evaluating the immune memory effect of rM-FC on the rechallenged tumors. Mice cured of B16F10 tumors were rechallenged subcutaneously 90 d later with the same number of tumor cells (1 × 10⁵) at the side of the abdomen. (H) Tumor growth curves of each mouse following the rechallenge (n = 4). (I) Survival data of 2 groups of mice (n = 4). For the experiments in (A) and (B), the error bars represent mean ± SEM. P values were calculated by 2-tailed unpaired Student t tests. * represents P < 0.05, ** represents P < 0.01, and **** represents P < 0.0001. For the experiments in (E), the error bars represent mean ± SEM. P values were calculated by 2-way ANOVA and Tukey posttest and correction. * represents P < 0.05. Differences in survival were determined by using the Kaplan–Meier method, and the P value was calculated via the log-rank (Mantel–Cox) test. * represents P < 0.05 and ** represents P < 0.01.
Fig. 7.
Fig. 7.
Biosafety assessment of rM-FC. Blood biochemistry of the (A) liver function (alanine aminotransferase [ALT], aspartate aminotransferase [AST], and alkaline phosphatase [ALP]) and (B) kidney function (blood urea nitrogen [BUN] and creatinine [CREA]) analysis of B16F10 tumor-bearing mice intratumoral injection with 100 μl of NS, M (1 × 10⁸ CFU), F+C (30 μg of Flt3L + 50 μg of CD40darpin), and rM-FC (1 × 10⁸ CFU) (n = 3). The error bars represent mean ± SEM. P values were calculated by 2-tailed unpaired Student t tests. ns represents P > 0.05. (C) Hematoxylin–eosin staining of main organs, namely, the heart, liver, spleen, lung, and kidney, in B16F10 tumor-bearing mice. The scale bar is 200 μm.

Similar articles

References

    1. Arruebo M, Vilaboa N, Sáez-Gutierrez B, Lambea J, Tres A, Valladares M, González-Fernández Á. Assessment of the evolution of cancer treatment therapies. Cancers (Basel). 2011;3(3):3279–3330. - PMC - PubMed
    1. Mathis T, Jardel P, Loria O, Delaunay B, Nguyen A-M, Lanza F, Mosci C, Caujolle J-P, Kodjikian L, Thariat J. New concepts in the diagnosis and management of choroidal metastases. Prog Retin Eye Res. 2019;68:144–176. - PubMed
    1. Galon J, Bruni D. Approaches to treat immune hot, altered and cold tumours with combination immunotherapies. Nat Rev Drug Discov. 2019;18(3):197–218. - PubMed
    1. Riley RS, June CH, Langer R, Mitchell MJ. Delivery technologies for cancer immunotherapy. Nat Rev Drug Discov. 2019;18(3):175–196. - PMC - PubMed
    1. Tan S, Li D, Zhu X. Cancer immunotherapy: Pros, cons and beyond. Biomed Pharmacother. 2020;124: Article 109821. - PubMed

LinkOut - more resources