Prior thermal acclimation gives White Sturgeon a fin up dealing with low oxygen
- PMID: 39781189
- PMCID: PMC11704418
- DOI: 10.1093/conphys/coae089
Prior thermal acclimation gives White Sturgeon a fin up dealing with low oxygen
Abstract
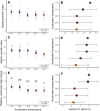
Assessing how at-risk species respond to co-occurring stressors is critical for predicting climate change vulnerability. In this study, we characterized how young-of-the-year White Sturgeon (Acipenser transmontanus) cope with warming and low oxygen (hypoxia) and investigated whether prior exposure to one stressor may improve the tolerance to a subsequent stressor through "cross-tolerance". Fish were acclimated to five temperatures within their natural range (14-22°C) for one month prior to assessment of thermal tolerance (critical thermal maxima, CTmax) and hypoxia tolerance (incipient lethal oxygen saturation, ILOS; tested at 20°C). White Sturgeon showed a high capacity for thermal acclimation, linearly increasing thermal tolerance with increasing acclimation temperature (slope = 0.55, adjusted R2 = 0.79), and an overall acclimation response ratio (ARR) of 0.58, from 14°C (CTmax = 29.4 ± 0.2°C, mean ± S.E.M.) to 22°C (CTmax = 34.1 ± 0.2°C). Acute warming most negatively impacted hypoxia tolerance in 14°C-acclimated fish (ILOS = 15.79 ± 0.74% air saturation), but prior acclimation to 20°C conferred the greatest hypoxia tolerance at this temperature (ILOS = 2.60 ± 1.74% air saturation). Interestingly, individuals that had been previously tested for thermal tolerance had lower hypoxia tolerance than naïve fish that had no prior testing. This was particularly apparent for hypoxia-tolerant 20°C-acclimated fish, whereas naïve fish persisted the entire 15-h duration of the hypoxia trial and did not lose equilibrium at air saturation levels below 20%. Warm-acclimated fish demonstrated significantly smaller relative ventricular mass, indicating potential changes to tissue oxygen delivery, but no other changes to red blood cell characteristics and somatic indices. These data suggest young-of-the-year White Sturgeon are resilient to warming and hypoxia, but the order in which these stressors are experienced and whether exposures are acute or chronic may have important effects on phenotype.
Keywords: fish; global climate change; hypoxia; multiple stressors; temperature; tolerance.
© The Author(s) 2025. Published by Oxford University Press and the Society for Experimental Biology.
Conflict of interest statement
The authors declare no competing interests that could influence the work reported in this study.
Figures


References
-
- Anttila K, Dhillon RS, Boulding EG, Farrell AP, Glebe BD, Elliott JA, Wolters WR, Schulte PM (2013) Variation in temperature tolerance among families of Atlantic salmon (Salmo salar) is associated with hypoxia tolerance, ventricle size and myoglobin level. Journal of Experimental Biology 216: 1183–1190. 10.1242/jeb.080556. - DOI - PubMed
-
- Baker D.W. and Brauner, C.J. (2012). Metabolic changes associated with acid–base regulation during hypercarbia in the CO2-tolerant chondrostean, white sturgeon (Acipenser transmontanus). Comparative Biochemistry and Physiology Part A: Molecular & Integrative Physiology, 161(1), 61-68, 10.1016/j.cbpa.2011.09.002. - DOI - PubMed
-
- Beitinger T. L., Bennett, W. A., & McCauley, R. W. (2000). Temperature tolerances of north American freshwater fishes exposed to dynamic changes in temperature. Environmental Biology of Fishes, 58(3), 237–275, 10.1023/A:1007676325825. - DOI
-
- Black E.A., Whyth, J.N.C., Bagshaw, J.W. & Ginther, N.G. (1991). The effects of Heterosigma akashiwo on juvenile Oncorhynchus tshawytscha and its implications for fish culture. Journal of Applied Ichthyology, 7(3), pp.168-175, 10.1111/j.1439-0426.1991.tb00523.x. - DOI

