. 2025 Jan 1;16(3):750-764.
doi: 10.7150/jca.101050. eCollection 2025.

HIF-1α Mediated Regulation of Glioblastoma Malignant Phenotypes through CD47 Protein: Understanding Functions and Mechanisms

Affiliations

HIF-1α Mediated Regulation of Glioblastoma Malignant Phenotypes through CD47 Protein: Understanding Functions and Mechanisms

Qijia Tan et al. J Cancer. .

Abstract

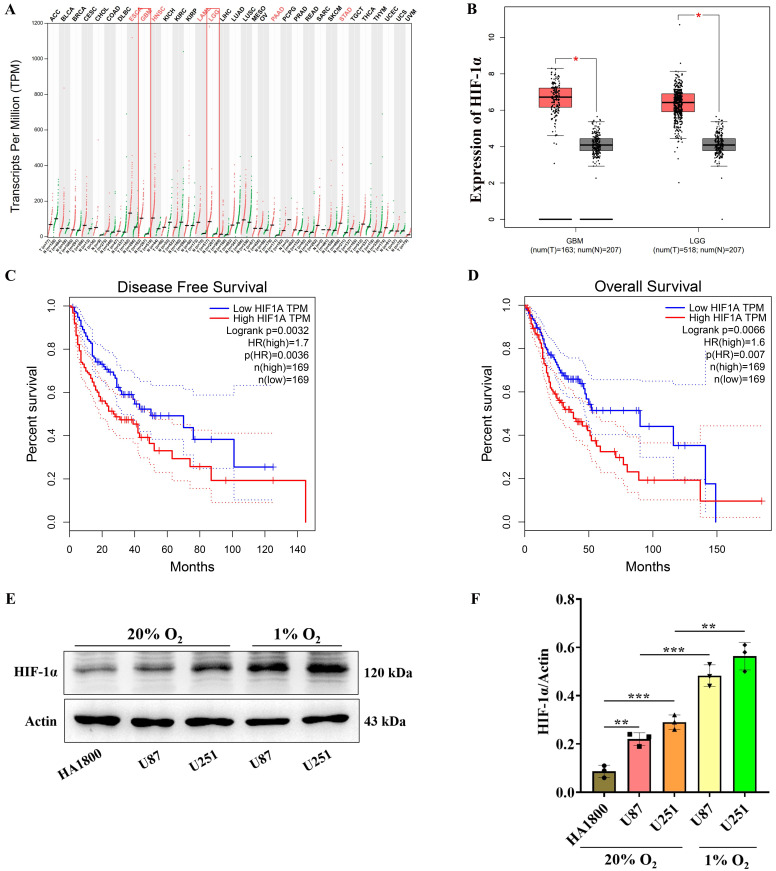
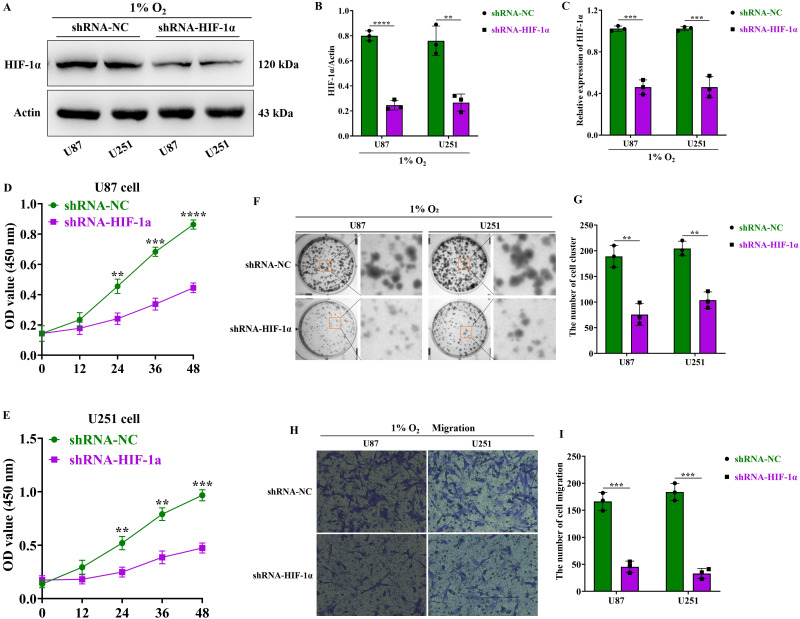
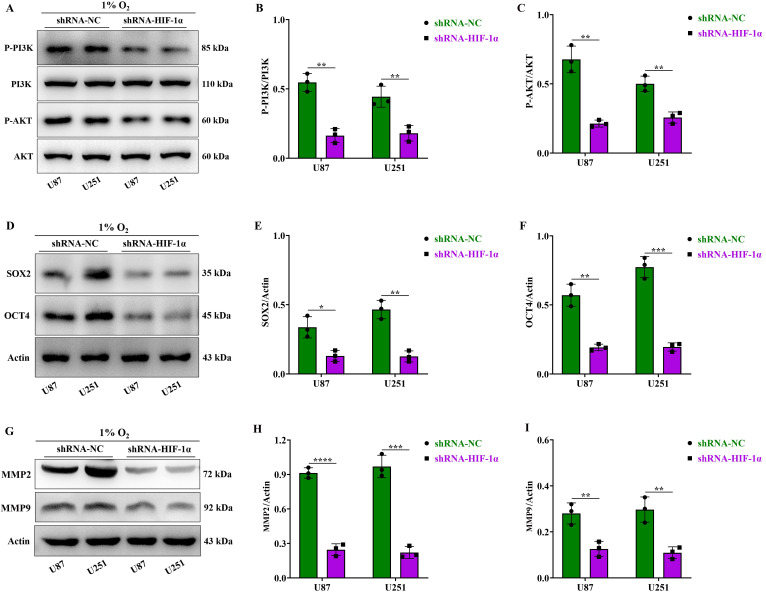
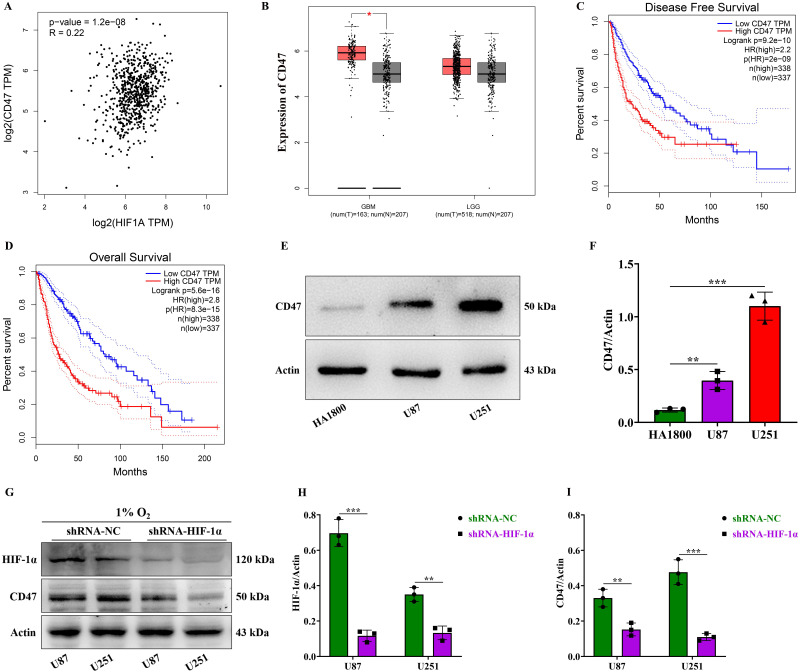
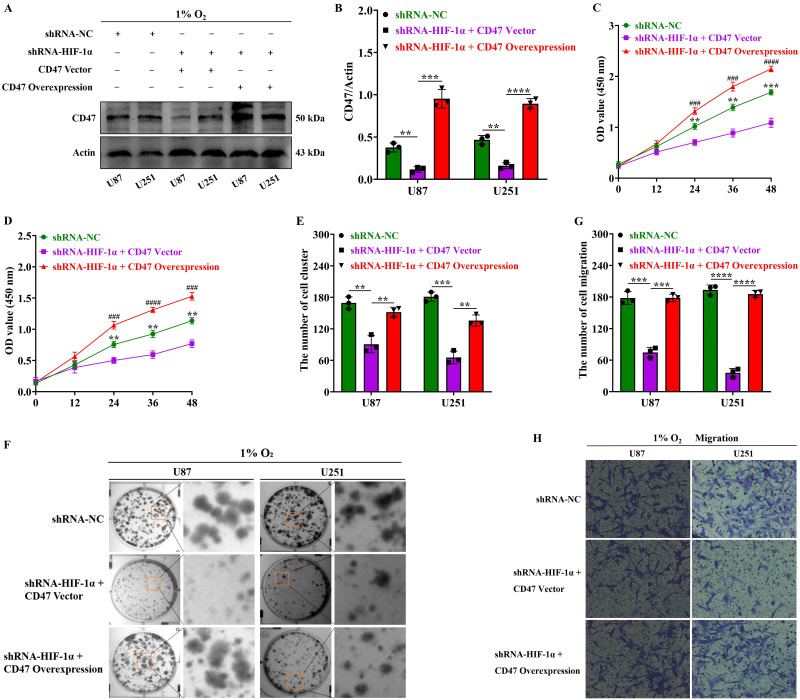
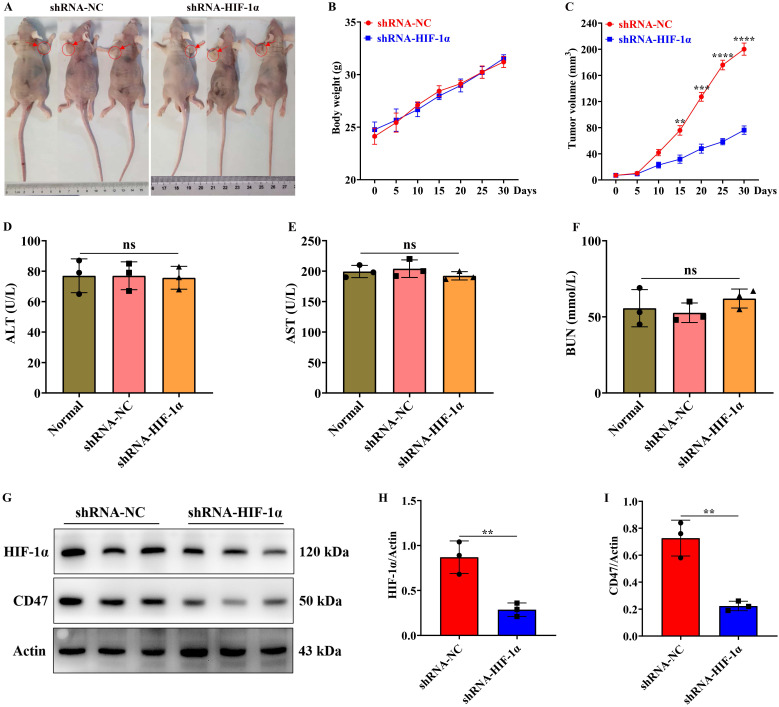
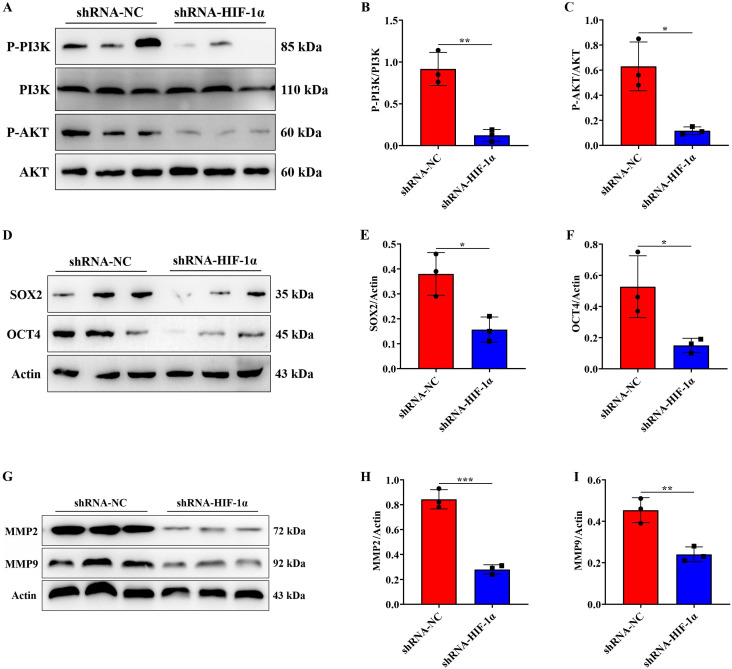
Glioblastoma (GBM) is a highly invasive and malignant primary intracranial tumor originating from glial cells, and it is associated with an extremely poor clinical prognosis. The hypoxic conditions within GBM promote various tumor cell processes such as angiogenesis, proliferation, migration, invasion, and drug resistance. A key aspect of tumor adaptation to the hypoxic environment and the promotion of malignant behaviors is the regulation of HIF-1α signaling pathways. However, the specific pathogenic mechanisms involving HIF-1α in GBM have not been thoroughly investigated. This study reveals significant overexpression of both HIF-1α and CD47 in GBM. Patients with high HIF-1α levels and CD47 expression had significantly reduced overall survival and disease-free survival times. Furthermore, a positive correlation was observed between the expression levels of HIF-1α and CD47 in GBM. Lentivirus-mediated knockdown of HIF-1α protein and plasmid-based overexpression of CD47 protein simultaneously enhanced cell proliferation, clonogenic potential and cell migration abilities in GBM, and HIF-1α was found to regulate key pathways, including the P-PI3K/P-AKT, SOX2/OCT4 and MMP2/MMP9 pathways, in GBM.

Keywords: CD47; HIF-1α; glioblastoma; migration; proliferation.


Conflict of interest statement

Competing Interests: The authors have declared that no competing interest exists.

Figures

Figure 1
Figure 1
HIF-1α is highly expressed in GBM. (A) Expression levels of HIF-1α gene across various tumor types; (B) Expression levels of HIF-1α gene in low-grade and high-grade gliomas. (C) Analysis of disease-free survival time in patients with varying HIF-1α gene expression levels; (D) Analysis of overall survival time in patients with varying HIF-1α gene expression levels. (E) Western blot analysis showing HIF-1α protein expression levels in glioblastoma; (F) Graphical representation of statistical analysis for HIF-1α protein expression levels. Data are presented as mean ± standard deviation, and unpaired t-test was used to compare differences between two groups. *P <0.05, **P <0.01, ***P <0.001.
Figure 2
Figure 2
HIF-1α promotes the malignant progression of GBM. (A) Western blot analysis of HIF-1α protein expression levels in GBM; (B) Graphical representation of HIF-1α protein expression levels; (C) Real-time quantitative PCR assessing HIF-1α mRNA expression in GBM. (D) CCK8 assay to measure U87 cell proliferation following HIF-1α knockdown; (E) CCK8 assay to measure U251 cell proliferation following HIF-1α knockdown. (F) Clonogenic assay to assess the colony-forming ability of U87 and U251 cells after HIF-1α knockdown; (G) Statistical analysis of the number of colonies formed. (H) Cell migration assay to evaluate U87 and U251 cell migration post-HIF-1α knockdown; (I) Statistical analysis of migrated cell numbers. Data are presented as mean ± standard deviation, and differences between two groups were analyzed using an unpaired t-test. **P <0.01, ***P <0.001, ****P <0.0001.
Figure 3
Figure 3
HIF-1α activates the P-PI3K/P-AKT, SOX2/OCT4 and MMP2/MMP9 signaling pathways in GBM. (A) Western blot analysis of P-PI3K, PI3K, P-AKT, and AKT protein expression in GBM; (B) Expression levels of P-PI3K and PI3K proteins graphed; (C) Expression levels of P-AKT and AKT proteins graphed; (D) Western blot analysis of SOX2 and OCT4 protein expression in GBM; (E) Expression levels of SOX2 protein graphed; (F) Expression levels of OCT4 protein graphed; (G) Western blot analysis of MMP2 and MMP9 protein expression in GBM; (H) Expression levels of MMP2 protein graphed; (I) Expression levels of MMP9 protein graphed. Data are presented as mean ± standard deviation, and differences between two groups were analyzed using an unpaired t-test. *P <0.05, **P <0.01, ***P <0.001, ****P <0.0001.
Figure 4
Figure 4
HIF-1α is positively correlated with CD47 expression and promotes the high expression of CD47 in GBM. (A) Pearson correlation analysis between HIF-1α and CD47 gene expression levels; (B) GEPIA database visualization of CD47 gene expression in gliomas; (C) Disease-free survival analysis for patients with differing CD47 gene expression levels; (D) Overall survival analysis for patients with differing CD47 gene expression levels; (E) Western blot of CD47 protein expression in GBM; (F) CD47 protein expression levels graphed; (G) Western blot of HIF-1α and CD47 proteins in GBM; (H) HIF-1α protein expression levels graphed; (I) CD47 protein expression levels graphed. Data are shown as mean ± standard deviation, and differences were assessed with an unpaired t-test. **P <0.01, ***P <0.001.
Figure 5
Figure 5
Upregulation of CD47 promotes malignant traits in GBM via HIF-1α. (A) Western blot showing CD47 protein expression in GBM; (B) Quantification of CD47 protein expression levels; (C) CCK8 assay assessing U87 cell proliferation after HIF-1α knockdown and CD47 overexpression; (D) CCK8 assay evaluating U251 cell proliferation after HIF-1α knockdown and CD47 overexpression. (E) Quantification of U87 and U251 cell colony formation; (F) Clonogenic assay measuring colony formation after HIF-1α knockdown and CD47 overexpression; (G) Cell migration assay assessing U87 and U251 cell migration after HIF-1α knockdown and CD47 overexpression; (H) Quantification of U87 and U251 cell migration. Data are presented as mean ± standard deviation, and differences were analyzed using an unpaired t-test. NS indicates no statistical significance, **P < 0.01, ***P < 0.001, ###P < 0.001, ####P < 0.0001.* indicates comparison between shRNA-HIF-1α + CD47 Vector and shRNA-NC; # indicates comparison between shRNA-HIF-1α + CD47 overexpression group and shRNA-HIF-1α + CD47 Vector group.
Figure 6
Figure 6
Knockdown of HIF-1α expression inhibits subcutaneous tumor formation. (A) Imaging of subcutaneous tumors in nude mice; (B) Changes in body weight of nude mice after subcutaneous tumor formation; (C) Changes in subcutaneous tumor volume; (D) Detection of ALT content in serum of nude mice after subcutaneous tumor formation; (E) Detection of AST content in serum of nude mice after subcutaneous tumor formation; (F) Detection of BUN content in serum of nude mice after subcutaneous tumor formation; (G) Immunoblotting showing HIF-1α and CD47 protein expression levels in subcutaneous tumor tissue; (H) Quantification of HIF-1α protein expression level; (I) Quantification of CD47 protein expression level. Data are presented as mean ± standard deviation, and differences between the two groups were analyzed using an unpaired t-test. **P <0.01, ***P <0.001, ****P <0.0001.
Figure 7
Figure 7
Knockdown of HIF-1α expression can inhibit the P-PI3K/P-AKT, SOX2/OCT4 and MMP2/MMP9 signaling pathway in vivo. (A) Immunoblotting showing P-PI3K, PI3K, P-AKT, and AKT protein expression levels in tumor tissue; (B) Quantification of P-PI3K protein expression level; (C) Quantification of P-AKT protein expression level; (D) Immunoblotting showing SOX2/OCT4 protein expression levels in tumor tissue; (E) Quantification of SOX2 protein expression level; (F) Quantification of OCT4 protein expression level. (G) Immunoblotting showing MMP2/MMP9 protein expression levels in tumor tissue; (H) Quantification of MMP2 protein expression level; (I) Quantification of MMP9 protein expression level. Data are presented as mean ± standard deviation, and differences between the two groups were analyzed using an unpaired t-test. *P <0.05, **P <0.01, ***P <0.001.

Similar articles

References

    1. Yang K, Wu Z, Zhang H. et al. Glioma targeted therapy: insight into future of molecular approaches. Mol Cancer. 2022 Feb 8;21(1):39. - PMC - PubMed
    1. Arrieta VA, Dmello C, McGrail DJ. et al. Immune checkpoint blockade in glioblastoma: from tumor heterogeneity to personalized treatment. J Clin Invest. 2023 Jan 17;133(2):e163447. - PMC - PubMed
    1. Hatfield SM, Sitkovsky MV. Antihypoxic oxygenation agents with respiratory hyperoxia to improve cancer immunotherapy. J Clin Invest. 2020 Nov 2;130(11):5629–5637. - PMC - PubMed
    1. Cowman SJ, Koh MY. Revisiting the HIF switch in the tumor and its immune microenvironment. Trends Cancer. 2022 Jan;8(1):28–42. - PMC - PubMed
    1. Yu L, Shueng P, Chiu H. et al. Glucose Transporter 1-Mediated Transcytosis of Glucosamine-Labeled Liposomal Ceramide Targets Hypoxia Niches and Cancer Stem Cells to Enhance Therapeutic Efficacy. ACS Nano. 2023 Jul 25;17(14):13158–13175. - PubMed