. 2025 Jan 1;21(2):614-631.
doi: 10.7150/ijbs.103032. eCollection 2025.

HIF-2α/LPCAT1 orchestrates the reprogramming of lipid metabolism in ccRCC by modulating the FBXW7-mediated ubiquitination of ACLY

Affiliations

HIF-2α/LPCAT1 orchestrates the reprogramming of lipid metabolism in ccRCC by modulating the FBXW7-mediated ubiquitination of ACLY

Mintian Fei et al. Int J Biol Sci. .

Abstract

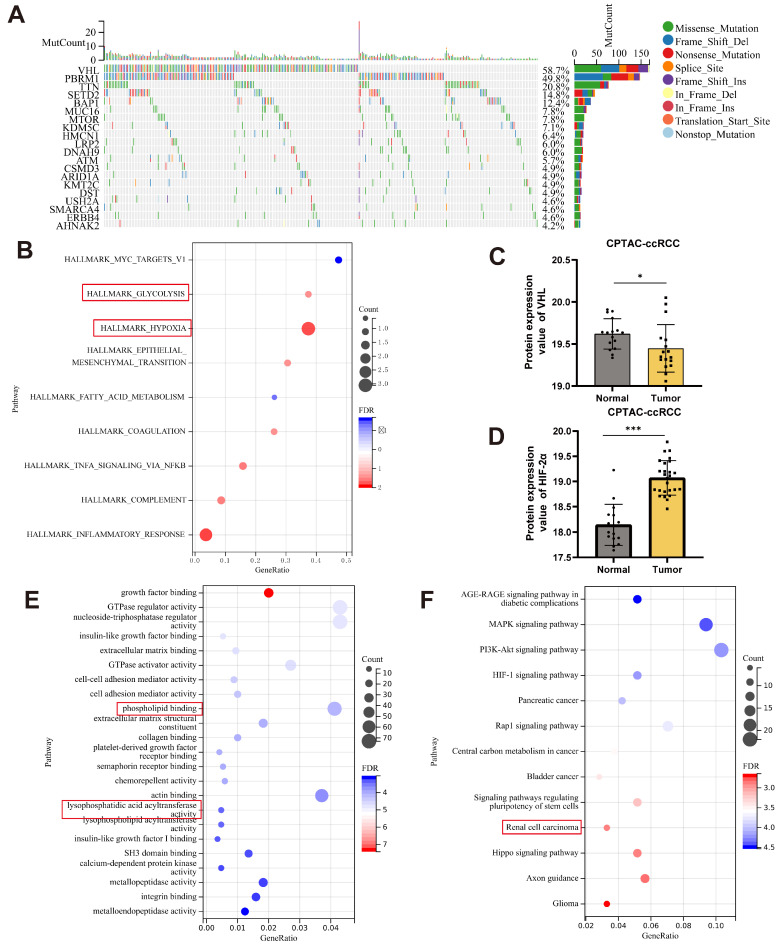
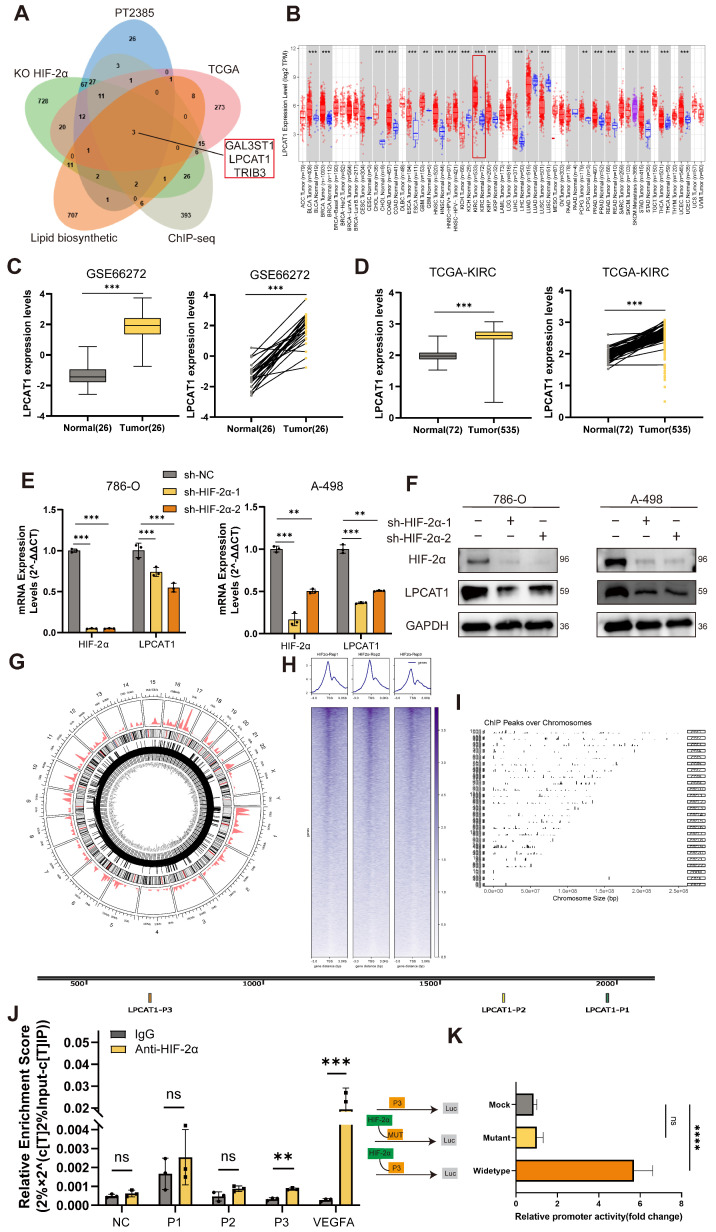
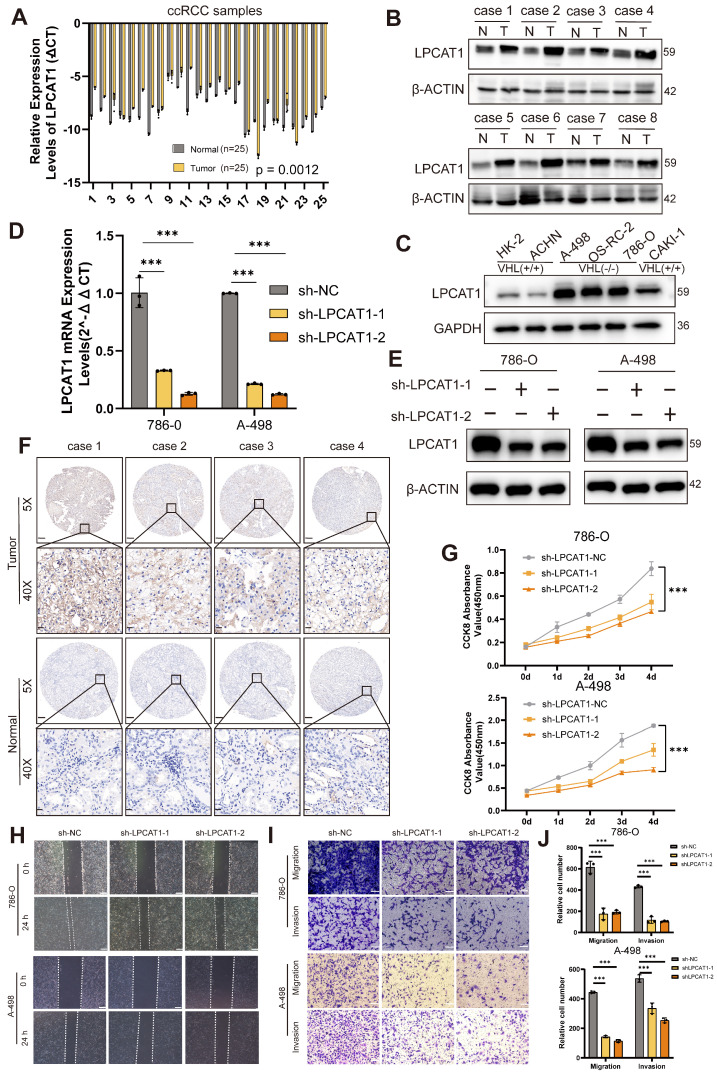
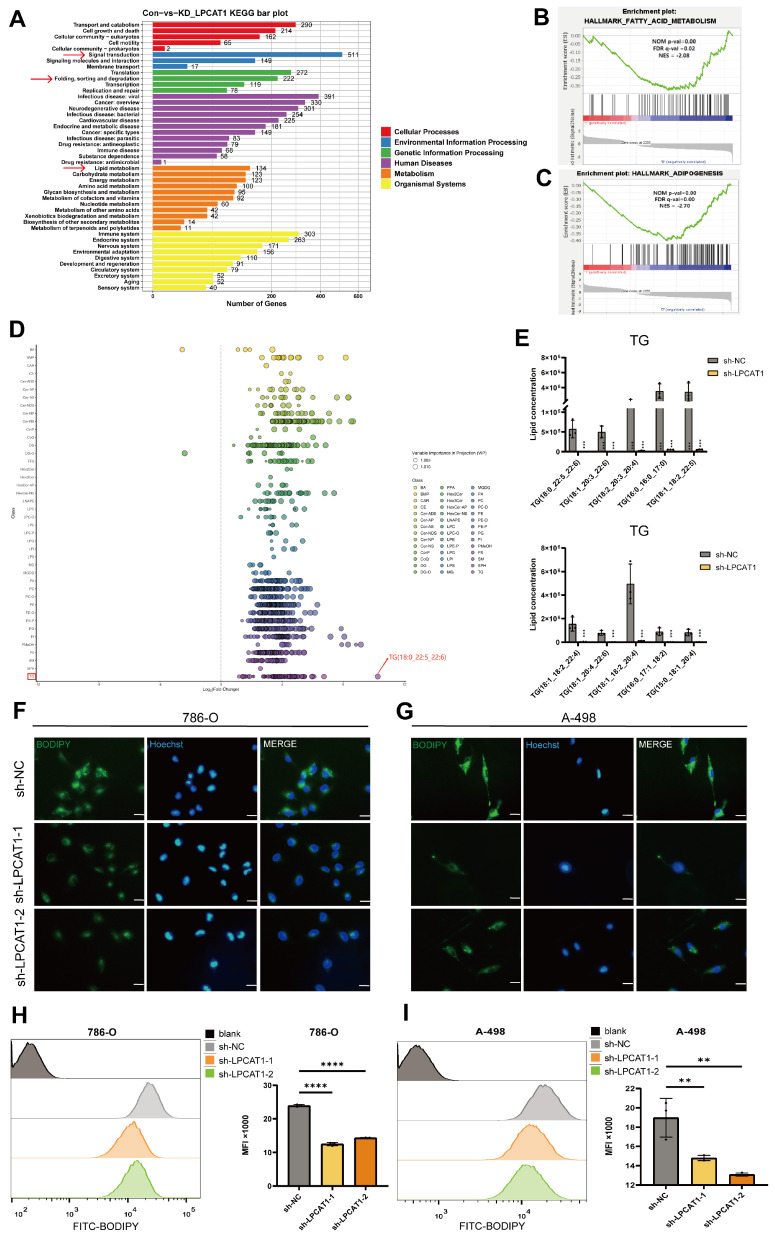
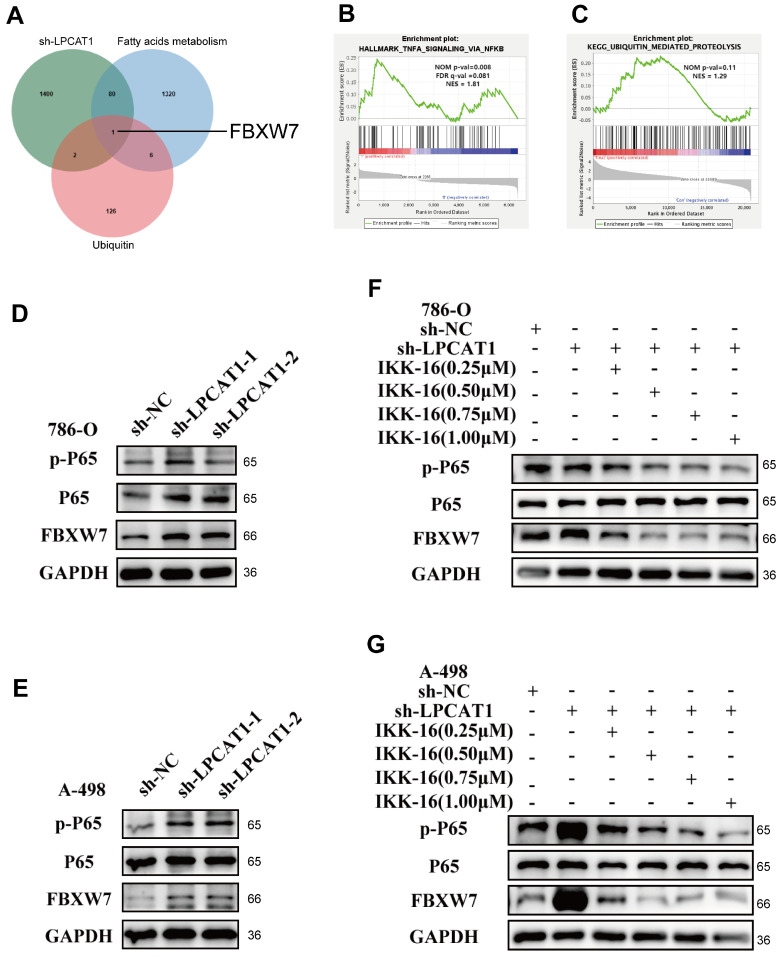
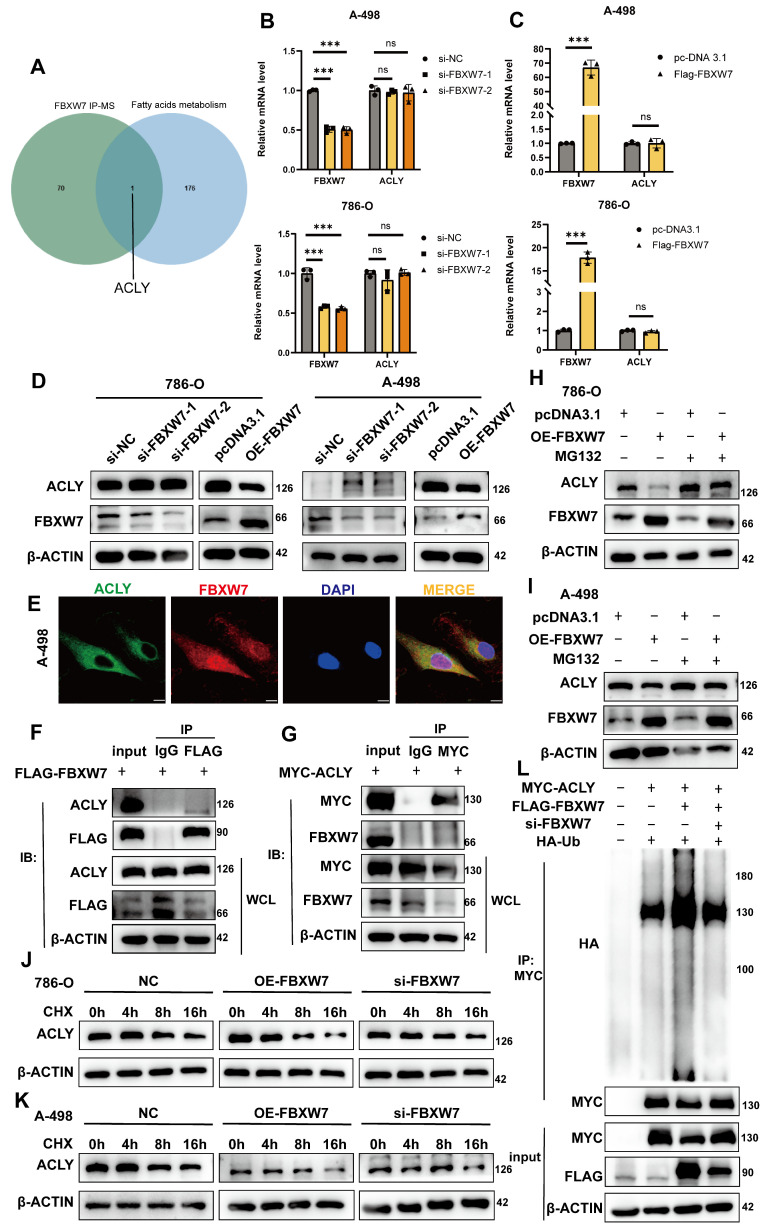
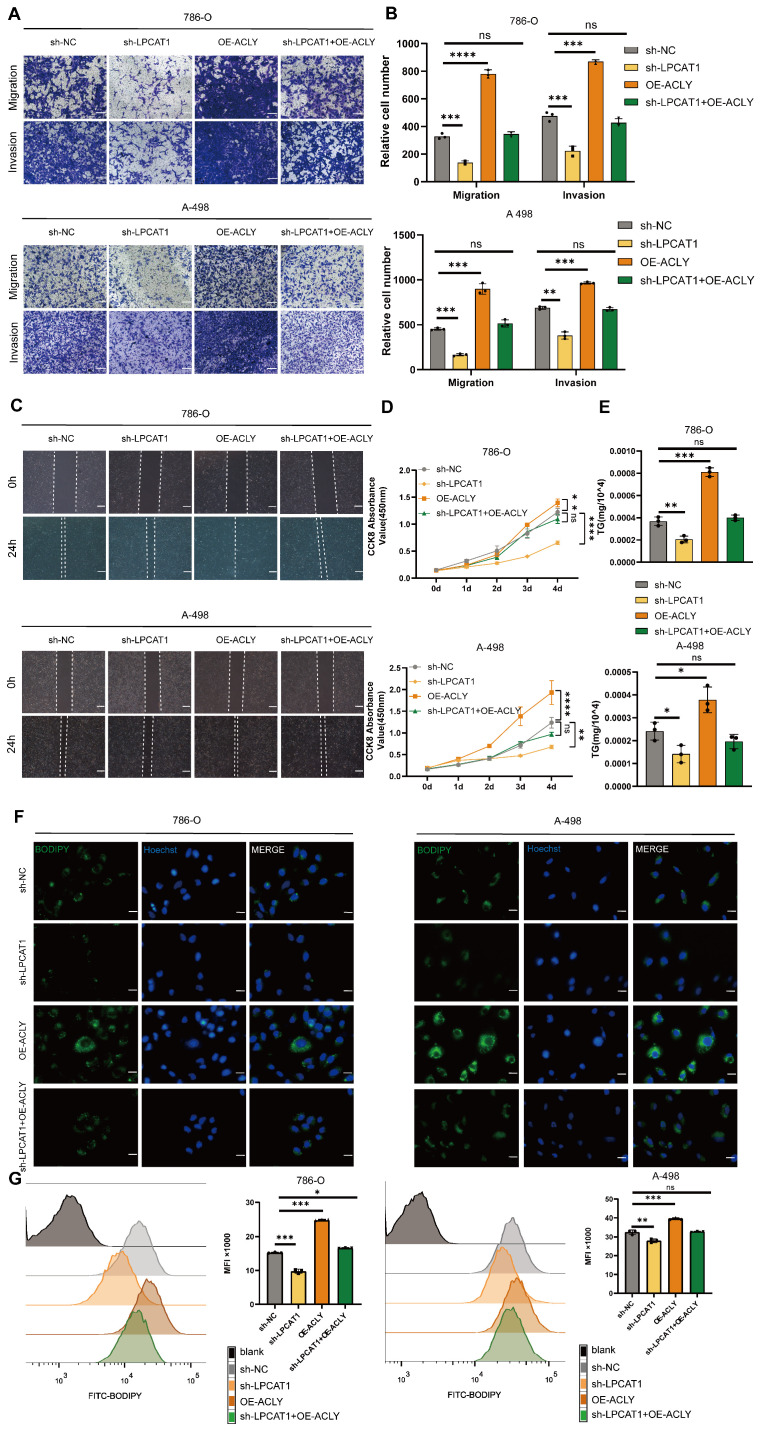
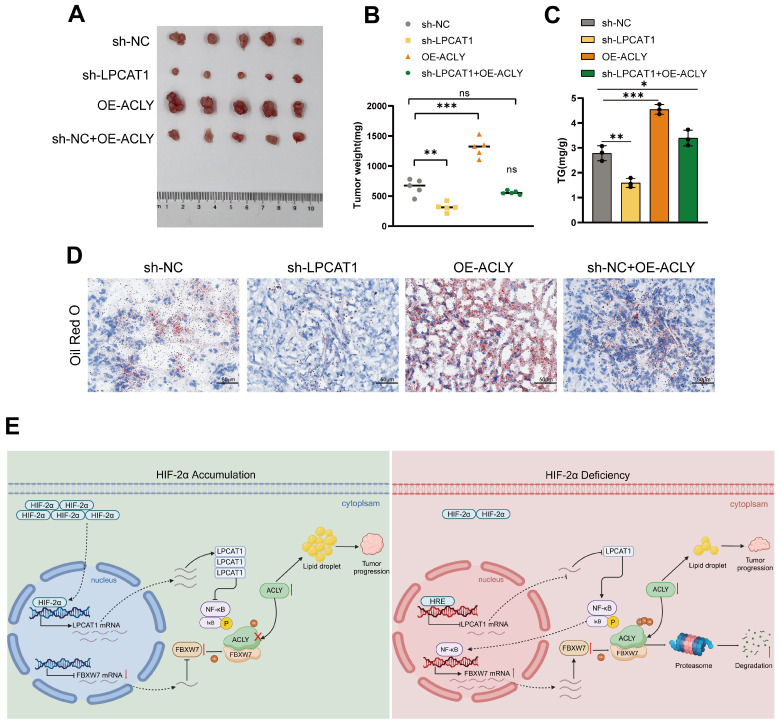
The current research revealed a strong link between lipid reprogramming and dysregulated lipid metabolism to the genesis and development of clear cell renal cell carcinoma (ccRCC). Pathologically, ccRCC exhibits a high concentration of lipid droplets within the cytoplasm. HIF-2α expression has previously been demonstrated to be elevated in ccRCC caused by mutations in the von Hippel-Lindau (VHL) gene, which plays a vital role in the development of renal cell carcinoma. Nevertheless, the mechanisms by which HIF-2α influences lipid metabolism reprogramming are unknown. Our investigation demonstrated that HIF-2α directly binds to the promoter region of LPCAT1, promoting its transcription. RNA-seq and lipidomics mass spectrometry studies showed that knocking down LPCAT1 significantly reduced triglyceride production. Research suggests that KD-LPCAT1 involves activation of the NF-κB signaling pathway, which activates F-Box/WD Repeat-Containing Protein 7 (FBXW7). FBXW7, an E3 ubiquitin ligase involved in lipid metabolism, interacts with ATP Citrate Lyase (ACLY) to promote its degradation, lowering fatty acid production and contributing to the lipid content reduction.

Keywords: FBXW7; HIF-2α; LPCAT1; Lipid Metabolism and Ubiquitination; ccRCC.


Conflict of interest statement

Competing Interests: The authors have declared that no competing interest exists.

Figures

Figure 1
Figure 1
VHL-HIF-2α axis can regulate lipid metabolism in ccRCC. A. The waterfall plot of mutated genes in ccRCC analyzed from the TCGA database, generated using the Sangerbox online platform B. Pathway enrichment analysis of the VHL mutant gene set. C, D. Analysis of VHL and HIF-2α gene expression levels in the ccRCC dataset from the CPTAC database. E. GO enrichment analysis using RNA-seq data from KO-HIF-2α. F. KEGG pathway enrichment analysis for PT2385.
Figure 2
Figure 2
HIF-2a transcriptionally regulates LPCAT1. A. Venn diagram was drawn using four independent datasets, including KO-HIF-2α, PT2385, TCGA, ChIP-seq, Lipid biosynthetic to show downregulated differentially expressed genes, including LPCAT1 and TRIB3. B. Pan-cancer analysis of the TCGA dataset and differential expression of LPCAT1 in tumor and normal tissues. C, D. GEO and TCGA datasets analysis the LPCAT1 expression leves in tumor and normal. E. qRT-PCR shows the changes in mRNA levels of HIF-2α and LPCAT1 after knockdown of HIF-2α. F. Western blot verifies the effect of HIF-2α knockdown and shows the changes in LPCAT1 protein levels. G. The circos plot displays the chromatin regions where HIF-2α may bind and the binding intensity. H. Reads distribution around the transcription start site (TSS). I. Chromosomes of ChIP peaks by ChIP-seq using the HIF-2α antibody (GSE183900). J. Chromatin immunoprecipitation (ChIP) was performed using an antibody against HIF-2α with chromatin extracted from 786-O cells. Prior to immunoprecipitation, 2% of the cell lysate was collected as input then IgG as a negative control. After purification, qRT-PCR and PCR were performed using primers designed based on the predicted three potential HIF-2α binding sites. The experiments were independently repeated three times. K. Based on the sequence of the P3 site, an overexpression plasmid for the P3 site and a mutant plasmid for P3, along with an HIF-2α plasmid, were designed. Incubated 293-T cells for 24 hours with the transfected plasmids. Then, the activity of LPCAT1 was detected using a dual-luciferase reporter assay kit. (Mock: transfected with P3 plasmid, Mutant: transfected with HIF-2α plasmid + P3 mutant plasmid, Wildtype: transfected with HIF-2α + P3 plasmid).
Figure 3
Figure 3
LPCAT1 promoted the progression of ccRCC. A. qRT-PCR analysis of LPCAT1 mRNA levels in tumor tissues compared to adjacent normal tissues. B. Western blot assay of LPCAT1 protein levels in renal cell carcinoma compared to adjacent normal tissues. C. Western blot assay of LPCAT1 expression in RCC cell lines, with HK-2 as a normal cell reference. D. qRT-PCR shows the changes in mRNA expression levels in A-498 and 786-O cells after knockdown of LPCAT1 using sh-RNA. E. Western blot assay the changes in LPCAT1 protein levels in A-498 and 786-O cells after knockdown of LPCAT1 using sh-RNA. F. Immunohistochemical analysis of LPCAT1 in ccRCC samples and corresponding adjacent normal tissues. (Scale: 200μm, magnified view: 20μm). G. CCK-8 assay shows that the proliferation rate of ccRCC cells significantly slows down after knockdown of LPCAT1 (n=3). H. The wound healing assay shows that the migration ability of A-498 and 786-O cells is reduced 24 hours after knockdown of LPCAT1. I. Transwell assay shows that the migration and invasion abilities of renal cancer cells are weakened after knockdown of LPCAT1 (scale=100μm). J. Counting cells in transwells.
Figure 4
Figure 4
LPCAT1 promotes lipid accumulation in ccRCC by regulating triglyceride metabolism. A. Transcriptomic analysis of differentially expressed genes identified by KEGG enrichment analysis after knockdown of LPCAT1 results, with sh-NC as the control. B, C. GSEA enrichment results based on transcriptomic differentially expressed genes. D. Lipidomic analysis of sh-LPCAT1 compared to sh-NC showing changes in fatty acids (FA), glycerolipids (GL), glycerophospholipids (GP), sphingolipids (SP), and sterols (ST) isoprenoids (PR). E. The ten most significantly altered TG components in the LC/MS results. F, G. Cells were treated with 2μM bodipy 493/503 for 15 minutes, followed by 10μg/ml Hoechst 33342 to stain the nuclei for 5 minutes, and photographed under a fluorescence microscope (scale=20μm). H, I. Cells were treated with 2μM BODIPY493/503 for 15 minutes, then digested with trypsin and analyzed by flow cytometry.
Figure 5
Figure 5
LPCAT1 can influence the expression of FBXW7 by regulating the NF-κB signaling pathway. A. Venn diagram of upregulated genes from the differentially expressed genes in sh-LPCAT1 and the gene sets of fatty acids and ubiquitin from GSEA. B, C. Analysis of differentially expressed genes from transcriptomic sequencing of sh-LPCAT1 shows that the NF-κB signaling pathway and the process of ubiquitination are enhanced after LPCAT1 knockdown. D, E. Verification of the expression of the NF-κB signaling pathway and FBXW7 in786-O and A-498, after LPCAT1 knockdown. F, G. Treatment of 786-O and A-498 cells with 0.25μM, 0.50μM, 0.75μM, and 1.00μM of the NF-κB signaling pathway inhibitor IKK-16 to verify the changes in FBXW7 protein expression when the NF-κB signaling pathway is inhibited.
Figure 6
Figure 6
FBXW7 can promote the degradation of ACLY. A. Venn diagram analysis of differential proteins from FBXW7 IP-MS and the gene set of fatty acid metabolism pathways. B. qRT-PCR detection of changes in mRNA levels of FBXW7 and ACLY in 786-O and A-498 cells after FBXW7 knockdown using si-RNA. C. qRT-PCR detection of changes in mRNA levels of FBXW7 and ACLY in 786-O and A-498 cells after FBXW7 overexpression. D. Western blot assay detection of changes in ACLY expression in 786-O and A-498 cells after FBXW7 knockdown/overexpression. E. Confocal microscopy observation of A-498 cells stained with FLAG and MYC antibodies. Green: MYC-ACLY, Red: FLAG-FBXW7, Blue: DAPI. (scale=10μm). F. FLAG-FBXW7 was transfected into 293-T cells for 48 hours, and cell lysates were collected after 48 hours. Using IgG and FLAG antibodies, immunoprecipitation and Western blotting were conducted. G. MYC-ACLY were transfected into 293-T cells for 48 hours, and cell lysates were collected. Immunoprecipitation was performed with IgG and MYC antibodies followed by Western blot analysis. H, I. Western blot assay of 786-O and A-498 cells with/without MG-132 treatment for 24 hours after different transfection treatments. J, K. 786-O and A-498 cells were transfected with FLAG-FBXW7/si-FBXW7 and treated with Cycloheximide for 0h, 4h, 8h, and 16h, followed by collection of cell lysates and Western blot analysis to observe changes in ACLY expression. L. 293-T cells were transfected with/without MYC-ACLY, FLAG-FBXW7, si-FBXW7, HA-Ub for 48 hours, and cell lysates were collected. Immunoprecipitation was performed with MYC antibodies to observe the degradation of ACLY.
Figure 7
Figure 7
Increased expression of ACLY can counteract the effects of sh-LPCAT1 on ccRCC. A, B. Transwell assay was used to verify changes in the proliferation and migration abilities of transfected cells, and ImageJ was used to quantify the migrating cells (scale bar:100μm). C. Wound healing assay was measured to verify the cells' migration ability, and the wound healing status was observed after 24 hours. D. The growth curve drawn using the CCK-8 assay shows that the slowed cell proliferation caused by LPCAT1 knockdown can be alleviated by increased expression of ACLY. E. The triglyceride content in transfected cells was measured using a micro-TG assay kit. F. BODIPY 493/593 was used to detect changes in neutral lipids in transfected cells. Green indicates lipid droplets. Images were taken using an Olympus microscope(scale=20μm). G. Flow cytometry was used to quantitatively analyze changes in lipid droplet content in different transfected cell lines, using cells without BODIPY 493/503 as a blank control.
Figure 8
Figure 8
The inhibition of tumor growth and reduction in lipid accumulation caused by LPCAT1 knockdown can be reversed by the overexpression of ACLY. A. The transfected 786-O cells (including: sh-NC, sh-LPCAT1, and sh-LPCAT1+OE-ACLY) were transplanted subcutaneously into nude mice. Subcutaneous tumors were collected after 4 weeks (n=5). B. The subcutaneous tumors were weighed. C. The TG content in subcutaneous tumors was measured. D. Lipid droplets content in subcutaneous tumor samples was detected using Oil Red O staining (scale=50μm). E. A schematic diagram describes the proposed model of how HIF-2α-dependent LPCAT1 expression regulates ccRCC progression and lipid accumulation.

References

    1. Sung H, Ferlay J, Siegel RL, Laversanne M, Soerjomataram I, Jemal A. et al. Global Cancer Statistics 2020: GLOBOCAN Estimates of Incidence and Mortality Worldwide for 36 Cancers in 185 Countries. CA Cancer J Clin. 2021 May;71(3):209–49. - PubMed
    1. Lopez-Beltran A, Scarpelli M, Montironi R, Kirkali Z. 2004 WHO classification of the renal tumors of the adults. Eur Urol. 2006 May;49(5):798–805. - PubMed
    1. Escudier B, Porta C, Schmidinger M, Rioux-Leclercq N, Bex A, Khoo V. et al. Renal cell carcinoma: ESMO Clinical Practice Guidelines for diagnosis, treatment and follow-up†. Ann Oncol. 2019 May 1;30(5):706–20. - PubMed
    1. Ericsson JL, Seljelid R, Orrenius S. Comparative light and electron microscopic observations of the cytoplasmic matrix in renal carcinomas. Virchows Arch Pathol Anat Physiol Klin Med. 1966 Oct 10;341(3):204–23. - PubMed
    1. Du W, Zhang L, Brett-Morris A, Aguila B, Kerner J, Hoppel CL. et al. HIF drives lipid deposition and cancer in ccRCC via repression of fatty acid metabolism. Nat Commun. 2017 Nov 24;8:1769. - PMC - PubMed

MeSH terms

Substances

LinkOut - more resources