

Severe intensive care unit-acquired hypernatraemia: Prevalence, risk factors, trajectory, management, and outcome
- PMID: 39781493
- PMCID: PMC11704420
- DOI: 10.1016/j.ccrj.2024.09.004
Severe intensive care unit-acquired hypernatraemia: Prevalence, risk factors, trajectory, management, and outcome
Abstract
Background: Severe intensive care unit-acquired hypernatraemia (ICU-AH) is a serious complication of critical illness. However, there is no detailed information on how this condition develops.
Objectives: The objective of this study was to study the prevalence, risk factors, trajectory, management, and outcome of severe ICU-AH (≥155 mmol·L-1).
Methods: A retrospective study was conducted in a 40-bed ICU in a university-affiliated hospital. Assessment of sodium levels, factors associated with severe ICU-AH, urinary electrolyte measurements, water therapy, fluid balance, correction rate, and delirium was made.
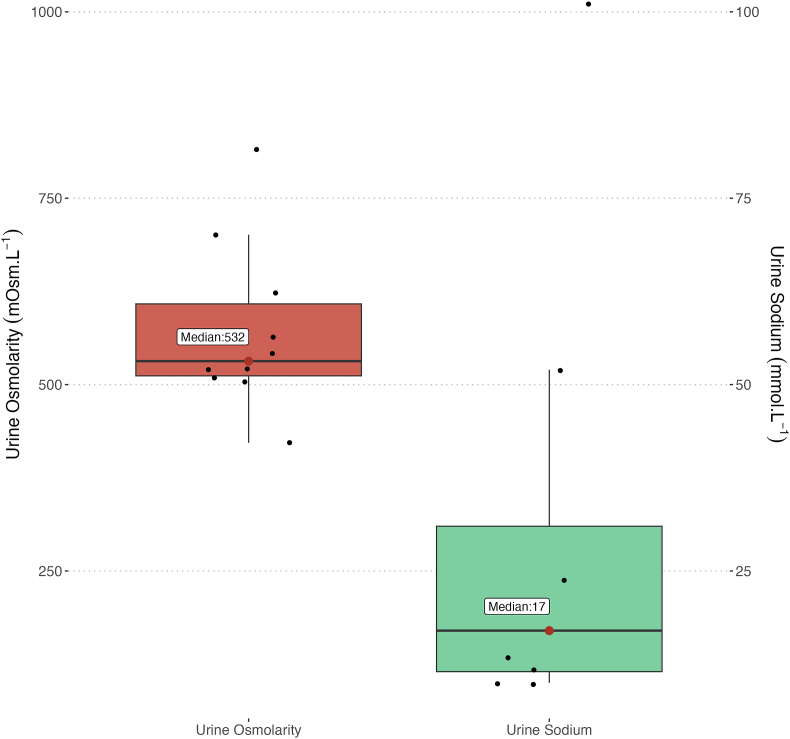
Results: We screened 11,642 ICU admissions and identified 109 patients with severe ICU-AH. The median age was 57 years, 63% were male, and the median Acute Physiology and Chronic Health Evaluation III score was 64 (52; 80). On the day of ICU admission, 64% of patients were ventilated; 71% received vasopressors, and 22% had acute kidney injury. The median peak sodium level was 158 (156; 161) mmolL-1 at a median of 4 (1; 11) days after ICU admission. Only eight patients (7%) had urine sodium measurement (median concentration: 17 mmol·L-1). On the day of peak hypernatraemia, 80% of patients were unable to drink due to invasive ventilation; 34% were on diuretics; 25% had fever, and 50% did not receive hypotonic fluids. When available, the median electrolyte-free water clearance was -1.1 L (-1.7; -0.5), representing half of the urine output. After peak hypernatraemia, the correction rate was -2.8 mmol·L-1 per day (95% confidence interval: [-2.9 to -2.6]) during the first 3 d.
Conclusions: Severe hypernatraemia occurred in the setting of inability to drink, near-absent measurement of urinary free water losses, diuretic therapy, fever, renal impairment, and near-absent or limited or delayed water administration. Correction was slow.
Keywords: Correction rate; Electrolyte-free water clearance; Hypernatraemia; ICU-acquired hypernatraemia.
© 2024 Published by Elsevier B.V. on behalf of College of Intensive Care Medicine of Australia and New Zealand.
Conflict of interest statement
Rinaldo Bellomo is the Editor-in-Chief of Critical Care and Resuscitation Journal. The other authors do not have any conflict of interest to declare.
Figures


References
-
- Polderman K.H., Schreuder W.O., van Schijndel R.J.M.S., Thijs L.G. Hypernatremia in the intensive care unit: an indicator of quality of care? Crit Care Med. 1999;27(6):1105. - PubMed
LinkOut - more resources
Full Text Sources
