. 2025 Dec;14(1):2451718.
doi: 10.1080/22221751.2025.2451718. Epub 2025 Jan 27.

An IS element-driven antisense RNA attenuates the expression of serotype 2 fimbriae and the cytotoxicity of Bordetella pertussis

Affiliations

An IS element-driven antisense RNA attenuates the expression of serotype 2 fimbriae and the cytotoxicity of Bordetella pertussis

Alexandre D'Halluin et al. Emerg Microbes Infect. 2025 Dec.

Abstract

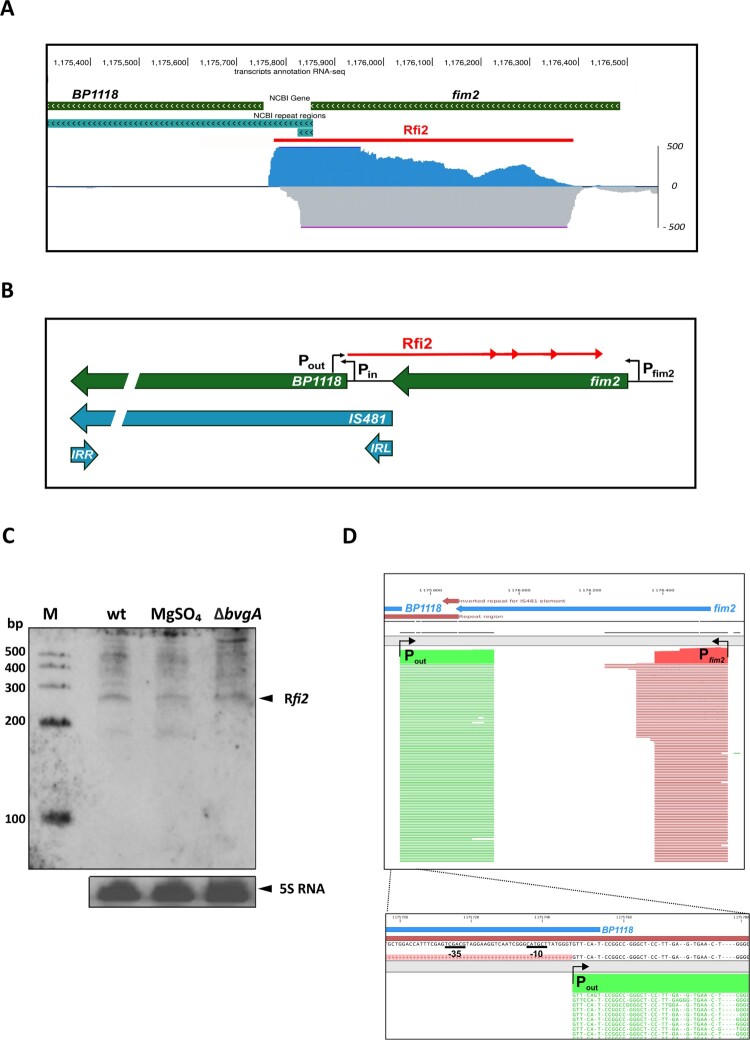
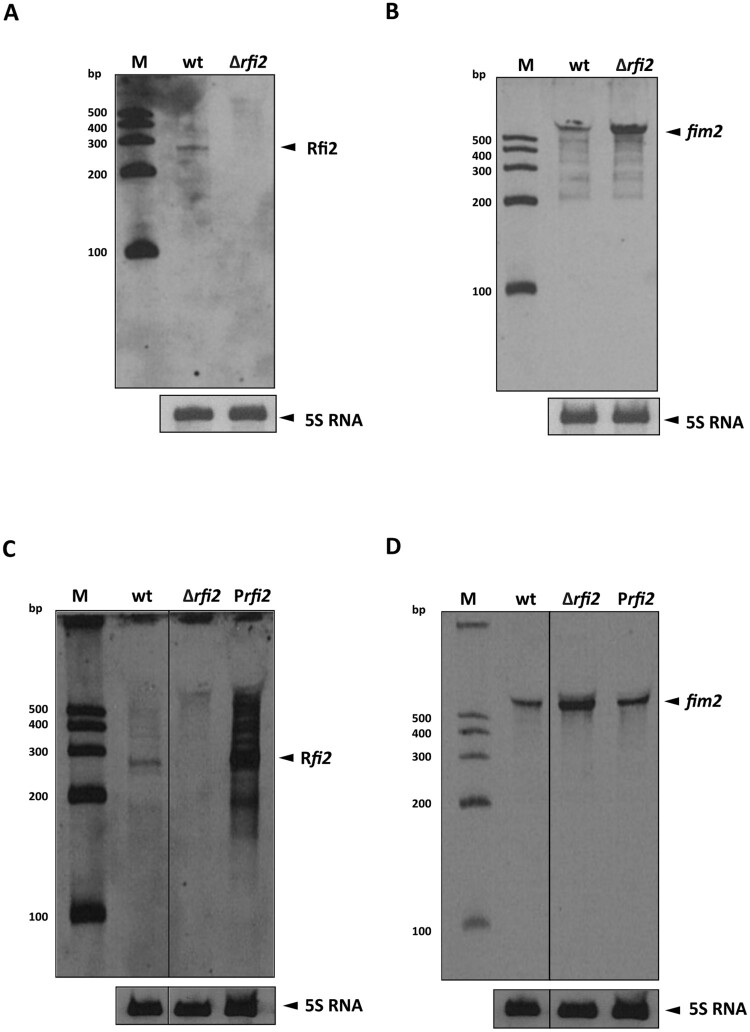
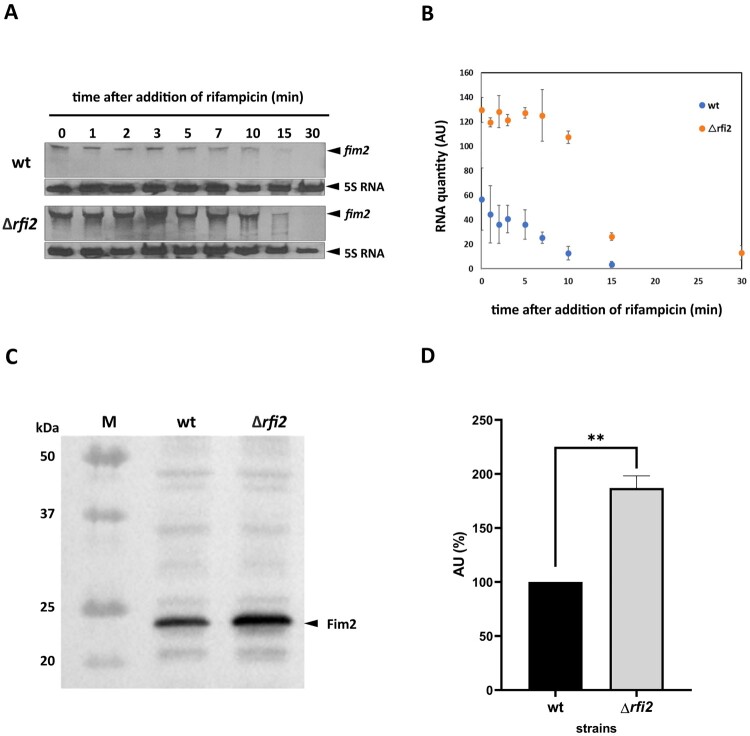
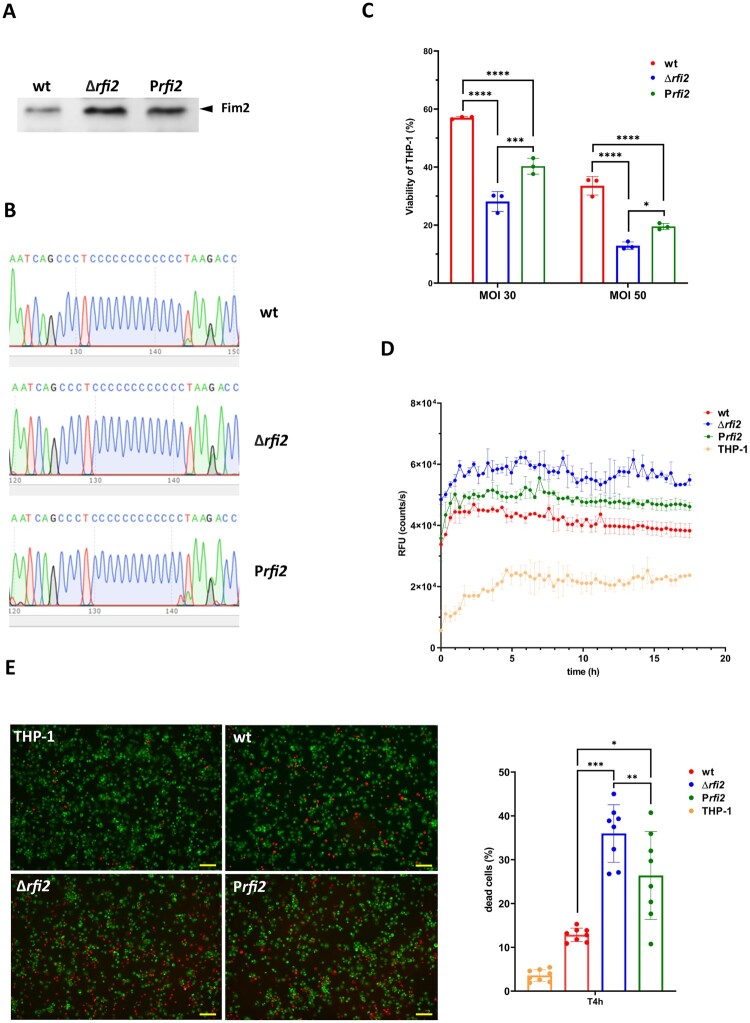
Insertion sequences (IS) represent mobile genetic elements that have been shown to be associated with bacterial evolution and adaptation due to their effects on genome plasticity. In Bordetella pertussis, the causative agent of whooping cough, the numerous IS elements induce genomic rearrangements and contribute to the diversity of the global B. pertussis population. Previously, we have shown that the majority of IS-specific endogenous promoters induce the synthesis of alternative transcripts and thereby affect the transcriptional landscape of B. pertussis. Here, we describe the regulatory RNA Rfi2, which is transcribed from the Pout promoter of the IS481 gene BP1118 antisense to the adjacent fim2 gene encoding the major serotype 2 fimbrial subunit of B. pertussis. Among the classical bordetellae, Rfi2 is unique to B. pertussis, suggesting its specific role in virulence. We show that Rfi2 RNA attenuates fim2 transcription and, consequently, the production of the Fim2 protein. Interestingly, the mutant that does not produce Rfi2 displayed significantly increased cytotoxicity towards human macrophages compared to the parental strain. This observation suggests that the Rfi2-mediated reduction in cytotoxicity represents an evolutionary adaptation of B. pertussis that fine-tunes its interaction with the human host. Given the immunogenicity of Fim2, we further hypothesize that Rfi2-mediated modulation of Fim2 production contributes to immune evasion. To our knowledge, Rfi2 represents the first functionally characterized IS element-driven antisense RNA that modulates the expression of a virulence gene.

Keywords: Bordetella pertussis; antisense RNA; cytotoxicity towards macrophages; fimbriae serotype 2; insertion sequence; modulation of virulence.


Conflict of interest statement

No potential conflict of interest was reported by the author(s).

Figures

Figure 1.
Figure 1.
Characterization of Rfi2. (A) Visualization of the deep RNA-seq dataset showing the region between BP1118 and fim2 genes. The graphs show the sequencing depth of the positive (blue) and negative (grey) strands. The gene annotations are depicted as green arrows. The red bar denotes the genomic position of Rfi2 RNA. Data and hub screenshot were obtained from [7]. (B) Scheme of the transcriptional organization of the BP1118-fim2 region as inferred from RNA-seq data. Black bent arrows indicate promoter regions. Green and blue bars indicate the annotated genes and the IS481 element including its left (IRL) and right (IRR) inverted repeat regions, respectively. Red arrow indicates the Rfi2 transcript driven by Pout promoter, arrowheads illustrate the abortive termination of the Rfi2 transcription yielding several Rfi2-specific transcripts. (C) Northern blot analysis of Rfi2 expression. Rfi2 transcript was detected using a biotinylated probe hybridized with 5 µg of total RNA isolated from B. pertussis grown in the absence (wt) and presence of sulphate (MgSO4). In parallel, Rfi2 was detected also in total RNA isolated from the ΔbvgA strain. The signals corresponding to the Rfi2 transcript (upper panel) and the 5S rRNA (lower panel) are indicated by the black arrowheads. The biotinylated Century RNA ladder was loaded as a molecular size marker (M). (D) Determination of the transcription start site of Rfi2 using the 5’RACE method. Upper panel: alignment of Rfi2-specific and fim2-specific reads is shown in green and red, respectively. Black bent arrows indicate transcription start site of Rfi2 and fim2 RNAs driven by corresponding promoter. Lower panel: detail of the Rfi2 promoter region. Black bent arrow indicates transcription start site of Rfi2. Plausible −10 and −35 boxes of the Pout promoter are underlined. Reads were aligned using CLC Genomics Workbench v10.
Figure 2.
Figure 2.
The effect of Rfi2 on fim2 expression. Northern blot was performed using total RNA isolated from wt, Δrfi2, and Prfi2 strains hybridized with biotinylated probes specific for Rfi2 (A, C) or fim2 (B, D) transcripts. The signals corresponding to detected Rfi2 and fim2 transcripts (upper blots) and to 5S RNA (lower blots, loading controls) are indicated by black arrowheads. The biotinylated Century RNA ladder (M) was loaded as a molecular size marker.
Figure 3.
Figure 3.
Impact of Rfi2 on fim2 stability and translation (A) The stability of fim2 mRNA was assayed by Northern blot in B. pertussis wt and Δrfi2 strains. Total RNA was extracted from cells harvested before (time 0) and at the indicated time points after the addition of 150 µg/ml rifampicin (1 to 30 min) and probed with biotinylated probes. The signals corresponding to fim2 (upper blots) and to 5S RNAs (lower blots, loading controls) are indicated by black arrowheads for each strain. Only the relevant parts of the membranes are shown. The result is a representative of two independent experiments. (B) The signals obtained from two independent experiments were quantified using Scion Image software. The fim2-specific signals in the wt (blue) and Δrfi2 (orange) strains were quantified and normalized to the 5S RNA-specific signals. The normalized fim2-specific signals are expressed in arbitrary units (AU) and shown as means and standard deviations. (C) The production of Fim2 in the wt and Δrfi2 strains was assayed by Western blot analysis. Samples of cell lysates equivalent to 0.1 OD600 unit were separated by electrophoresis on 12.5% SDS-polyacrylamide gels and probed with anti-Fim2 antibodies. The signals corresponding to Fim2 are indicated by the black arrowhead. The protein ladder (M) with the indicated position of 25-kDa protein were loaded onto the gel along with the cell lysates. Only the relevant part of the membrane is shown. The result is a representative of two independent experiments. (D) The Fim2-specific signals detected by Western blot analysis in two independent experiments with the wt (black) and Δrfi2 (grey) strains were quantified using BioRad Quantity One software and expressed in arbitrary units (AU), Fim2 level in the wt strain was set to 100%. Results are shown as means and standard deviations. Differences were statistically tested with an unpaired t-test; **, p < 0.01.
Figure 4.
Figure 4.
The stability of Rfi2 RNA under modulating conditions. The stability of Rfi2 RNA was determined by Northern blot analysis in wt cells cultured in modified SS medium in the absence (upper panel) or presence of 50 mM sulphate. Total RNA was extracted from cells harvested before (time 0) and at the indicated time points after the addition of rifampicin and probed with biotinylated probes. The signals corresponding to Rfi2 (upper blots) and to 5S RNAs (lower blots, loading controls) are depicted with arrowheads. Only the relevant parts of the membranes are shown. The result is a representative of three independent experiments.
Figure 5.
Figure 5.
Impact of Rfi2 on the pathogenicity of B. pertussis. (A) The production of Fim2 in the wt, Δrfi2 and Prfi2 strains was investigated by Western blot analysis. Samples of cell lysates equivalent to 0.1 OD600 unit were separated by electrophoresis on 12.5% SDS-polyacrylamide gels and probed with anti-Fim2 antibodies. The signals corresponding to Fim2 are indicated by the black arrowhead. The result is a representative of two independent experiments. (B) DNA sequence electropherograms showing the C-rich stretch within the promoter region of the fim2 gene in wt, Δrfi2 and Prfi2 strains. Sequences obtained from Eurofins Genomics Europe were visualized using SnapGene viewer. (C) Viability of THP-1 macrophages infected with wt, Δrfi2 and Prfi2 strains. Macrophages were infected in triplicate with B. pertussis strains at MOIs of 30 and 50 bacteria per macrophage for 2 h at 37°C. The macrophages were then washed with fresh RPMI and finally incubated in 200 µl RPMI and 20 µl WST-1 reagent for 40 min. After incubation, the absorbance of the samples, which is proportional to the viability of the cells, was measured at 450 nm using multi-well spectrophotometer. The absorbance of uninfected cells treated in parallel in the same manner was arbitrarily set to 100%. The bars represent mean values ± standard deviation, the labels above the bars indicate the mean values of cell viability (%). Statistical analysis was performed using a two-way ANOVA test for multiple comparisons (Sidak´s test); *, p-value < 0.05, ***, p-value < 0.0005, ****, p-value < 0.0001. The result is representative of three independent experiments. (D) Cytotoxicity of wt, Δrfi2 and Prfi2 strains towards THP-1 macrophages. Macrophages were infected in triplicate with all strains (MOI of 50). Uninfected cells served as control. Immediately after the addition of the fluorescent dye, THP-1 cells were incubated for 18 h (37°C, 5% CO2) in the microplate reader. During incubation, the fluorescence of the samples, which is proportional to cytotoxicity, was measured every 20 min. The graph shows the mean values and the standard errors of the means. The result is representative for two independent experiments. (E) Left; cytotoxicity of wt, Δrfi2 and Prfi2 strains towards THP-1 macrophages was determined by fluorescence microscopy. In parallel with the cytotoxicity assay (panel D), infected cells and uninfected cells, which served as control, were stained with PI and SYTO-9 fluorochromes and imaged with the Olympus IX83 fluorescence microscope at 10x magnification (scale bar = 100 µm). Right; the live (green) and dead (red) macrophage cells of each strain were counted in eight different fields. Cytotoxicity is expressed as a percentage of dead cells. Statistical analysis was performed using a one-way ANOVA test for multiple comparisons (Tukey´s test). *, p-value < 0.05, **, p-value < 0.005, ***, p-value < 0.0001 ****.

References

    1. Siguier P, Gourbeyre E, Chandler M.. Bacterial insertion sequences: their genomic impact and diversity. FEMS Microbiol Rev. 2014;38(5):865–891. doi: 10.1111/1574-6976.12067 - DOI - PMC - PubMed
    1. Vandecraen J, Chandler M, Aertsen A, et al. The impact of insertion sequences on bacterial genome plasticity and adaptability. Crit Rev Microbiol. 2017;43(6):709–730. doi: 10.1080/1040841X.2017.1303661 - DOI - PubMed
    1. Parkhill J, Thomson N.. Evolutionary strategies of human pathogens. Cold Spring Harbor Symp Quant Biol. 2003;68:151–158. doi: 10.1101/sqb.2003.68.151 - DOI - PubMed
    1. Wang A, Roth JR.. Activation of silent genes by transposons Tn5 and Tn10. Genetics. 1988;120(4):875–885. doi: 10.1093/genetics/120.4.875 - DOI - PMC - PubMed
    1. Safi H, Barnes PF, Lakey DL, et al. IS6110 functions as a mobile, monocyte-activated promoter in mycobacterium tuberculosis. Mol Microbiol. 2004;52(4):999–1012. doi: 10.1111/j.1365-2958.2004.04037.x - DOI - PubMed

MeSH terms

LinkOut - more resources