. 2025 Feb;12(8):e2412526.
doi: 10.1002/advs.202412526. Epub 2025 Jan 9.

Single-Cell Multi-omics Assessment of Spinal Cord Injury Blocking via Cerium-doped Upconversion Antioxidant Nanoenzymes

Affiliations

Single-Cell Multi-omics Assessment of Spinal Cord Injury Blocking via Cerium-doped Upconversion Antioxidant Nanoenzymes

Ke Wang et al. Adv Sci (Weinh). 2025 Feb.

Abstract

Spinal cord injury (SCI) impairs the central nervous system and induces the myelin-sheath-deterioration because of reactive oxygen species (ROS), further hindering the recovery of function. Herein, the simultaneously emergency treatment and dynamic luminescence severity assessment (SETLSA) strategy is designed for SCI based on cerium (Ce)-doped upconversion antioxidant nanoenzymes (Ce@UCNP-BCH). Ce@UCNP-BCH can not only efficiently eliminate the SCI localized ROS, but dynamically monitor the oxidative state in the SCI repair process using a ratiometric luminescence signal. Moreover, the classic basso mouse scale score and immunofluorescence analysis together exhibit that Ce@UCNP-BCH effectively facilitates the regeneration of spinal cord including myelin sheath, and promotes the functional recovery of SCI mice. Particularly, the study combines snATAC-eq and snRNA-seq to reveal the heterogeneity of spinal cord tissue following Ce@UCNP-BCH treatment. The findings reveal a significant increase in myelinating oligodendrocytes, as well as higher expression of myelination-related genes, and the study also reveals the gene regulatory dynamics of remyelination after treatment. Besides, the ETLSA strategy synergistically boosts ROS consumption through the superoxide dismutase (SOD)-related pathways after SOD-siRNA treatment. In conclusion, this SETLSA strategy with simultaneously blocking and dynamic monitoring oxidative stress has enriched the toolkit for promoting SCI repair.

Keywords: cerium‐doped nanoenzymes; myelination; oxidative stress monitoring; reactive oxygen species (ROS); spinal cord injury (SCI).


Conflict of interest statement

The authors declare no conflict of interest.

Figures

Scheme 1
Scheme 1
Ameliorating SCI via Ce@UCNP‐BCH promotes real‐time luminescence and single‐cell multi‐omics evaluation.
Figure 1
Figure 1
Characterizing data on the Ce@UCNP‐BCH. a) TEM showing Ce@UCNP image (Scale bar = 100 nm). b) TEM showing Ce@UCNP‐BCH image, Scale bar = 100 nm). c) Corresponding elemental mapping images of Ce@UCNP‐BCH. d) EDS spectrum of Ce@UCNP‐BCH. e) Fourier transform infrared spectra of the Ce@UCNP, BCH, and Ce@UCNP‐BCH. f) Absorbance spectrum of BCH in the absence or presence of H2O2 and luminescence spectrum of Ce@UCNP‐BCH in the absence or presence of H2O2. g) Absorbance changes of BCH after titration with H2O2 (0‐20 eq) (inset: visualization of the reaction process). h) Fluorescence intensity changes of Ce@UCNP‐BCH at 690 nm under different concentrations of H2O2 (0–20 eq) (inset: visualization of the reaction process). i) Fluorescence intensity changes of Ce@UCNP‐BCH at 650 nm under different concentrations of H2O2 (0–20 eq). j) The antioxidant activity of Ce@UCNP‐BCH based on hydrogen peroxide (H2O2) scavenging assay. k,l) Electron paramagnetic resonance (EPR) spectra of the H2O2 and O2 •− under different concentrations of Ce@UCNP‐BCH.
Figure 2
Figure 2
Detection of redox state and restoration of neural behaviors using Ce@UCNP‐BCH. a) Confocal microscopy fluorescence images of neurons stained by DCFH‐DA under various concentrations of CeO2 NPs, Scale bar = 50 µm. b) Confocal microscopy fluorescence images of neurons under different concentrations of CeO2 NPs, Scale bar = 50 µm. c) Relative length (LTB) and d) the number (NTB) of each branch for b (n = 30). e) Confocal microscopy images of neurons under various concentrations of Ce@UCNP, Scale bar = 50 µm. f) Relative length (LTB) and g) the number (NTB) of each branch for e) (n = 30). h) Fluorescence behaviors of BCH and Ce@UCNP‐BCH in neurons with different degrees of injury. i) Quantified ratios of I650/I690 intensity of h (n = 6). j) Confocal microscopy fluorescence images of neuronal treatments under various Ce@UCNP‐BCH concentrations, Scale bar = 20 µm. k) Relative length (LTB) and l) the number (NTB) of each branch for j) (n = 30). m) Redox state detection using Ce@UCNP‐BCH. n) UCL imaging of Ce@UCNP‐BCH in vivo. o) Quantified ratios of I650/I690 intensity of n (n = 5). * means p < 0.05, ** means p < 0.01, *** means p < 0.001, ns means not significant.
Figure 3
Figure 3
ROS‐scavenging and therapeutic effects of Ce@UCNP‐BCH in vivo. a) Representative images of L‐012‐stained mice after different treatments. b) Quantitative analysis of the intensity of ROS in mice (n = 3). c–e) The expression levels of IL‐6 c, TNF‐α d, and IL‐1β e in the SCI mouse after treatments (n = 3). f) BMS scores of SCI mice in the control, sham, injury, injury + Ce@UCNP, and injury+ Ce@UCNP‐BCH groups. Data are presented as mean ± SD (n = 9). Mean velocity (g) and total distance traveled (h) were used in an open field test to assess the recovery of motor skills in mice (n = 9). i) Mouse footprints from the control, sham, injured, injured + Ce@UCNP, and injured + Ce@UCNP‐BCH groups. j,k) Histograms of the stride length (j) and stride width (k) of mouse in the control, sham, injury, injury + Ce@UCNP, and injury+ Ce@UCNP‐BCH groups (n = 9). l) Representative images of mouse spinal cord tissue in the control, sham, injury, injury + Ce@UCNP, and injury+ Ce@UCNP‐BCH groups. The green arrow points to the site of injury. m) The images showing the location of the damaged spinal cord tissue in each experimental group after being stained with H&E (left) and LFB (right), scale bar=1 mm. n) The fluorescent images showing the spinal cord for immunofluorescence analysis co‐stained with anti‐NeuN antibodies (red) and anti‐BrdU (green), scale bar = 200 µm. o. The fluorescent images showing the spinal cord for immunofluorescence analysis co‐stained with anti‐GFAP antibodies (red) and anti‐NFH (green), scale bar = 200 µm. * means p < 0.05, ** means p < 0.01, *** means p < 0.001, ns indicate not significant.
Figure 4
Figure 4
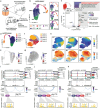
Single cell Atlas of spinal cord and differences in cell type and gene expression between conditions. a) Overview of this study, n represents biological replicates. b) UMAP plot showed 39442 spinal cord nuclei of snRNA‐seq. c) UMAP plot showed 129 549 spinal cord nuclei of snATAC‐seq. d) Sankey diagram showed the percentage of cell subtypes in different conditions in snATAC‐seq. e) UMAP plot showed main cell types of snATAC‐seq, including Neurons, Oligodendrocytes, Microglia & Immunocytes, Astrocytes & Vascular & Structured cells. f) The error bar plot illustrates the changes in cell subtypes following injury or Ce@UCNP‐BCH therapy, as analyzed using scCODA. Positive and negative values represent increases and decreases in cell abundance, respectively, with red asterisks indicating statistically significant changes (FDR = 0.05). Sample sizes for the analysis were: Sham group (n = 3), Injured group (n = 3), and Therapy group (n = 5). g) Heat map with additional information on main cell type (top) and condition (bottom) showing z‐scores of normalized, log‐transformed, and scaled expressions of main genes of selected pathways in snRNA‐seq.
Figure 5
Figure 5
Gene regulatory dynamics of remyelination after treatment. a) Schematic of remyelination after Ce@UCNP‐BCH treatment following SCI. b) UMAP plot showed cell types of oligodendrocytes in snRNA‐seq, the clusters of cell types under three conditions: Sham, Injured, and Therapy were shown on the right, red arrow highlighted differences in cell populations. c) Enhanced Volcano plot showed differential gene expression in I (Injured) and C (Therapy) in MFOLs in snRNA‐seq. Positive values indicated high expression in condition C. The enrichment of the GO terms for the highly expressed genes was shown in the inset bar chart. d) UMAP plot showed cell types of oligodendrocytes in snATAC‐seq, annotation by using label transfer from snRNA‐dataset. e) Differential abundance of oligodendrocytes between condition I (injured) and condition C (Therapy) using MiloR. Colored spots represent neighborhoods that are differentially abundant with spatial (FDR < 0.1); Positive values indicated that the cell types were enrich in the condition C (Therapy). f) UMAP plot showed sub clusters of MFOLs in snATAC‐seq, computed the iterative LSI dimensionality reduction with Peak Matrix. g) Same as e, but for MFOLs between condition I (injured) and condition C (Therapy), positive values indicated that the cell types were enrich in the condition C (Therapy). h) Selected marker gene expression and TF motif activity deviation z‐scores for sub clusters of MFOLs. i) Genomic tracing of Olig1 accessibility for different conditions. The integrated RNA expression levels were shown in a violin plot to the right of each condition. Selected transcription factors were highlighted in the feature tracks using different color. Loops below the tracks indicate peak‐to‐gene connections. TFs Motifs that potentially regulate Oligo1 gene expression are shown at the bottom. j) Same as i, but for Apod gene. k) Same as i, but for Scd2 gene.
Figure 6
Figure 6
Mechanism involved in the neural restoration behaviors of Ce@UCNP‐BCH in vitro. a) The experimental framework of liquid chromatography‐mass spectrometry (LC‐MS) showing the target proteins of Ce@UCNP‐BCH associated with inflammation. b) Chord diagram showing the differentially expressed proteins of Ce@UCNP‐BCH targets involved in three pathways: cellular response to increased oxygen level, cellular oxidant detoxification, and cell death in response to oxidative stress. Individual connecting curves indicate distinct protein functions within cells. c) Heatmap showing the protein expressions in different groups for (b). d) Western blot analysis showing SOD2 expression levels in mouse spinal cord tissue in the control, sham, injury, injury + Ce@UCNP, and injury+ Ce@UCNP‐BCH groups. e) Densitometric quantifications of western blots depicted in (d). f) Immunofluorescence fluorescent images of spinal cord tissue stained with anti‐SOD2 antibodies, scale bar = 200 µm. g) Confocal microscopy fluorescence images of neuron in control, injury, injury + SOD2, injury + Ce@UCNP‐BCH, and injury + Ce@UCNP‐BCH + SOD2 groups, scale bar = 50 µm. h,i) LTB and NTB of the total number of branches for (g). j) Confocal microscopy fluorescence images of neuron in control, injury, injury + SOD2‐SiRNA, injury + Ce@UCNP‐BCH, and injury + Ce@UCNP‐BCH + SOD2‐SiRNA groups, scale bar = 50 µm. Measured j's total branch LTB (k) and NTB (l) in terms of relative length. m) Confocal microscopy fluorescence images of neurons in control, injury, injury + Ce@UCNP‐BCH, injury + 2‐MeOE2, and injury + Ce@UCNP‐BCH + 2‐MeOE2 groups, scale bar = 50 µm. Quantified LTB (n) and number NTB (o) of total branches for (m). p) ELISA analysis showing SOD2 levels in serum of mouse in control, sham, injury, injury + Ce@UCNP, injury + Ce@UCNP‐BCH, injury + 2‐MeOE2, injury + Ce@UCNP + 2‐MeOE2, injury + Ce@UCNP‐BCH + 2‐MeOE2 groups. q) The schematic diagram of the electrophysiological experiment. r) Representative images during the electrophysiological measurements. s, t, and u. Cortical motor evokes potentials on the left side, and amplitudes of electrical signals in the spinal cord above and below the injured segments in each group (n = 3). * means p < 0.05, ** means p < 0.01, *** means p < 0.001, ns means not significant.

References

    1. a) Hu X., Xu Y., Zhang H., Li Y., Wang X., Xu C., Ni W., Zhou K., J. Adv. Res. 2022, 40, 125; - PMC - PubMed
    2. b) Warren P. M., Steiger S. C., Dick T. E., MacFarlane P. M., Alilain W. J., Silver J., Nat. Commun. 2018, 9, 4843. - PMC - PubMed
    1. Courtine G., Sofroniew M. V., Nat. Med. 2019, 25, 898. - PubMed
    1. a) Li Z., Zhao T., Ding J., Gu H., Wang Q., Wang Y., Zhang D., Gao C., Bioact. Mater. 2023, 19, 550; - PMC - PubMed
    2. b) Zuo Y., Ye J., Cai W., Guo B., Chen X., Lin L., Jin S., Zheng H., Fang A., Qian X., Abdelrahman Z., Wang Z., Zhang Z., Chen Z., Yu B., Gu X., Wang X., Nat. Nanotechnol. 2023, 18, 1230. - PubMed
    1. Liu W., Xu B., Zhao S., Han S., Quan R., Liu W., Ji C., Chen B., Xiao Z., Yin M., Yin Y., Dai J., Zhao Y., Sci. Adv. 2023, 9, eade8829. - PMC - PubMed
    1. a) Xiong T., Yang K., Zhao T., Zhao H., Gao X., You Z., Fan C., Kang X., Yang W., Zhuang Y., Chen Y., Dai J., Adv. Sci. 2023, 10, e2205997; - PMC - PubMed
    2. b) Li L., Guo J., Wang Y., Xiong X., Tao H., Li J., Jia Y., Hu H., Zhang J., Adv. Sci. 2018, 5, 1800781; - PMC - PubMed
    3. c) Zhang Z., Guan J., Jiang Z., Yang Y., Liu J., Hua W., Mao Y., Li C., Lu W., Qian J., Zhan C., Nat. Commun. 2019, 10, 3561. - PMC - PubMed

LinkOut - more resources