. 2025 Feb;12(8):e2412581.
doi: 10.1002/advs.202412581. Epub 2025 Jan 9.

Bioactive Glycyrrhizic Acid Ionic Liquid Self-Assembled Nanomicelles for Enhanced Transdermal Delivery of Anti-Photoaging Signal Peptides

Affiliations

Bioactive Glycyrrhizic Acid Ionic Liquid Self-Assembled Nanomicelles for Enhanced Transdermal Delivery of Anti-Photoaging Signal Peptides

Zhuxian Wang et al. Adv Sci (Weinh). 2025 Feb.

Abstract

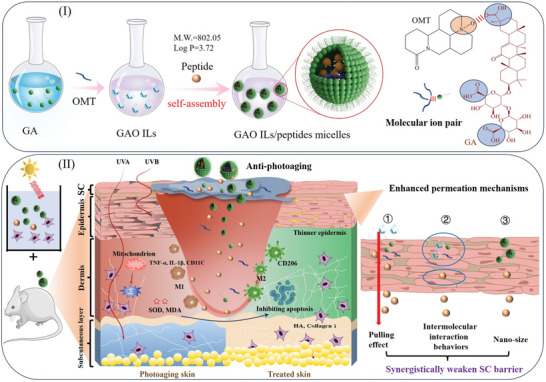
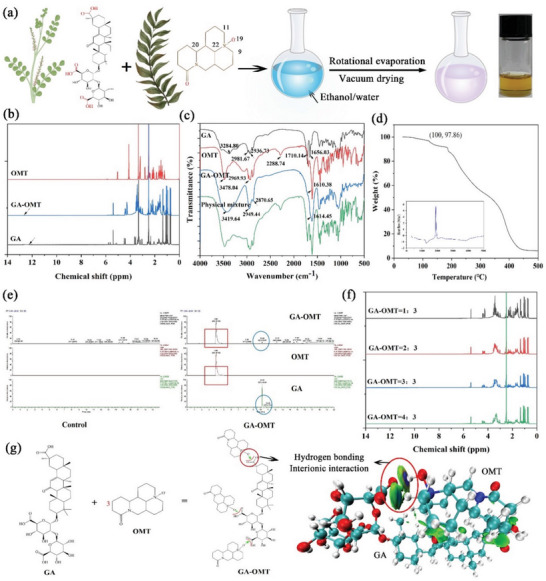
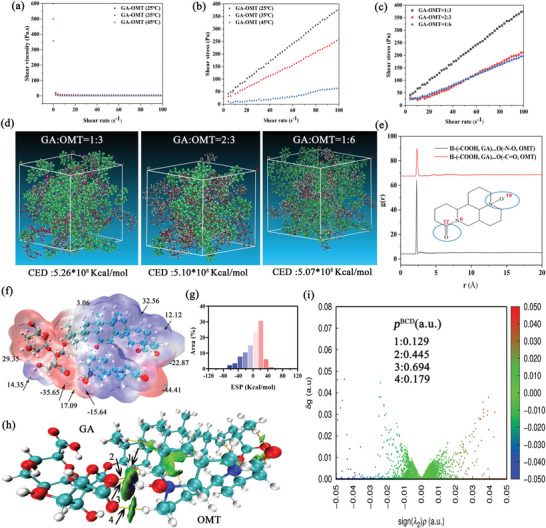
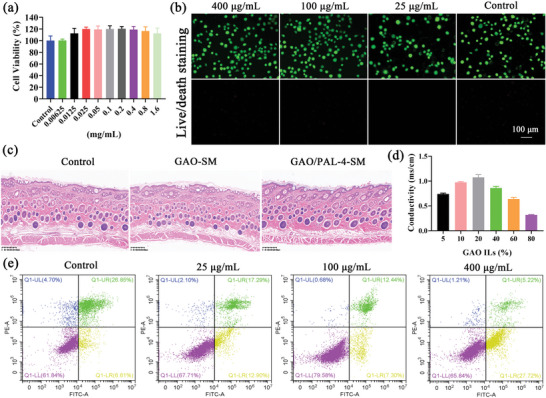
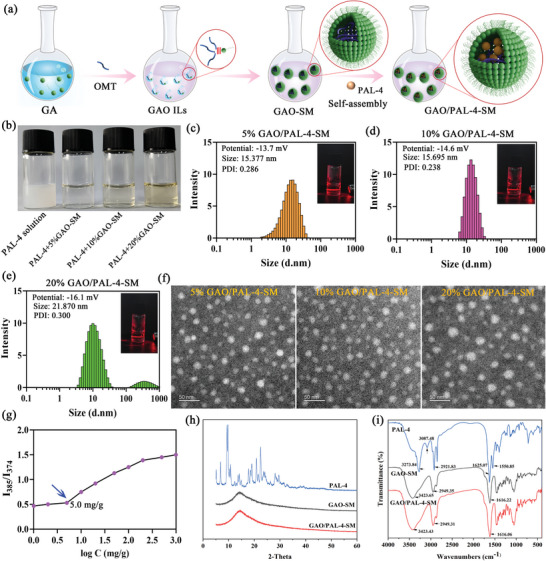
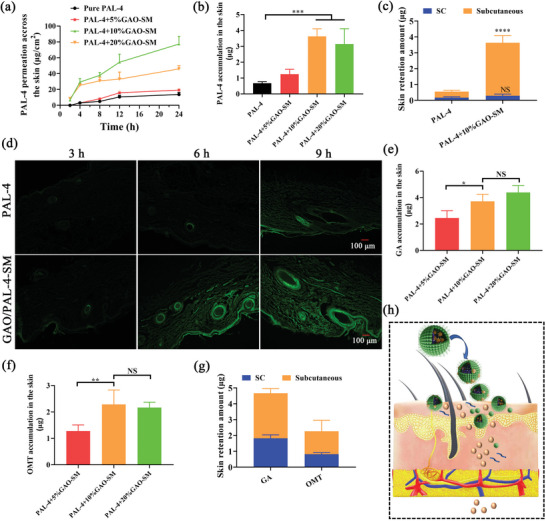
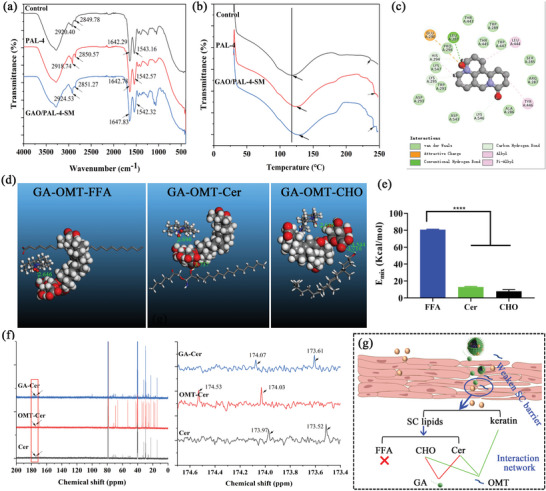
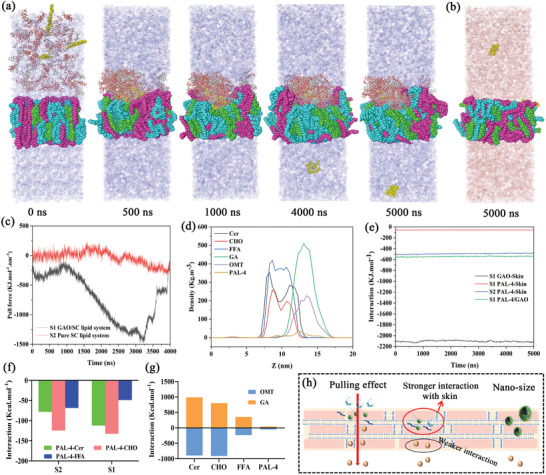
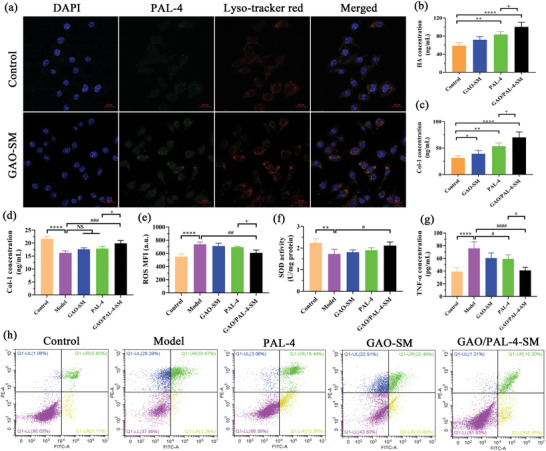
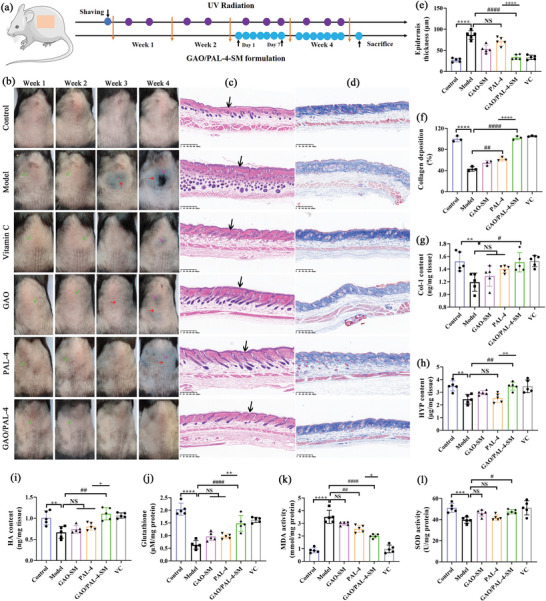
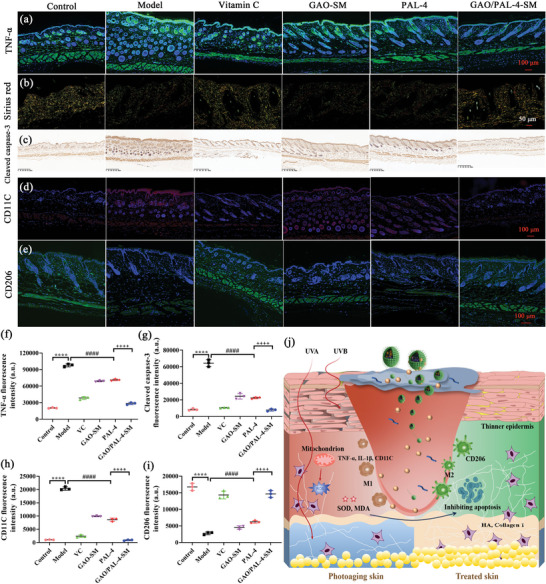
Sigal peptides have garnered remarkable efficacy in rejuvenating photoaged skin and delaying senescence. Nevertheless, their low solubility and poor permeability bring about a formidable challenge in their transdermal delivery. To address this challenge, bioactive ionic liquids (ILs) synthesized from natural glycyrrhizic acid (GA) and oxymatrine (OMT) with eminent biocompatibility is first prepared. The components ratios and inherent forming mechanisms of GA-OMT (GAO) are optimized by molecular dynamics simulations and density functional theory calculations. Remarkably, GAO can significantly improve the sparingly soluble properties of palmitoyl pentapeptide-4 (PAL-4), a model peptide drug. Subsequently, GAO self-assembled micelles loading PAL-4 (GAO/PAL-4-SM) are fabricated without additional auxiliary materials. The permeation and subcutaneous retention of PAL-4 are significantly promoted with 10wt.% GAO-SM. Moreover, GAO ILs facilitated PAL-4 permeation by enhancing its miscibility and interaction with stratum corneum (SC), offering a pulling effect and micellar structures for PAL-4, as elucidated by computational simulations. In cellular and animal photoaging experiments, GAO/PAL-4-SM possessed remarkable capabilities in boosting collagen and hyaluronic acid regeneration, mitigating inflammation and apoptosis, accelerating macrophage M2 polarization, thereby lessening skin wrinkles and leveraging elasticity. Collectively, the research innovatively designed an ILs self-assembled nano-micellar transdermal delivery system to enhance the permeability and anti-photoaging effect of signal peptides.

Keywords: computational simulations; glycyrrhizic acid; ionic liquid self‐assembled micelles; permeation enhancement; photoaging; signal peptides.


Conflict of interest statement

The authors declare no conflict of interest.

Figures

Scheme 1
Scheme 1
Schematic of the synthesis, permeation, and anti‐photoaging effects of GAO/PAL‐4‐SM. (I) The ionic hydrogen bonding interaction between N+‐O and ‐COOH predominantly drove the formation of GAO with the GA/OMT ratio of 1:3. Moreover, GAO ILs could be self‐assembled into micelles without additional auxiliary materials with PAL‐4 (GAO/PAL‐4‐SM). (II) GAO micelles possessed high capabilities to dissolve, load PAL‐4, and then deliver PAL‐4 to deeper skin layers by pulling them forward, providing a stronger interaction with skin and nano‐size. Therefore, bioactive GAO ILs promoted the anti‐photoaging effect of PAL‐4 at the cellular and animal levels.
Figure 1
Figure 1
Syntheses, characterization, and the forming mechanisms of GAO ILs. a) The preparation process and the appearance of GAO (GA/OMT ratio at 1:3) b) 1H NMR spectra of GA, OMT, and GAO ILs; c) Infrared spectra of GA, OMT, physical mixture, and GAO ILs; d) DSC‐Tg thermograms of GAO; e) HPLC‐MS analysis of the GAO ILs; f) 1H NMR spectra of GAO with GA/OMT ratios at 1:3, 2:3, 3:3, and 4:3; g) The reaction machine of GAO.
Figure 2
Figure 2
The rheological properties and interionic interaction details of GAO ILs. a) The shear viscosity and b) shear stress of GAO ILs as a function of shear rate at 25 °C, 35 °C, and 45 °C. c) Shear stress as a function of shear rate for GAO with different GA‐to‐OMT ratios at 1:3, 2:3, and 1:6; d) Snapshots and CED values of MDS for different GA‐OMT binary systems; e) RDFs of H atoms of ‐COOH in GA relative to the distance of O atoms in C═O or N+‐O of OMT; f, g) ESP, h) IGMH and i) AIM analysis of GAO with GA/OMT mole ratio at 1:3 in DFT analysis.
Figure 3
Figure 3
Biocompatibility, conductivity, and anti‐apoptosis of GAO ILs. a) HSF Cells viability after incubation with GAO at concentrations ranging from 6.25‐1600 µg mL−1 for 24 h (n = 6); b) Live‐dead staining of HSF cells treated with GAO at 25, 100, and 400 µg mL−1, respectively (Bar = 100 µm); c) The irritative properties of GAO‐SM and GAO/PAL‐4‐SM on the dorsal skin of guinea pig (Bar = 400 µm); d) Conductivity of GAO ILs under different water contents (n = 3); e) Apoptosis investigation of HSF cells treated with GAO at 25, 100, and 400 µg mL−1 using flow cytometry. Bar graphs represent mean ± SD.
Figure 4
Figure 4
Self‐assembly of GAO/PAL‐4‐SM. a) The preparation process of GAO/PAL‐4‐SM. b) The solubility properties of PAL‐4 in water and GAO‐SM (5%, 10%, and 20%); The particle size, zeta potential, PDI, size distribution, and Tyndall light scattering effect of c) 5% GAO/PAL‐4‐SM, d) 10% GAO/PAL‐4‐SM and e) 20% GAO/PAL‐4‐SM; f) TEM images of different micelles (Bar = 50 nm); g) CMC value of 10% GAO‐SM; h) X‐ray diffraction and i) FTIR curves of PAL‐4, 10% GAO‐SM and 10%GAO/PAL‐4‐SM.
Figure 5
Figure 5
GAO‐SM remarkably enhanced the permeation and subcutaneous layers retention of PAL‐4 within 24 h. a) In vitro permeation profiles of PAL‐4 under the effect of 5%, 10%, and 20%; b) PAL‐4 accumulation in the whole skin permeation in the presence or absence of GAO‐SM; c) PAL‐4 retention in SC and subcutaneous layer with or without 10% GAO‐SM; d) The dynamic fluorescence photographs showing the FITC‐labelled PAL‐4 permeation properties with or without 10% GAO‐SM within 3, 6, and 9 h (Bar = 100 µm); e) GA and f) OMT retention from different concentration of GAO ILs‐SM in the whole skin; g) GA and OMT retention in SC and subcutaneous layer from 10% GAO‐SM. (n = 4, Data are presented as mean values ± SD, ns = not significant, *p < 0.05, **p < 0.01, ***p < 0.001, ****p < 0.001). (h) The schematic picture illustrates the enhancing permeation effect of GAO‐SM on PAL‐4.
Figure 6
Figure 6
The enhancing mechanisms of GAO on the permeation of PAL‐4. a) Infrared spectra and b) DSC thermograms of the porcine skin treated with PAL‐4 or GAO/PAL‐4‐SM for 24 h; c) 2D docking associations between the residues of keratin and OMT (the black arrows stand for the N+‐O bond involving the formation of H‐bond with the keratin residues); d) Minimum energy ternary conformations and mixing energy of GAO binary systems with Cer, FFA or CHO; e) The mixing energy between GAO and different SC lipids. (Bar graphs represent mean ± SD, n = 4, ****p < 0.0001); f) The 13C NMR spectra of Cer treated with GA or OMT for 24 h, the variations of the carbonyl carbon atom of Cer in 13C NMR spectra analysis; g) The interaction network between different SC components and GA or OMT.
Figure 7
Figure 7
MDS analysis of PAL‐4 permeation through the SC barrier from GAO aqueous solution. The dynamic snapshots of PAL‐4 permeation across the lipid barrier in a) S1 and b) S2, with local enlargement of relevant permeation region. Blue, green, and magenta colors represent FFA, CHO, and Cer molecules, respectively; c) The pulling strength needed to pull PAL‐4 through the lipid barrier in S1 model and S2 model; d) Density distributions of FFA, Cer, CHO, GA, OMT, and PAl‐4 in the Z direction in S1 and S2; e) Total interaction force between the different components in S1 and S2; f) The interaction energy among PAL‐4 and FFA, CHO and Cer respectively; g) The interaction between GA anions or OMT cations and other components; h) GAO ILs delivered PAL‐4 to deeper skin layers by pulling them forward, providing a stronger interacting with skin and nano‐size.
Figure 8
Figure 8
GAO‐SM increased the anti‐photoaging effect of PAL‐4 on HSF cells. a) Intracellular assimilation distribution of FTIR‐labelled PAL‐4 in HSF cells with or without 10% GAO‐SM. (blue, nucleus; green, FITC‐labelled PAL‐4; Red, lysosome; Bar = 20 µm); b) HA and c) Col‐1 intracellular levels after treatment with GAO‐SM, PAL‐4, or both, respectively; d) Col‐1 intracellular levels exposed to UV after treatment with GAO‐SM, PAL‐4, or both, respectively; e) ROS, f) SOD and g) TNF‐α levels in HSF cells exposed to UV after incubation with GAO‐SM, PAL‐4, and GAO/PAL‐4‐SM respectively; h) Apoptosis investigation of HSF cells treated with GAO‐SM, PAL‐4 and GAO/PAL‐4‐SM respectively. (n = 5, Data are presented as mean value ± SD, # p < 0.05, **,## p < 0.01, ### p < 0.01,****,#### p < 0.0001).
Figure 9
Figure 9
GAO strengthened the capability of PAL‐4 to lower epidermis thickness, decrease inflammation levels, supplement collagen and HA loss, and alleviate oxidative stress. a) UV irradiation and drug application timeline; b) Representative images of photoaging curation at different time points (Green arrows represent desquamation, Red arrows represent wrinkles and leathery skin, while pink arrows represent pigmentation); c) H&E and d) Masson's trichrome staining of the photoaging skin after 4 weeks (Black arrows represent epidermis, bar = 400 µm); e) Epidermal thickness calculated from HE staining; f) The relative content of collagen of different groups from Masson staining; The content of g) Col‐I, h) HYP, i) HA, j) glutathione, k) MDA and l) SOD in the skin homogenate of different groups. (Bar graphs represent mean ± SD, n = 5, **p < 0.01, ****p < 0.0001 versus control; #p < 0.05, ##p < 0.01, ##p < 0.0001 versus Model; + p < 0.05, ++ p < 0.01, ++++ p < 0.0001 versus PAL‐4; NS: no significance).
Figure 10
Figure 10
GAO augmented the anti‐photoaging effect of PAL‐4 on UV‐induced photoaging C57/BL6 mice. The immunofluorescence staining of a) TNF‐α, d) CD11c, and e) CD206 (Bar = 250 µm); b) The Sirius red staining of Col‐I and collagen III (Bar = 50 µm, the yellow to red represent Col‐I, and green represent collagen III; c) The Immunohistochemical staining of cleaved caspase‐3 (Bar = 250 µm); The mean fluorescence intensity of f) TNF‐α, g) cleaved caspase‐3, h) CD11C and i) CD206 expression assessed by Image J software. (Bar graphs represent mean ± SD, n = 3, ****p < 0.0001 versus control; ####p < 0.0001 versus Model; ++++ p < 0.0001 versus PAL‐4); j) The schematic picture demonstrating the molecular mechanisms of GAO‐SM enhancing the anti‐photoaging of PAL‐4.

Similar articles

Cited by

References

    1. Lin C.‐H., Lin M.‐H., Chung Y.‐K., Alalaiwe A., Hung C.‐F., Fang J.‐Y., Chemosphere 2024, 347, 140702. - PubMed
    1. Hu S., Li Z., Cores J., Huang K., Su T., Dinh P.‐U., Cheng K., ACS Nano 2019, 13, 11273. - PMC - PubMed
    1. López‐Otín C., Blasco M. A., Partridge L., Serrano M., Kroemer G., Cell 2013, 153, 1194. - PMC - PubMed
    1. Kammeyer A., Luiten R. M., Ageing Res. Rev. 2015, 21, 16. - PubMed
    1. Gu Y. P., Han J. X., Jiang C. P., Zhang Y., Ageing Res. Rev. 2020, 59, 101036. - PubMed

LinkOut - more resources