. 2025 Mar 27;145(13):1407-1421.
doi: 10.1182/blood.2024024130.

Targeting WDR5/ATAD2 signaling by the CK2/IKAROS axis demonstrates therapeutic efficacy in T-ALL

Affiliations

Targeting WDR5/ATAD2 signaling by the CK2/IKAROS axis demonstrates therapeutic efficacy in T-ALL

Qi Han et al. Blood. .

Abstract

T-cell acute lymphoblastic leukemia (T-ALL) is an aggressive hematological malignancy with a poor prognosis and limited options for targeted therapies. Identifying new molecular targets to develop novel therapeutic strategies is the pressing immediate issue in T-ALL. Here, we observed high expression of WD repeat-containing protein 5 (WDR5) in T-ALL. With in vitro and in vivo models, we demonstrated the oncogenic role of WDR5 in T-ALL by activating cell cycle signaling through its new downstream effector, ATPase family AAA domain-containing 2 (ATAD2). Moreover, the function of a zinc finger transcription factor of the Kruppel family (IKAROS) is often impaired by genetic alteration and casein kinase II (CK2) which is overexpressed in T-ALL. We found that IKAROS directly regulates WDR5 transcription; CK2 inhibitor, CX-4945, strongly suppresses WDR5 expression by restoring IKAROS function. Last, combining CX-4945 with WDR5 inhibitor demonstrates synergistic efficacy in the patient-derived xenograft mouse models. In conclusion, our results demonstrated that WDR5/ATAD2 is a new oncogenic signaling pathway in T-ALL, and simultaneous targeting of WRD5 and CK2/IKAROS has synergistic antileukemic efficacy and represents a promising potential strategy for T-ALL therapy.


Conflict of interest statement

Conflict-of-interest disclosure: The authors declare no competing financial interests.

Figures

None
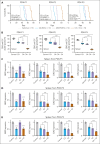
Graphical abstract
Figure 1.
Figure 1.
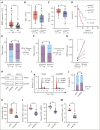
Oncogenic role of WDR5 through cell cycle regulation in T-ALL. (A) Comparison of WDR5 mRNA level in T-ALL cohort vs normal BM controls. (B-E) Association of WDR5 expression with WBC (B), BM blasts (C), survival (D), and relapse (E). The cohort was divided into WDR5high and WDR5low groups based on the median value of WDR5 mRNA level as the cutoff value. (F) The association of WDR5 expression with risk stratification in the T-ALL cohort. (G) Comparison of WDR5 mRNA level in 5 paired samples of newly diagnosed vs the relapsed ones. (H) Effect of WDR5 KD by shRNA on its protein level in CEM (left) and MOLT4 (right) cells. (I-J) Effect of WDR5 KD on cell cycle progress in CEM cells (I, representative images; J, bar graph). (K-L) Effect of WDR5 silence by shRNA on spleen weights (K) and percentage of human CD45+ cells in the spleen and BM of the xenograft mouse model (L). The mice were IV injected with the CEM-shNC or CEM-shWDR5 cells, respectively, for 28 days, and the single cells were prepared and analyzed. (M) Quantitation data of immunohistological images for human CD45+ cells in the spleen from CEM-shNC and CEM-shWDR5 mice. ∗P < .05; ∗∗P < .01; ∗∗∗P < .001. PI, propidium iodine; WBC, white blood cell.
Figure 2.
Figure 2.
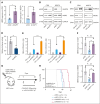
IKAROS represses WDR5 transcription in T-ALL. (A-B) Effect of IKZF1 KD on WDR5 expression in mRNA level by quantitative polymerase chain reaction (qPCR; A) and protein level in CEM and MOLT4 cells (B). (C) Effect of IKZF1 overexpression on WDR5 protein level in CEM (left) and MOLT4 (right) cells. (D) Effect of IKAROS on the activity of the WDR5 promoter assessed by luciferase reporter assay in 293T cells. (E) Effect of CX-4945 on IKAROS binding at the WDR5 promoter as measured by quantitative chromatin immunoprecipitation (qChIP) in CEM (left) and MOLT4 (right) cells. (F) The effect of IKZF1 KD on CX-4945–induced WDR5 expression change in mRNA level by qPCR in CEM (upper) and MOLT4 (lower) cells. (G) Schematic representation of the xenograft mice model. CEM-shNC or CEM-shWDR5 cells were IV injected into NCG mice and the following 4 groups of mice were established: group CEM-shNC plus vehicle (receive vehicle daily through gavage for 25 days); group CEM-shNC plus CX-4945 (receive CX-4945 daily through gavage at 100 mg/kg for 25 days); group CEM-shWDR5 plus vehicle (receive vehicle daily through gavage for 25 days); and group CEM-shWDR5 plus CX-4945 (receive CX-4945 daily through gavage at 100 mg/kg for 25 days). (H) Kaplan-Meier survival curves of 4 groups of mice. ∗P < .05; ∗∗P < .01; ∗∗∗P < .001.
Figure 3.
Figure 3.
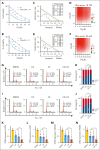
Synergistic effect of CX-4945 and WDR5 inhibitor on arresting cell proliferation and cell cycle in T-ALL. (A-B) Effect of the combination of CX-4945 and WDR5 inhibitor vs single drug on cell proliferation in CEM (A) and MOLT4 cells (B). (C-F) Synergistic analysis of the 2 inhibitors on proliferation arrest in CEM (C-D) and MOLT4 cells (E-F) with combination index (C,E) and Bliss models (D,F). Cells were treated with the indicated doses of drugs for 72 hours. (G-J) Effect of the combination of CX-4945 and WDR5 inhibitor vs single drug controls on cell cycle arrest in CEM (G, representative images; H, bar graph) and MOLT4 (I, representative images; J, bar graph) cells. Cells were treated with indicated doses of the drugs for 72 hours. (K-N) Effect of the combination of CX-4945 and WDR5 inhibitor vs the single drug control on mRNA levels of CCNE2 (K,M) and CDK2 (L,N) in CEM and MOLT4 cells. The cells were treated with indicated doses of the drugs for 72 hours, and the mRNA levels were quantitated with qPCR. ∗P < .05; ∗∗P < .01; ∗∗∗P < .001. PI, propidium iodine; OI, OICR-9429.
Figure 4.
Figure 4.
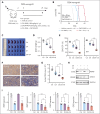
The combination of CX-4945 and WDR5 disruption has a synergistic antileukemic effect in the T-ALL mice model. (A) Schematic representation of the human T-ALL CEM cell-xenograft mouse model (CEM xenograft). CEM (2 × 105 per mouse) were IV injected into NCG mice, and the following 4 groups of mice were established: group 1 (vehicle control); group 2 (CX-4945 daily through gavage at 100 mg/kg for 25 days); group 3 (WDR5 inhibitor OICR-9429 every 2 days through intraperitoneal injection at 60 mg/kg for 25 days); and group 4 (CX-4945 and OICR-9429 combination treatment using the same doses as provided previously). (B) Comparison of Kaplan-Meier survival curves in the combination of CX-4945 and WDR5 inhibitor OICR-9429 compared with either single drug control of CEM-xenograft mouse models. The mice were treated with the indicated drugs for 25 days. (C-D) Spleen images (C) and weights (D) of 4 groups of mice posttreatment. (E) The percentage of human CD45+ and CD7+ cells in the spleen and BM from 4 groups of mice post-treatment. (F-G) Representative immunohistological images (F) and quantitation data (G) of human CD45 in the spleen from 4 groups of mice post-treatment. (H) The protein level of WDR5 and ATAD2 and the internal control of glyceraldehyde-3-phosphate dehydrogenase (GAPDH) in the spleen tissues of the mice after the treatment. (I) mRNA level of WDR5, ATAD2, CCNE2, and CDK2 in the spleen tissues of the mice after the treatment. Scale bar, 50 μm. ∗∗∗P < .001. i.g., intragastic gavage; i.p., intraperitoneal injection; OI, OICR-9429.
Figure 5.
Figure 5.
Therapeutic efficacy of the combination of CX-4945 and WDR5 inhibitor in patient-derived T-ALL leukemia-xenograft (PDX) mouse model. (A) Comparison of Kaplan-Meier survival curves in the combination of CX-4945 and WDR5 inhibitor OICR-9429 compared with either single drug controls in 3 different PDX mouse models: PDX-P1 (Patient, [Pt.] T-ALL-P1 in supplemental Table 3), PDX-P2 (Pt. T-ALL-P2), and PDX-P3 (Pt. T-ALL-P3). (B) Comparison of percentage of human CD45+CD7+ cells in the spleen of the mice in combo group vs either single drug controls. (C-E) Comparison of mRNA level of WDR5, ATAD2, CCNE2, and CDK2 in combo group vs either single drug controls in the spleen of the mouse models. The mice in panels A-E were treated with the indicated drugs for 25 days, and then, when the vehicle mice met the early removal criteria due to the excessive leukemia burden, the mice were euthanized and the single cells were isolated from the spleen for flow cytometry analysis; the mRNA of the cells was prepared for qPCR analysis. ∗∗∗P < .001. OI, OICR-9429.
Figure 6.
Figure 6.
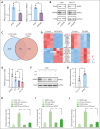
Identifying ATAD2 as the downstream target on CX-4945–mediated transcriptional repression of WDR5 in T-ALL. (A-B) Effect of WDR5 KD on ATAD2 expression in mRNA level (A) and protein level (B) of CEM (left) and MOLT4 (right) cells. (C) Overlapping DEGs from the RNA-seq data in CEM cells treated with CX-4945 or WDR5 inhibitor. (D) Heat map of the top overlapped DEGs in the 2 RNA-seq analyses. (E-F) Effect of combination of CX-4945 (CX) and WDR5 inhibitor OICR-9429 (OI) on the expression of ATAD2 compared with a single drug in mRNA level (E) and protein level (F) in CEM cells. (G) Effect of WDR5 on the activity of the ATAD2 promoter assessed by luciferase reporter assay in 293T cells. (H) Effect of WDR5 KD on the H3K4me3 enrichment in the promoter region of ATAD2 in CEM cells by qChIP assay. (I-J) Effect of CX-4945 on WDR5 binding and H3K4me3 enrichment at the ATAD2 promoter in CEM cells by qChIP assay. Panels H-J are representative of 3 qChIP assays. ∗P < .05; ∗∗P < .01; ∗∗∗P < .001. IgG, immunoglobulin G; OI, OICR-9429.
Figure 7.
Figure 7.
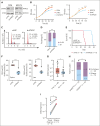
Oncogenic roles of ATAD2 by regulating cell cycle progression in T-ALL. (A) The efficiency of ATAD2 KD by shRNA (shATAD2) vs scramble shRNA control (shNC) in CEM (left) and MOLT4 (right) cells by western blot. (B) Effect of ATAD2 KD vs shNC on cell proliferation in CEM (left) and MOLT4 (right) cells. (C-D) Effect of ATAD2 KD vs shNC on cell cycle progression in CEM cells (C, representative images; D, bar graph). (E-F) Effect of ATAD2 silence by shRNA vs shNC on Kaplan-Meier survival curves (E), and percentage of human CD45+CD7+ cells (F) in the spleen and BM of the xenograft mouse model. The mice were IV injected with the CEM-shNC or CEM-shATAD2 cells, respectively, for 28 days, and the single cells were prepared and analyzed. (G) Comparison of ATAD2 mRNA level in our T-ALL cohorts vs normal BM controls. The mRNA levels were determined by qPCR assay. (H) Association of ATAD2 expression with relapse in our cohort. (I) Comparison of ATAD2 mRNA levels in 5 pairs of T-ALL newly diagnosed samples vs relapsed ones. ∗P < .05; ∗∗P < .01; ∗∗∗P < .001.

Comment in

Similar articles

Cited by

References

    1. Terwilliger T, Abdul-Hay M. Acute lymphoblastic leukemia: a comprehensive review and 2017 update. Blood Cancer J. 2017;7(6) - PMC - PubMed
    1. Vadillo E, Dorantes-Acosta E, Pelayo R, Schnoor M. T cell acute lymphoblastic leukemia (T-ALL): new insights into the cellular origins and infiltration mechanisms common and unique among hematologic malignancies. Blood Rev. 2018;32(1):36–51. - PubMed
    1. Patel AA, Thomas J, Rojek AE, Stock W. Biology and treatment paradigms in T cell acute lymphoblastic leukemia in older adolescents and adults. Curr Treat Options Oncol. 2020;21(7):57. - PubMed
    1. Pui CH, Evans WE. Treatment of acute lymphoblastic leukemia. N Engl J Med. 2006;354(2):166–178. - PubMed
    1. Kantarjian H, Stein A, Gökbuget N, et al. Blinatumomab versus chemotherapy for advanced acute lymphoblastic leukemia. N Engl J Med. 2017;376(9):836–847. - PMC - PubMed

MeSH terms