. 2025 Feb 3;13(2):210-228.
doi: 10.1158/2326-6066.CIR-23-1011.

TBK1 Targeting Is Identified as a Therapeutic Strategy to Enhance CAR T-Cell Efficacy Using Patient-Derived Organotypic Tumor Spheroids

Affiliations

TBK1 Targeting Is Identified as a Therapeutic Strategy to Enhance CAR T-Cell Efficacy Using Patient-Derived Organotypic Tumor Spheroids

Yi Sun et al. Cancer Immunol Res. .

Abstract

Novel therapeutic strategies are needed to improve the efficacy of chimeric antigen receptor (CAR) T cells as a treatment of solid tumors. Multiple tumor microenvironmental factors are thought to contribute to resistance to CAR T-cell therapy in solid tumors, and appropriate model systems to identify and examine these factors using clinically relevant biospecimens are limited. In this study, we examined the activity of B7-H3-directed CAR T cells (B7-H3.CAR-T) using 3D microfluidic cultures of patient-derived organotypic tumor spheroids (PDOTS) and then confirmed the activity of B7-H3.CAR T cells in PDOTS. Although B7-H3 expression in PDOTS was associated with B7-H3.CAR-T sensitivity, mechanistic studies revealed dynamic upregulation of co-inhibitory receptors on CAR T-cells following target cell encounter that led to CAR T-cell dysfunction and limited efficacy against B7-H3-expressing tumors. PD-1 blockade restored CAR T-cell activity in monotypic and organotypic tumor spheroids with improved tumor control and upregulation of effector cytokines. Given the emerging role of TANK-binding kinase 1 (TBK1) as an immune evasion gene, we examined the effect of TBK1 inhibition on CAR T-cell efficacy. Similar to PD-1 blockade, TBK1 inhibition restored CAR T-cell activity in monotypic and organotypic tumor spheroids, prevented CAR T-cell dysfunction, and enhanced CAR T-cell proliferation. Inhibition or deletion of TBK1 also enhanced the sensitivity of cancer cells to immune-mediated killing. Taken together, our results demonstrate the feasibility and utility of ex vivo profiling of CAR T cells using PDOTS and suggest that targeting TBK1 could be used to enhance CAR T-cell efficacy by overcoming tumor-intrinsic and -extrinsic resistance mechanisms.


Conflict of interest statement

Disclosure of Potential Conflicts of Interest

R.W.J. is a member of the advisory board for and has a financial interest in Xsphera Biosciences Inc., a company focused on using ex vivo profiling technology to deliver functional, precision immune-oncology solutions for patients, providers, and drug development companies. R.W.J. has received honoraria from Incyte (invited speaker), G1 Therapeutics (advisory board), Bioxcel Therapeutics (invited speaker). R.W.J. has ownership interest in U.S. patents US20200399573A9 and US20210363595A1. R.W.J.’s interests were reviewed and are managed by Massachusetts General Hospital and Mass General Brigham in accordance with their conflict-of-interest policies. M.S.F. receives funding from Calico Life Sciences, Bristol-Myers Squibb, Istari Oncology and has served as a consultant for Galvanize Therapeutics.

Figures

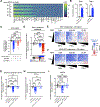
Figure 1 |
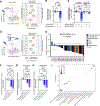
Figure 1 |. Ex vivo profiling of CAR T cells using monotypic and organotypic tumor spheroids.
A, Schematic of co-culture of CAR T cells with cell line-derived (monotypic) tumor spheroids in 3D microfluidic culture with B7-H3.CAR T cells added to the side channel with tumor spheroids grown in collagen hydrogels in the center/gel region. B, Viability assessment of ECC4-GFP tumor spheroids in 3D microfluidic culture treated with B7-H3.CAR-T and CD19.CAR-T (E:T 1:1) compared controls (n=9, 3 independent experiments). Mean values (bars) and individual values (open circles) are shown. One-way ANOVA with Tukey’s multiple comparisons test (**P<.01, ***P<0.001, ****P<0.0001, ns = not significant). C, Viability assessment of SUM159-GFP or B7-H3-null (B7-H3.ko) SUM159 tumor spheroids in 3D microfluidic culture treated with B7-H3.CAR-T and CD19.CAR-T (E:T 1:1) compared to untreated controls (n=6, 2 independent experiments). Mean values (bars) and individual values (open circles) are shown. One-way ANOVA with Tukey’s multiple comparisons test (****P<0.0001, ns = not significant). D, Schematic of PDOTS processing, culture, and treatment. E, Waterfall plot for PDOTS (n=25, indicated tumor types) treated with B7-H3.CAR-T (E:T 1:1) compared to untreated control PDOTS. Mean values (bars) are shown. F-H, PDOTS viability assessment from patients with (F) colorectal carcinoma (CRC), (G) pancreatic neuroendocrine tumor (PNET), and (H) pancreatic adenocarcinoma (PDAC). Mean values (bars) and individual values (open circles) are shown. (n=3 biological replicates per condition, one-way ANOVA with Tukey’s multiple comparisons test; *P < 0.05; **P < 0.01; ***P < 0.001; ****P < 0.0001; ns = not significant). I, Multiple linear regression summary for the association of PDOTS with ex vivo response to B7.H3-CAR-T with baseline tumor and immune features.
Figure 2 |
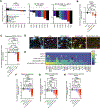
Figure 2 |. PD-1 blockade enhances CAR T-cell activity in monotypic and organotypic tumor spheroids.
A, Waterfall plot for PDOTS (n=7, indicated tumor types) treated with anti-PD-1 (pembrolizumab, 250 μg/mL), B7-H3.CAR-T (E:T 1:1), or combined anti-PD-1 plus B7-H3.CAR-T. Mean values are shown. B, Violin plot of PDOTS viability assessment with the indicated treatments. Mean values (bars) and individual values (open circles) are shown. n = 21 biological replicates, 7 independent specimens. Statistical analysis was performed using one-way ANOVA with Dunn’s multiple-comparison test. C, Viability assessment of anti-PD-1-refractory cutaneous melanoma PDOTS (10214) after the indicated treatments. Mean values (bars) and individual values (open circles) are shown. n = 3. Statistical analysis was performed using one-way ANOVA with Dunn’s multiple-comparison test. D, Representative images of PDOTS viability evaluation for PDOTS 10214 after the indicated treatments (blue = Hoechst; green = acridine orange; red = propidium iodide). E, Heatmap depicting changes in secreted cytokines in PDOTS 10214 after the indicated treatments. F-H, Viability assessment of (F) M160-GFP melanoma spheroids, (G) 10101 melanoma spheroids, and (H) ECC4-GFP tumor spheroids, and (H) in 3D microfluidic culture after the indicated treatments. Mean values (bars) and individual values (open circles) are shown. n=6, 2 independent experiments). One-way ANOVA with Tukey’s multiple comparisons test (**P<.01, ***P<0.001, ****P<0.0001, ns = not significant).
Figure 3 |
Figure 3 |. Targeting TBK1 enhances CAR T-cell activity in monotypic and organotypic tumor spheroids.
A, Waterfall plots for PDOTS (n=11, indicated tumor types) treated with TBK1i (1 μM), B7-H3.CAR-T (E:T 1:1), or combined B7-H3.CAR-T plus TBK1i. Mean values are shown. B, Violin plot of PDOTS viability assessment with the indicated treatments. Mean values (bars) and individual values (open circles) are shown. n = 33 biological replicates, 11 independent specimens. Statistical analysis was performed using one-way ANOVA with Dunn’s multiple-comparison test. C-E, Viability assessment of PDOTS from patients with (C) uveal melanoma (10239), (D) pancreatic adenocarcinoma (PDAC, 10261), and (E) hepatocellular carcinoma (HCC, 10250) after the indicated treatments. Mean values (bars) and individual values (open circles) are shown. n = 3. Statistical analysis was performed using one-way ANOVA with Dunn’s multiple-comparison test. F, Representative images of PDOTS viability evaluation for PDOTS 10250 after the indicated treatments (blue = Hoechst; red = propidium iodide). G-I, Viability assessment of (G) M160-GFP melanoma spheroids, (H) 10101 melanoma spheroids, and (I) ECC4-GFP tumor spheroids in 3D microfluidic culture after the indicated treatments. Mean values (bars) and individual values (open circles) are shown (n=6, 2 independent experiments). One-way ANOVA with Tukey’s multiple comparisons test (**P<.01, ***P<0.001, ****P<0.0001, ns = not significant). J, Incucyte viability assessment ECC4-GFP cholangiocarcinoma cells after the indicated treatments. Mean values (bars) and individual values (open circles) are shown (n=6, 2 independent experiments) +/− s.e.m. (shaded region). One-way ANOVA with Tukey’s multiple comparisons test (**P<.01, ***P<0.001, ****P<0.0001, ns = not significant). K, Representative images of ECC4-GFP cholangiocarcinoma cells after treatment with B7-H3.CAR-T alone or in combination with TBK1i in collagen hydrogels (green = GFP; blue = dead).
Figure 4 |
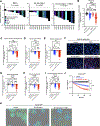
Figure 4 |. Targeting TBK1 prevents dysfunction of CAR T cells.
A, Schematic of co-culture of CAR T cells with cell line-derived (monotypic) tumor spheroids in 3D microfluidic culture with B7-H3.CAR-T added to the side channel with tumor spheroids grown in collagen hydrogels in the center/gel region. B-D, Flow cytometry of PD-1+ B7-H3.CAR T-cells before (control) and after co-culture with (B) 10101 melanoma spheroids, (C) M160-GFP melanoma spheroids, and (D) ECC4-GFP tumor spheroids in 3D microfluidic culture after the indicated treatments for 72 hours. E-G, Flow cytometry of CD39+TIM-3+ double positive B7-H3.CAR T cells before (control) and after co-culture with (E) 10101 melanoma spheroids, (F) M160-GFP melanoma spheroids, and (G) ECC4-GFP tumor spheroids in 3D microfluidic culture after the indicated treatments for 72 hours. H-J, Flow cytometry of LAG3+ B7-H3.CAR-T cells before (control) and after co-culture with (H) 10101 melanoma spheroids, (I) M160-GFP melanoma spheroids, and (J) ECC4-GFP tumor spheroids in 3D microfluidic culture after the indicated treatments for 72 hours. K-M, Flow cytometry of CD25+FOXP3+ B7-H3.CAR-T cells before (control) and after co-culture with (K) 10101 melanoma spheroids, (L) M160-GFP melanoma spheroids, and (M) ECC4-GFP tumor spheroids in 3D microfluidic culture after the indicated treatments for 72 hours. Mean values (bars) and individual values (open circles) are shown (n=3 independent experiments). One-way ANOVA with Tukey’s multiple comparisons test (**P<.01, ***P<0.001, ****P<0.0001, ns = not significant).
Figure 5 |
Figure 5 |. Targeting TBK1 promotes proliferation and effector function of CAR T cells.
A, CAR T-cell viability (Cell Titer Glo) after 96 hours co-cultured with 10101 melanoma cells in combination with anti-PD-1 or TBK1i compared to CAR T-cells alone (control). Mean values (bars) and individual values (open circles) are shown (n=3 independent experiments). B, Incucyte proliferation assessment of B7-H3.CAR-T cells labeled with CellTracker Green during co-culture with 10101 melanoma cells with the indicated treatments. Mean values (closed circles) are shown (n=6, 2 independent experiments) +/− s.e.m. (shaded region). One-way ANOVA with Tukey’s multiple comparisons test (*P<.05, ***P<0.001). C-D, Intracellular staining for TCF7 in B7-H3.CAR-T cells treated with TBK1i (C) and pembrolizumab (D). Mean values (bars) and individual values (open circles) are shown (n=2, 2 independent experiments). E, Western blotting for TBK1 levels in control sgRNA and TBK1 sgRNA B7-H3.CAR-T cells. F, Intracellular staining for TCF7 in control sgRNA and TBK1 sgRNA B7-H3.CAR-T cells. G-J, Flow cytometry of control and TBK1-null B7-H3.CAR-T cells after co-culture with 10101 melanoma spheroids examining surface expression of (G) PD-1+, (H) CD39+TIM3+, (I) LAG3+, and (J) CD25+FOXP3+. K-L, Concentrations of effector cytokines IFNγ (K) and TNFɑ (L) 3 days after co-culture with B7-H3.CAR-T cells with indicated treatments. Mean values (bars) and individual values (open circles) are shown (n=2 across two independent experiments; 1-sided unpaired t-test. M-N, Concentrations of secreted cytokines IFNγ (M) and TNFɑ (N) in 10250 PDOTS 5 days after co-culture with B7-H3.CAR-T cells with indicated treatments. Mean values (bars) and individual values (open circles) are shown (n=2 across two independent experiments); 1-sided unpaired t-test. O, Viability assessment of 10101 melanoma monotypic tumor spheroids in 3D microfluidic culture treated with control B7-H3.CAR-T cells (E:T 1:1), TBK1i-treated B7-H3.CAR-T cells, or TBK1-null B7-H3.CAR-T cells compared to untreated control. Mean values (bars) and individual values (open circles) are shown (n=6, 2 independent experiments). One-way ANOVA with Tukey’s multiple comparisons test (*P<.05, **P<.01, ****P<0.0001).
Figure 6 |
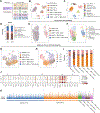
Figure 6 |. Single cell RNA sequencing of CAR T cells in 3D co-cultures with PDOTS.
A, Schematic of conditions for baseline (0 hr) and 24 hr of PDOTS +/− B7-H3.CAR-T cells in 3D culture with indicated treatment conditions. B-C, Uniform Manifold Approximation and Projection (UMAP) of all tumor and immune cells (77,284 cells) from the conditions indicated (B) with 9 unique populations identified (C). D, Bar plots of proportional changes in unique tumor and immune cell clusters identified in C. E-F, UMAP of 28,227 cells from the conditions indicated (E) and 10 unique populations identified (F) among sub-clustered CAR-T cells. G-H, UMAP of 15,179 cells from the conditions indicated (G) and 5 unique populations identified (H) among sub-clustered cancer cells. I, Bar plots of proportional changes in unique tumor cell clusters identified in H. J, Dot plot for select genes differentially expressed in the 5 sub-clusters of cancer cells. K, tracks plots depicting the changes in B7-H3 (CD276) gene expression across the different cancer cell sub-clusters at baseline (0 hr) and after 24 hr +/− B7-H3.CAR-T cell challenge with/without TBK1i (1 μM), αPD-1 (pembrolizumab, 250 μg/mL), or PD-1 plus TBK1i.
Figure 7 |
Figure 7 |. Targeting TBK1 sensitizes cancer cells to CAR T cell–derived TNFα/IFNγ.
A, Heatmap depicting changes in secreted cytokines in ECC4-GFP tumor spheroids treated with B7-H3.CAR-T (E:T of 1:1) compared to time-matched controls (L2FC of averages from 5 replicates across 2 independent experiments). B, Concentrations of effector cytokines IFNγ and TNFɑ at 48 hours. Mean values (bars) and individual values (open circles) are shown (n=5 across two independent experiments). Unpaired t-test (**P<0.01, ***P<0.001, ns = not significant). C, Cell viability assessment of ECC4-GFP tumor spheroids treated with B7-H3.CAR-T (E:T 1:1, 72 hours) alone or treated with anti-IFNγ (10 μg/mL), anti-TNFɑ (10 μg/mL), or anti-IFNγ plus anti-TNFɑ compared to untreated control. Mean values (bars) and individual values (open circles) are shown (n=6, 2 independent experiments). One-way ANOVA with Tukey’s multiple comparisons test (****P<0.0001). D, Cell viability assessment of control and TBK1-null 10101 melanoma tumor spheroids treated with B7-H3.CAR-T (E:T 1:1, 48 hours) compared to untreated control. Mean values (bars) and individual values (open circles) are shown (n=6, 2 independent experiments). One-way ANOVA with Tukey’s multiple comparisons test (**P<0.01, ***P<0.001, ns = not significant). E-F, Mean GR values (n=3 biological replicates) for (E) 10101 melanoma cells and (F) M160-GFP melanoma cells treated with TBK1i (n = 3) across TNFα/IFNγ concentrations. G-H, Viability assessment of (G) 10101 melanoma spheroids and (I) ECC4-GFP spheroids in 3D microfluidic culture treated with CD19.CAR-T or B7-H3.CAR-T (E:T 1:1, 48 hours) alone or with ruxolitinib (JAK1/2i, 0.5 μM). Mean values (bars) and individual values (open circles) are shown (n=6, 2 independent experiments). One-way ANOVA with Tukey’s multiple comparisons test (**P<.01, ****P<0.0001, ns = not significant). I, Viability assessment of PDOTS (10247, 10249, 10252, and 10261), with the indicated treatments. Mean values (bars) and individual values (open circles) are shown (n=12, 4 independent experiments).

References

    1. Neelapu SS, Locke FL, Bartlett NL, Lekakis LJ, Miklos DB, Jacobson CA, et al. Axicabtagene Ciloleucel CAR T-Cell Therapy in Refractory Large B-Cell Lymphoma. N Engl J Med. 2017;377:2531–44. - PMC - PubMed
    1. Schuster SJ, Svoboda J, Chong EA, Nasta SD, Mato AR, Anak Ö, et al. Chimeric Antigen Receptor T Cells in Refractory B-Cell Lymphomas. N Engl J Med. 2017;377:2545–54. - PMC - PubMed
    1. Qi C, Gong J, Li J, Liu D, Qin Y, Ge S, et al. Claudin18.2-specific CAR T cells in gastrointestinal cancers: phase 1 trial interim results. Nat Med. 2022;28:1189–98. - PMC - PubMed
    1. Del Bufalo F, De Angelis B, Caruana I, Del Baldo G, De Ioris MA, Serra A, et al. GD2-CART01 for Relapsed or Refractory High-Risk Neuroblastoma. N Engl J Med. 2023;388:1284–95. - PubMed
    1. Yu W-L, Hua Z-C. Chimeric Antigen Receptor T-cell (CAR T) Therapy for Hematologic and Solid Malignancies: Efficacy and Safety-A Systematic Review with Meta-Analysis. Cancers [Internet]. 2019;11. Available from: 10.3390/cancers11010047 - DOI - PMC - PubMed

MeSH terms