. 2025 Mar 1;36(3):ar38.
doi: 10.1091/mbc.E24-06-0267. Epub 2025 Jan 9.

Large, recursive membrane platforms are associated to Trop-1, Trop-2, and protein kinase signaling for cell growth

Affiliations

Large, recursive membrane platforms are associated to Trop-1, Trop-2, and protein kinase signaling for cell growth

Marco Trerotola et al. Mol Biol Cell. .

Abstract

The transmembrane glycoproteins Trop-1/EpCAM and Trop-2 independently trigger Ca2+ and kinase signals for cell growth and tumor progression. Our findings indicated that Trop-1 and Trop-2 tightly colocalize at macroscopic, ruffle-like protrusions (RLP), that elevate from the cell perimeter, and locally recur over hundreds of seconds. These previously unrecognized elevated membrane regions ≥20-µm-long, up to 1.5 µm high were revealed by Z-stack analysis and three-dimensional reconstruction of signal transducer-hosting plasma membrane regions. Trop-2 stimulates cell growth through a membrane supercomplex that comprises CD9, PKCα, ion pumps, and cytoskeletal components. Our findings indicated that the growth-driving Trop-2 supercomplex assembles at RLP. RLP behaved as sites of clustering of signal transducers, of phosphorylation/activation of growth-driving kinases, as recruitment sites of PKCα and as origin of Ca2+ signaling waves, suggesting RLP to be novel signaling platforms in living cells. RLP were induced by growth factors and disappeared upon growth factor deprivation and β-actin depolymerization, candidating RLP to be functional platforms for high-dimensional signaling for cell growth.


Figures
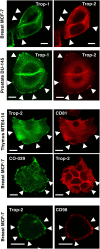
FIGURE 1:
FIGURE 1:
Trop-1, Trop-2, CD81, CO-029, CD98 colocalize at distinct membrane segments. Representative images (overall n = 1000) of breast MCF-7, prostate DU-145 cancer cells and transformed MTE4-14 thymus cells are presented. Cells were analyzed for expression and localization of pairs of signal transducers by confocal microscopy. White arrowheads indicate segments of colocalization at the cell membrane. Scale bars: 5 µm. (Top) Trop-1 and Trop-2 were revealed with the HT29/26-Alexa488 and T16-Alexa633 mAb, respectively. (Mid) Colocalization of Trop-2 with the CD81 and CO-029 tetraspanins. (Bottom) Colocalization of Trop-2 with the CD98 tetraspanin.
FIGURE 2:
FIGURE 2:
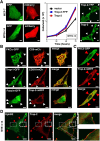
Distinct signaling molecules colocalize at confined cell membrane regions. Representative images (overall n = 3000) of thymus MTE4-14 and breast MCF-7, MDA-MB-231 cancer cells transfected with signaling molecule-FP chimeras or Ca2+ indicators. Membrane localization and impact on cell growth were assessed. White arrowheads indicate colocalization at the cell membrane of the pairs of signal transducers that were challenged. Red arrowheads indicate absence thereof. (A) (Left) Control transfectants, for vectors expressing FP proteins in the cytoplasm, show absence of mCherry or GFP localization to the cell membrane in MCF-7 and MTE4-14 cells. (Mid) The Trop-2–YFP chimera was shown to induce cell growth just as well as wild-type Trop-2. Vector: control cells transfected with vector alone (pEYFP-N1, devoid of the coding region of EYFP). Data are presented as mean ± SEM. (Right) Parallel localization of Trop-2–YFP chimeras versus wild-type Trop-2 in MTE4-14 transfectants. Trop-2–YFP signals were directly revealed by fluorescence analysis; those of untagged Trop-2 were revealed by T16-Alexa488 anti-Trop-2 mAb staining. Representative images (n = 20) are shown. (B) Horizontal panel strips show membrane colocalization of PKCα–GFP and CD9–mCherry, or Trop-1–GFP and CD316–mCherry, or Fascin–GFP and Trop-2–mRFP in MTE4-14 transfectants. (C) Lack of colocalization at the cell membrane of Trop-2–mRFP versus PKCδ–GFP in MTE4-14 cells. Scale bars, 10 µm. (D) EphB2 does not colocalize with Trop-2 at most RLP (red arrowheads). Dashed/dotted ROI magnify details of membrane sites whereby EphB2 is preferentially enriched versus Trop-2. Scale bars, 10 µm.
FIGURE 3:
FIGURE 3:
Adaptor signaling molecules poorly localize at Trop-2 sites at the cell membrane. Representative images (n = 40) of the Nck-FP, Crk-FP, Grb-2-FP cytoplasmic adaptor molecule transfectants. Nck, Crk, Grb-2 are used as tracers for membrane ruffle subsets (Hoon et al., 2012). Nck-EGFP, Crk-EGFP, and Grb-2-EGFP were transfected in MCF-7 cells. Trop-2-YFP was used as benchmark. White arrowheads indicate localization sites at free edges of the cell membrane. Essentially no recruitment of Grb-2-EGFP or Nck-EGFP at free edges of the cell membrane was observed. Limited recruitment was detected for Crk-EGFP versus the extensive one for Trop-2-YFP. Scale bars, 20 µm.
FIGURE 4:
FIGURE 4:
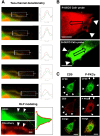
3D structure of membrane RLP. (A) Confocal microscopy analysis of a representative MTE4-14 cell (n = 100), transfected with CD9–mCherry and labeled with calcein (cytoplasm, green signal). Two channel densitometry: red and green signal densitometry was taken at sequential points in the image (vertical white arrows). The corresponding red versus green profiles are shown on the right. RLP modeling: The rim of cytoplasm contained in the RLP is labeled by calcein. CD9-mCherry labels the external membrane of the RLP. Arrowheads indicate the same RLP region in the two paired panels. A corresponding red/green RLP model is depicted in the cartoon on the right side. Scale bar, 1 µm. (B) Representative MDA-MB-231 cells (top) and MTE4-14/Trop-2 transfectants (bottom) (n = 200) supertransfected with the Ca2+ indicators G-GECO and R-GECO, respectively, to visualize cell membrane RLP. The pictures are Movie frames taken at the time of origin of cytoplasmic Ca2+ waves, as elicited by mAb-induced Trop-2 cross-linking (Ripani et al., 1998). The direction of propagation of the Ca2+ waves is indicated by the hollow arrows. The full dataset is presented in Supplemental Movie S6. Scale bars, 5 µm. (C) Representative MTE4-14 cells (n = 100) transfected with CD9 and labeled by anti-CD9 or anti-P-PKCα Alexa633 mAb (red). The cytoplasm of MTE4-14 cells was labeled with CSFE 5 µM in PBS 15 min at 37°C (green). Membrane RLP are indicated by white arrowheads. Merged signals are shown at the bottom. Scale bars, 5 µm.
FIGURE 5:
FIGURE 5:
Space/time dimensions of membrane RLP. (A) Analysis of membrane RLP size. One hundred cells were analyzed. Yellow stripes: overlaid “rulers” were generated by confocal microscopy with the LSM Image Browser 4.0 software. RLP length (µm) was estimated by combining the and routines. (B) Time-lapse analysis of membrane RLP size over time. The full dataset is presented in Supplemental Table S2. Analysis of RLP space-time transitions was performed on individual MTE4-14 living cells (n = 20) transfected with a Trop-2-EGFP chimera. Movies were recorded using the Zeiss LSM 510 3.0 software. Pixel residence time was set at 1.60 to 3.10 µs; image format was 1024×1024 pixels at 8 bit pixel depth. Images were captured at 30 to 96 s intervals. Individual platform lengths (red stripes) are plotted as graphs versus time. Scale bar, 5 µm. (C) RLP size was estimated for membrane-localized Trop-2, CD9, Erb-B4, phospho-Erb-B4 (P-Erb-B4), ezrin, ILK in MTE4-14 cells (n = 100). Measured RLP length in µm is indicated. Scale bars, 5 µm.
FIGURE 6:
FIGURE 6:
Signal transducers cluster at RLP. Trop-2 and CD9 were stained with the T16-Alexa633 mAb and sc-18869-488 mAb, respectively. (A) (Left) Comparison of confocal microscopy versus STED image acquisition. Trop-2 (red) and CD9 (green) signals at a representative RLP in MDA-MB-231 cell (n = 40) were collected. Merge: merging of the Trop-2 and CD9 images. STED better allowed to differentiate signal transducer clusters of different size and with different extent of signal overlap. Scale bars, 5 µm. (Right) High-resolution 2D-STED microscopy analysis of an MDA-MB-231 cell RLP stained with anti-Trop-2 (red) and anti-CD9 (green) antibodies. Red and green channels were acquired using independently optimized parameters and thresholds, to render corresponding binary signals. The binary colocalized image was used for “particle finder” from Fiji with no shape conditions, above a threshold of 3 pixels (18 nm region size). The decoded areas were combined to provide the total Trop-2 and CD9 signal areas (pink) and the colocalization areas (blue) for each membrane platform (red, green). Scale bars, 5 µm. (B) Scatter plots of individual domain size in MDA-MB-231 (n = 27) versus MCF7 (n = 16) breast cancer cells. (Top) Individual domain areas (µm2). (Bottom) Colocalization areas (µm2; horizontal bars: median values).
FIGURE 7:
FIGURE 7:
STED - Domain size distribution and signal transducer colocalization versus membrane curvature. (A) (Top) Size distribution of signal transducer areas (µm2) was evaluated in individual MDA-MB-231 and MCF7 breast cancer cells (cell number tags are listed at the bottom of the graphs). Scatter plots of individual signal domains are presented for each individual cell, according to presence in concave, convex or heterogeneous (various) regions, as measured by linear fitting of curvature parameters. (Bottom) Percent fraction of areas of colocalization of CD9 and Trop-2 versus total domain areas, according to presence in concave, convex or heterogeneous (various) regions. Most detected domains were found to have sizes below 0.01 µm2 (10,000 nm2, about 100 nm square side). However, the few largest domains accounted for 90% of the colocalization across different membrane shape regions. (B) Colocalization areas (in blue) and ratio of colocalization area/total domain area (in black) were measured, according to presence in concave, convex or heterogeneous (various) regions. (Top) Size of individual CD9/Trop-2 colocalization areas (µm2) in breast cancer cells. CD9/Trop-2 colocalization areas were found to measure from less than 1 µm2 to more than 3 µm2 in size. (Bottom) Ratio of colocalization areas versus total domain areas at individual cells level. The distributions of colocalization areas and of percent fraction of colocalization areas versus domain size were shown not to detectably depend on the curvature of cell membrane.
FIGURE 8:
FIGURE 8:
Growth-inducing kinases are recruited and activated at RLP. Endogenous cytoplasmic kinases were analyzed by mAb-staining immunofluorescence confocal microscopy (n = 1000). Trop-2 and CD9 were utilized as RLP tracers and for colocalization analysis. Representative single-plane images of Z-stack reconstructions are shown. White arrowheads indicate areas of colocalization of pairs of signal transducers at membrane RLP. (A) MTE4-14/Trop-2 transfectants were stained for Trop-2 (red) and for RET, Erb-B4, ILK, Syk, ERK-1, as indicated (green). Scale bars, 10 µm. (B) MTE4-14/Trop-2 transfectants were stained for Trop-2 or endogenous CD9 and for activated/phosphorylated P-Src, P-ERK-1/2, P-Erb-B4, P-RET, P-PKCα, P-Akt, as indicated. Scale bars, 10 µm.
FIGURE 9:
FIGURE 9:
Selective colocalization of signal transducers at RLP. (A) (Top) Cocapping of Trop-2 with CD9 and CD81 in MTE4-14 cells (n = 50). (Bottom) Lack of Trop-2 cocapping with caveolin-1 and control PKCα. White arrowheads indicate the edges of the capped regions. Red arrowheads indicate the regions with lack of cocapping. Scale bars, 5 µm. (B) MTE4-14 cells (n = 100) were transfected with Trop-2 mutants, generated as described (Guerra et al., 2022b). Mutants of the cytoplasmic region included: S303A: mutation of the PKCα phosphosite. E→K: mutation of the four E in the cytoplasmic tail to K. ΔHIKE: deletion of the HIKE region. Δcyto: deletion of the cytoplasmic tail. A87-A88: R87A and T88A mutants at the ADAM10 extracytoplasmic cleavage/activation site (Trerotola et al., 2021). White arrowheads indicate colocalization of Trop-2 and CD9 at RLP. None of the tested mutants detectably affected Trop-2 recruitment at RLP. Scale bars, 5 µm.
FIGURE 10:
FIGURE 10:
Membrane RLP and cell growth induction by GF. (A) (Left) MTE4-14 cells were GF-starved (0.1% serum) for 24 or 48 h and corecruitment of P-PKCα and CD9 at RLP sites was quantified by image analysis of cells stained with anti-P-PKCα Alexa488 and anti-CD9 Alexa633 mAb (n = 5000). Cells were classified (classes 1–5) according to the levels of expression of P-PKCα or CD9 at RLP. Class scores were obtained by multiplying RLP length (5 = entire cell perimeter; 1 = no RLP) by intensity values (5 = highest intensity; 1 = undetectable); the square root of the product was used for cell categorization. RLP were found to disappear after 24 h of serum starvation. Scale bars, 20 µm. (Right) Progressive disappearance of RLP over starvation time was quantified. Addition of 10% serum to serum-deprived cells led to full recovery of RLP in 24 h (bottom right, inset). (B) Inhibition of Trop-2–driven cell growth by kinase inhibitors. Scale bars: normalized cell (n = 5000)/well numbers at 72 h after seeding. Red: Trop-2 transfectants. Yellow: vector-alone transfectants. ANOVA test P values of Trop-2 versus control cells are indicated; (left) Erlotinib, as EGFR (Bhullar et al., 2018), FGFRs (Lee et al., 2022) inhibitor; (right) Sorafenib, as VEGFRs inhibitor (Bhullar et al., 2018; Lee et al., 2022). Trop-2 expression antagonized cell growth inhibition by Erlotinib, but not that by Sorafenib (dose–response: 0.1 to 10 µM). (C) (Left) Growth curves of serum-starved MTE4-14 cells (n = 1000), rescued by treatment with GF (1–10 nM). PDGF and FGF-1 efficiently stimulated cell growth. HGF, IGF-1 showed lesser impact on cell growth. SCF, VEGF had no significant effect. ANOVA test P values of Trop-2 versus control cells are indicated; *: <0.05; **: <0.01. (Right) Percentage of cells (n = 1000) with or without membrane RLP formation, as induced by 24 h exposure to the GF indicated (10 nM). RLP were visualized by staining for P-PKCα. The largest RLP induction was by the mixture of EGF, FGF, PDGF (“all GFs”) (in 41% of cells). The largest RLP induction by a single GF was by FGF (in 35% of cells). *: Pearson χ2, P = 0.023. The datasets and comparison statistics are presented in Supplemental Table S3. (D) GF-induced recovery of Trop-2 synthesis and transport to the cell surface. Cells in culture (n = 1000) were starved in 0.1% serum for 24 h. Serum addition triggered both Trop-2 synthesis (gray profiles; total Trop-2 in fixed cells) and Trop-2 transport to the cell surface (blue profiles; cell membrane-only staining of live cells). The slope of global synthesis of Trop-2 and transport to the cell membrane over time indicated faster recovery due to transport than to synthesis. Progressive recovery of membrane Trop-2 levels was reached after ≥8 h serum treatment. Kolmogorov–Smirnov test P values of Trop-2 expression in cells undergoing starvation/recovery versus Trop-2–expressing cells in control plus serum culture conditions are indicated. *: <0.05; **: <0.01.
FIGURE 11:
FIGURE 11:
β-actin orchestrates RLP structure and function. MTE4-14 cells (n = 1000) were analyzed for colocalization of signal transducers with cytoskeleton components in resting cells and upon disruption of β-actin (cytochalasin D, latrunculin B), tubulin (colchicine, nocodazole) or myosin (blebbistatin) assemblies. Signal transducer colocalization at RLP is indicated by white arrowheads. Red arrowheads indicate no colocalization of signal transducers or loss of it upon disruption of the cytoskeleton. (A) Growth curves of MTE4-14 cells (n = 5000) transfected with Trop-2 or vector alone, treated with 10 nM cytochalasin D (cyto-D). Data are presented as mean ± SEM. Growth curves were compared by two-way ANOVA with Bonferroni correction. Cytochalasin-D only abolished Trop-2–driven proliferation, not basal cell growth programs. P = 0.0299. (Right) Phalloidin-FITC staining of β-actin (top, green) and Alexa633-mAb staining of Trop-2 (bottom, red) show loss of β-actin polymerization and of membrane RLP upon treatment with cytochalasin D. (B) Trop-2 and CD9 colocalize with ezrin at RLP (n = 50). Scale bars, 10 µm. (C) Cotransfection of MTE4-14 cells (n = 1000) with the β-actin cytoskeleton marker Lifeact–mRFP1 and Trop-2–GFP demonstrated extensive colocalization of actin cytoskeleton and Trop-2–GFP at RLP. A corresponding dataset is presented in Supplemental Movie S4. Scale bars, 20 µm. (DF) Colocalization of PKCα–GFP and CD9–mCherry in MTE4-14 cell transfectants (n = 1000) was explored in resting cells and upon cytoskeleton disruption. Scale bars, 5 µm. (D) (Left) Cytochalasin D treatment (n = 1000). (Right) Recovery of membrane platforms 24 h after washout of cytochalasin D. (E) Disruption of tubulin organization after treatment with nocodazole (left, mid) or colchicine (right) (n = 500) had no effect on RLP. Tubulin was stained with anti-tubulin mAb-Alexa546. (F) (Left) Latrunculin B treatment disrupted PKCα–GFP/CD9–mCherry colocalization at RLP (n = 500). (Right) Blebbistatin treatment had no impact on RLP structure (n = 1000).

References

    1. Alberti S (1998). A phosphoinositide-binding sequence is shared by PH domain target molecules–a model for the binding of PH domains to proteins. Proteins 31, 1–9. - PubMed
    1. Alberti S (1999). HIKE, a candidate protein binding site for PH domains, is a major regulatory region of Gbeta proteins. Proteins 35, 360–363. - PubMed
    1. Alberti S, Bucci C, Fornaro M, Robotti A, Stella M (1991). Immunofluorescence analysis in flow cytometry: Better selection of antibody-labeled cells after fluorescence overcompensation in the red channel. J Histochem Cytochem 39, 701–706. - PubMed
    1. Alberti S, Nutini M, Herzenberg LA (1994). DNA methylation prevents the amplification of TROP1, a tumor associated cell surface antigen gene. Proc Natl Acad Sci U S A 91, 5833–5837. - PMC - PubMed
    1. Alberti S, Parks DR, Herzenberg LA (1987). A single laser method for subtraction of cell autofluorescence in flow cytometry. Cytometry 8, 114–119. - PubMed

LinkOut - more resources