. 2025 Mar 3;64(10):e202420673.
doi: 10.1002/anie.202420673. Epub 2025 Feb 10.

CO Cryo-Sorption as a Surface-Sensitive Spectroscopic Probe of the Active Site Density of Single-Atom Catalysts

Affiliations

CO Cryo-Sorption as a Surface-Sensitive Spectroscopic Probe of the Active Site Density of Single-Atom Catalysts

Beomgyun Jeong et al. Angew Chem Int Ed Engl. .

Abstract

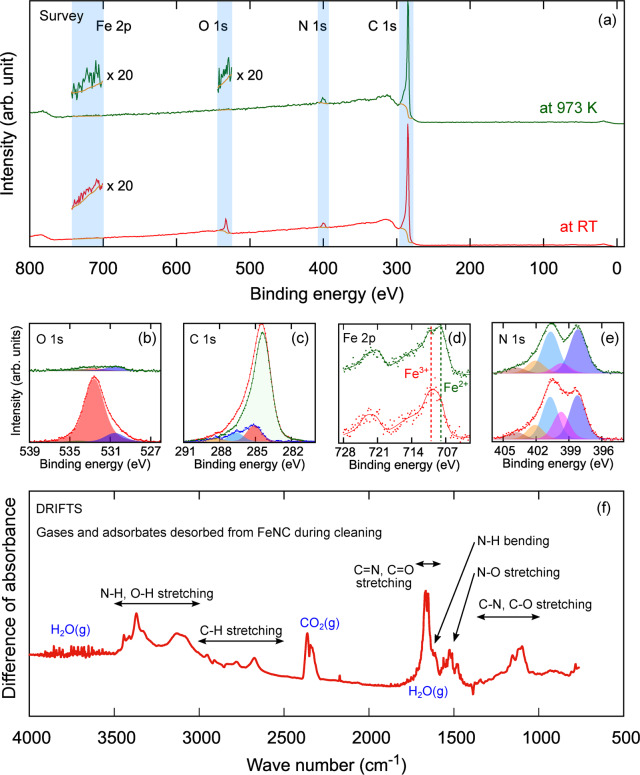
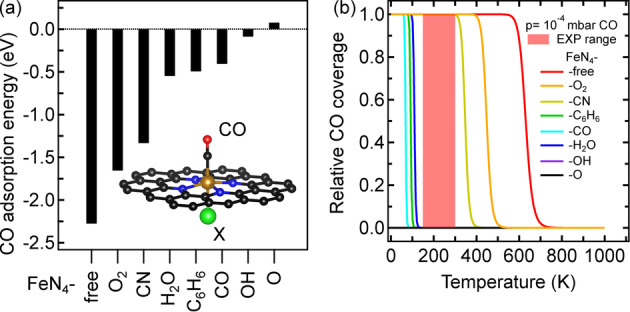
Quantifying the number of active sites is a crucial aspect in the performance evaluation of single metal-atom electrocatalysts. A possible realization is using adsorbing gas molecules that selectively bind to the single-atom transition metal and then probing their surface density using spectroscopic tools. Herein, using in situ X-ray photoelectron spectroscopy (XPS) and near edge X-ray absorption fine structure (NEXAFS) spectroscopy, we detect adsorbed CO gas molecules on a FeNC oxygen reduction single atom catalyst. Correlating XPS and NEXAFS, we develop a simple surface- and chemically-sensitive protocol to accurately and quickly quantify the active site density. Density functional theory-based X-ray spectra simulations reaffirm the assignment of the spectroscopic fingerprints of the CO molecules adsorbed at Fe-N4-C sites, and provide additional unexpected structural insights about the active site needed to explain the low-temperature CO adsorption. Our work represents an important step towards an accurate quantitative catalytic performance evaluation, and thus towards developing reliable material design principles and catalysts.

Keywords: ab initio calculations; adsorption; density functional calculations; heterogeneous catalysis; photoelectron spectroscopy; x-ray absorption spectroscopy.


Conflict of interest statement

There is no conflict of interest to declare.

Figures

Figure 1
Figure 1
(a) Survey, (b) O 1s, (c) C 1s, (d) Fe 2p, (e) N 1s XPS of FeNC under UHV at room temperature (RT) (red) and during surface cleaning at 973 K (green). Binding energies were calibrated with respect to graphitic carbon binding energy of 284 eV. The insets in (a) show scaled‐up intensity to highlight weak peaks. The blue spectrum in (c) is the difference spectrum between before and after surface cleaning and the dashed lines in (d) represent the binding energies of the lowest energy multiplet component of the respective Fe species. The peak components in the fitted spectra are explained in the text. (f) DRIFTS showing the pre‐adsorbed species on FeNC sample. It is calculated as difference between the spectra recorded before heating to 873 K and after cooling down to room temperature. This plotted difference spectrum shows the spectral fingerprint of the species desorbing from the FeNC sample during the cleaning process.
Figure 2
Figure 2
(a) O 1s XPS, (b) pressure, and (c) temperature conditions for the steps performed during the cryo‐sorption experiment (from top to bottom). (d) C 1s, (e) N 1s, and (f) Fe 2p XPS for the FeNC catalyst during heat treatment (red) and CO cryo‐sorption experiment (green).
Figure 3
Figure 3
O K NEXAFS for multiple steps to CO cryo‐sorption for (a) FeNC and (b) NC. (c) Fe L NEXAFS of the FeNC sample for the same steps as in (a). (d) DFT NEXAFS simulations, and (e) corresponding structures used for the NEXAFS simulations. The simulated data was shifted by −7.1 eV to match the experimental energy scale. The dashed vertical lines in (a) and (b) indicate the peak position of the O 1s→π* transition of CO, which is also highlighted in (d). The vertical lines in (c) highlight the visible changes in the Fe L spectrum. The Fe L NEXAFS for RT, UHV (dark green) was repeatedly overlaid on the one for 873 K, UHV (red) to clearly indicate the partial change in Fe oxidation state (Fe3+→Fe2+).
Figure 4
Figure 4
Using the sharp feature in the O K NEXAFS for quantification of CO(ad)‐Fe. (a)  O 1s XPS, (b) O K NEXAFS, each with CO(g) (top) and CO(ad) (bottom). Measurement of the gas phase XPS intensity IO1sCO(g) and the gas phase NEXAFS yield YOKCO(g) allows determination of the constant k, which is used to estimate the XPS intensity of adsorbed CO IO1sCO(ad) from the NEXAFS yield YO1sCO(ad) .
Figure 5
Figure 5
DFT results for the adsorption of CO onto a Fe‐N4 model system with backside adsorbates of various interaction strengths. (a) CO adsorption energies (b) phase diagram derived by micro‐kinetic modeling. The inset in (a) depicts a cut‐out section from the used periodic model system, showing the changed backside adsorbate X in green. The DFT calculations were performed with the hybrid functional HSE06.
Scheme 1
Scheme 1
Schematic diagram showing the surface adsorbates to the FeNC surface. H‐NC means NC with bonds to hydrogen atoms, which was identified with the DRIFTS. HT−O means high‐temperature resistant O species which were observed in the O 1s XPS after the surface‐cleaning heat treatment.

Similar articles

References

    1. Papanikolaou G., Centi G., Perathoner S., Lanzafame P., ACS Catal. 2022, 12, 2861–2876. - PMC - PubMed
    1. Li J., Chen C., Xu L., Zhang Y., Wei W., Zhao E., Wu Y., Chen C., JACS Au 2023, 3, 736–755. - PMC - PubMed
    1. Shao Y., Yuan Q., Zhou J., Small 2023, 19, 2303446. - PubMed
    1. Kang Z., Wang X., Wang D., Bai B., Zhao Y., Xiang X., Zhang B., Shang H., Nanoscale 2023, 15, 9605–9634. - PubMed
    1. Ren X., Wang Y., Liu A., Zhang Z., Lv Q., Liu B., J. Mater. Chem. A 2020, 8, 24284–24306.

LinkOut - more resources