Randomized Controlled Trial
. 2025 Jan 9:13:RP100088.
doi: 10.7554/eLife.100088.

The effect of transcutaneous auricular vagus nerve stimulation on cardiovascular function in subarachnoid hemorrhage patients: A randomized trial

Affiliations
Randomized Controlled Trial

The effect of transcutaneous auricular vagus nerve stimulation on cardiovascular function in subarachnoid hemorrhage patients: A randomized trial

Gansheng Tan et al. Elife. .

Abstract

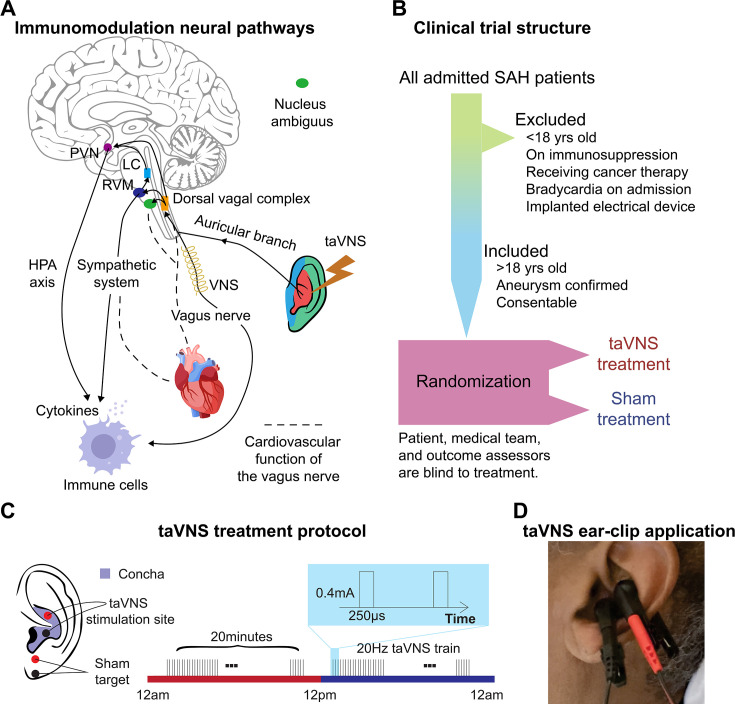
Background: Subarachnoid hemorrhage (SAH) is characterized by intense central inflammation, leading to substantial post-hemorrhagic complications such as vasospasm and delayed cerebral ischemia. Given the anti-inflammatory effect of transcutaneous auricular vagus nerve stimulation (taVNS) and its ability to promote brain plasticity, taVNS has emerged as a promising therapeutic option for SAH patients. However, the effects of taVNS on cardiovascular dynamics in critically ill patients, like those with SAH, have not yet been investigated. Given the association between cardiac complications and elevated risk of poor clinical outcomes after SAH, it is essential to characterize the cardiovascular effects of taVNS to ensure this approach is safe in this fragile population. Therefore, this study assessed the impact of both acute and repetitive taVNS on cardiovascular function.

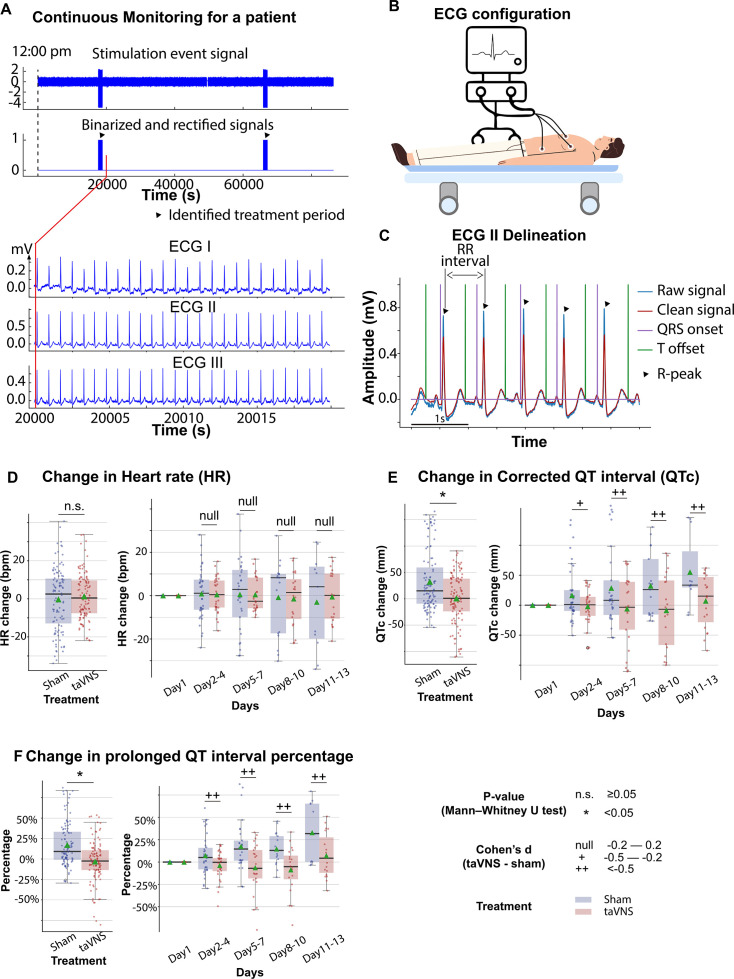
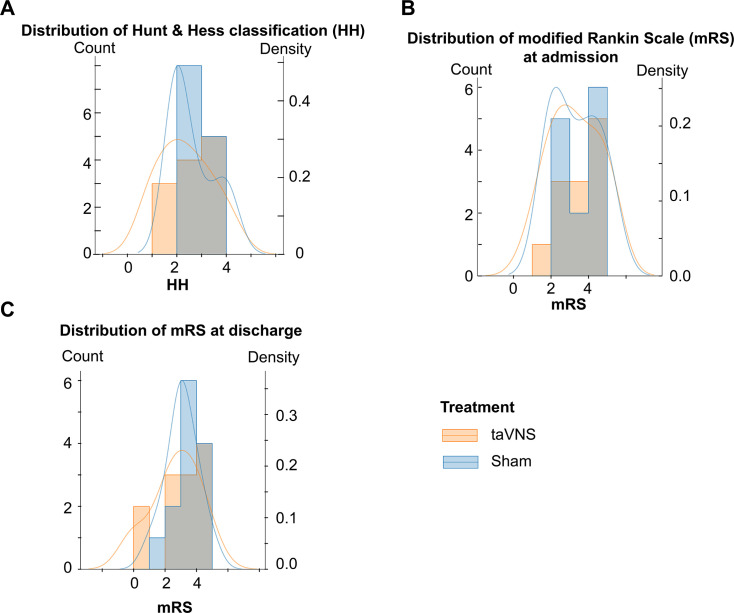
Methods: In this randomized clinical trial, 24 SAH patients were assigned to either a taVNS treatment or a sham treatment group. During their stay in the intensive care unit, we monitored patient electrocardiogram readings and vital signs. We compared long-term changes in heart rate, heart rate variability (HRV), QT interval, and blood pressure between the two groups. Additionally, we assessed the effects of acute taVNS by comparing cardiovascular metrics before, during, and after the intervention. We also explored acute cardiovascular biomarkers in patients exhibiting clinical improvement.

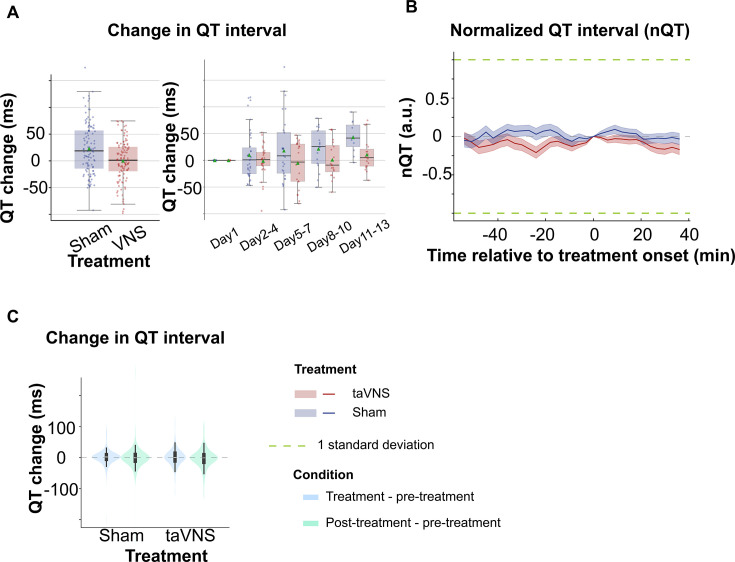
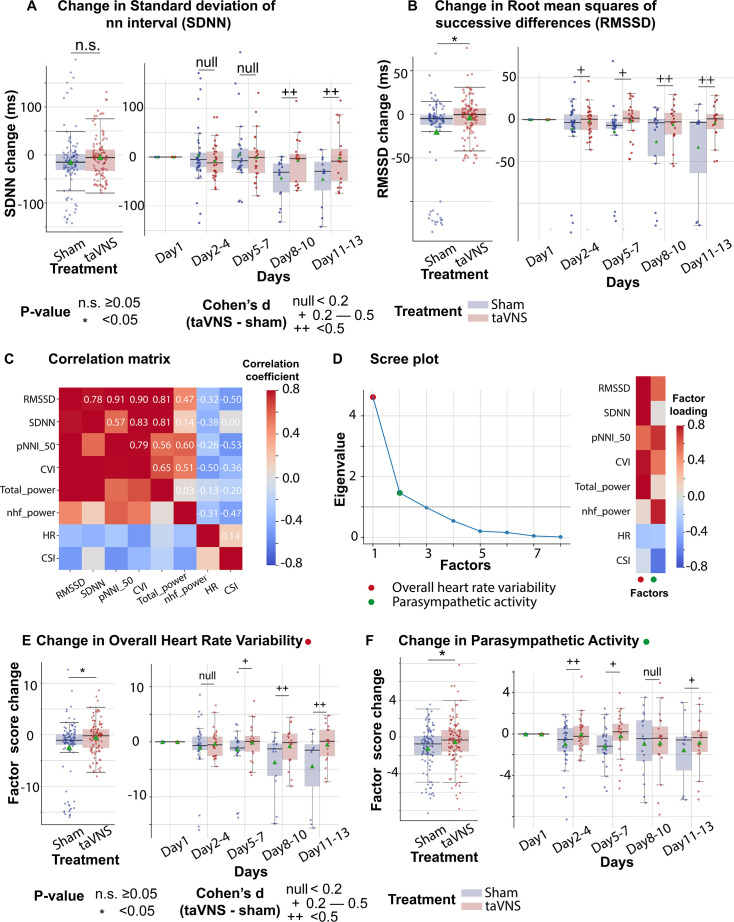
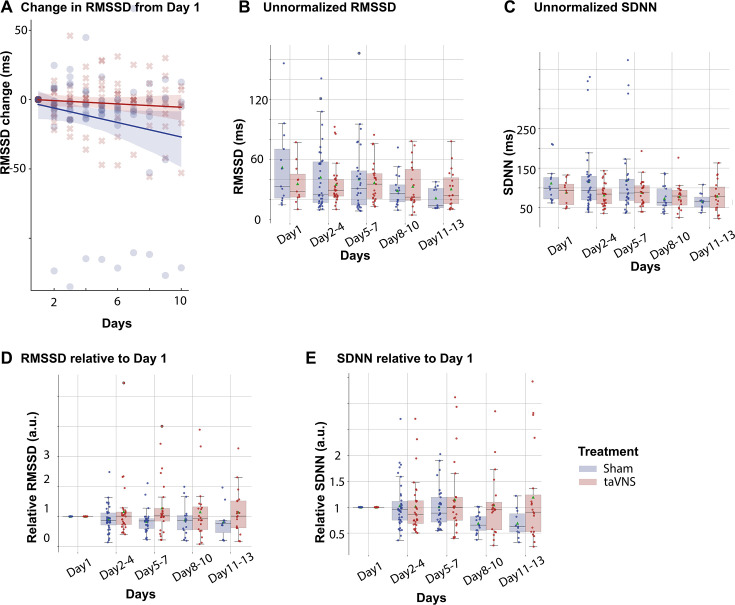
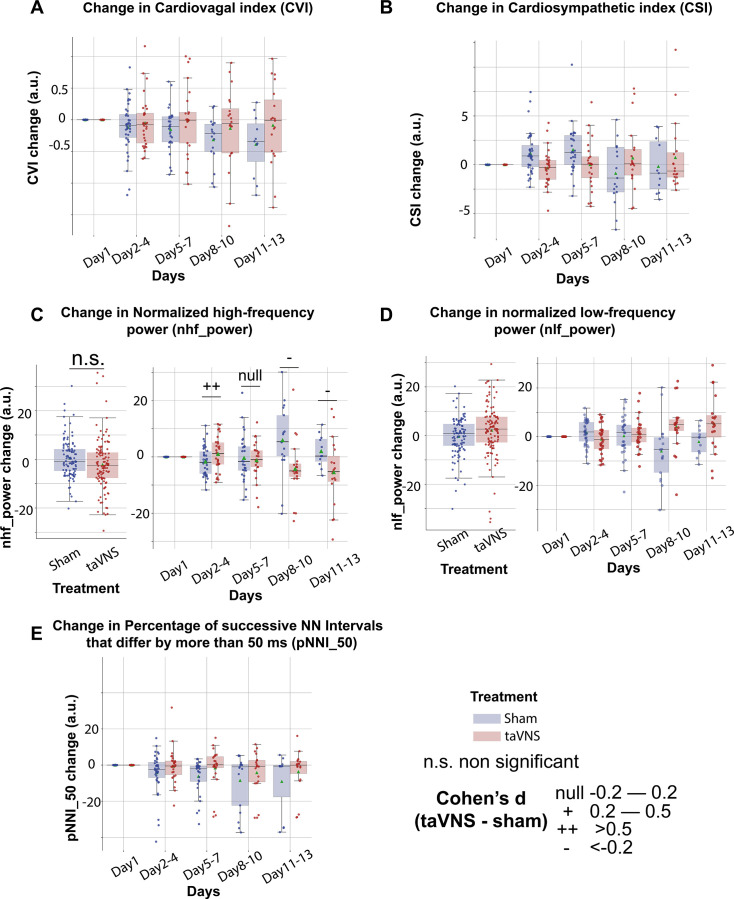
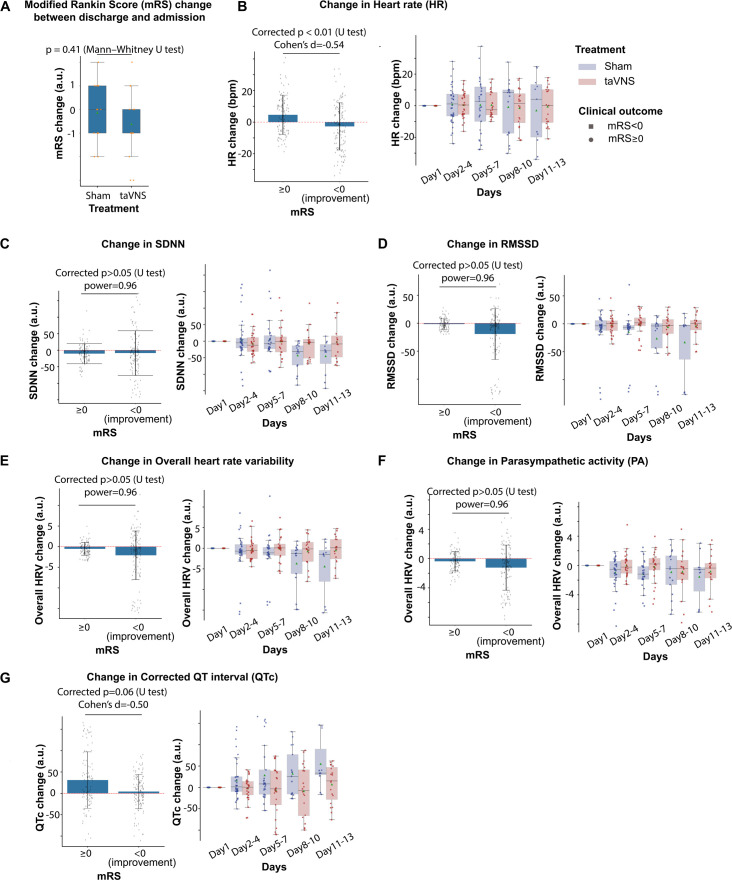
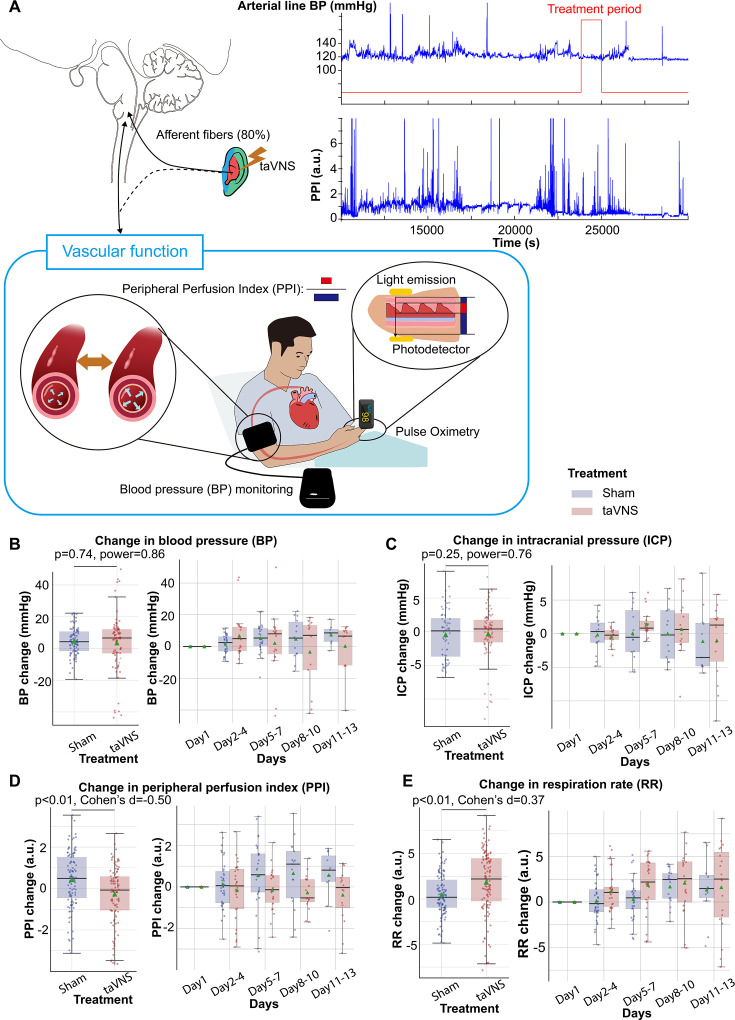
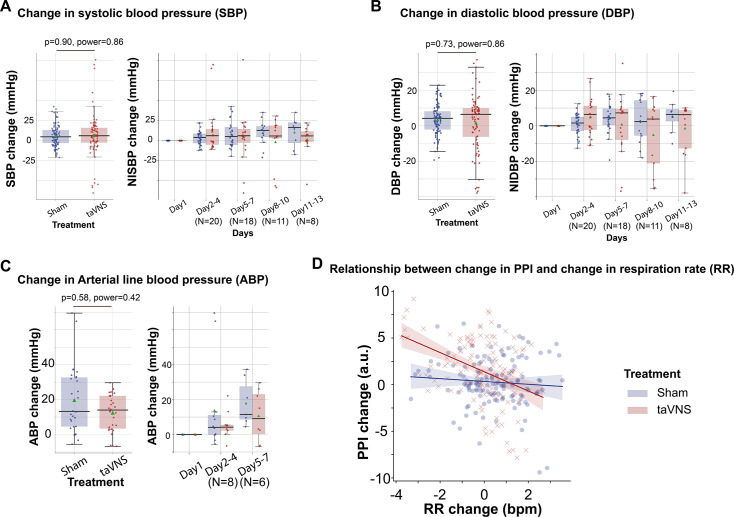
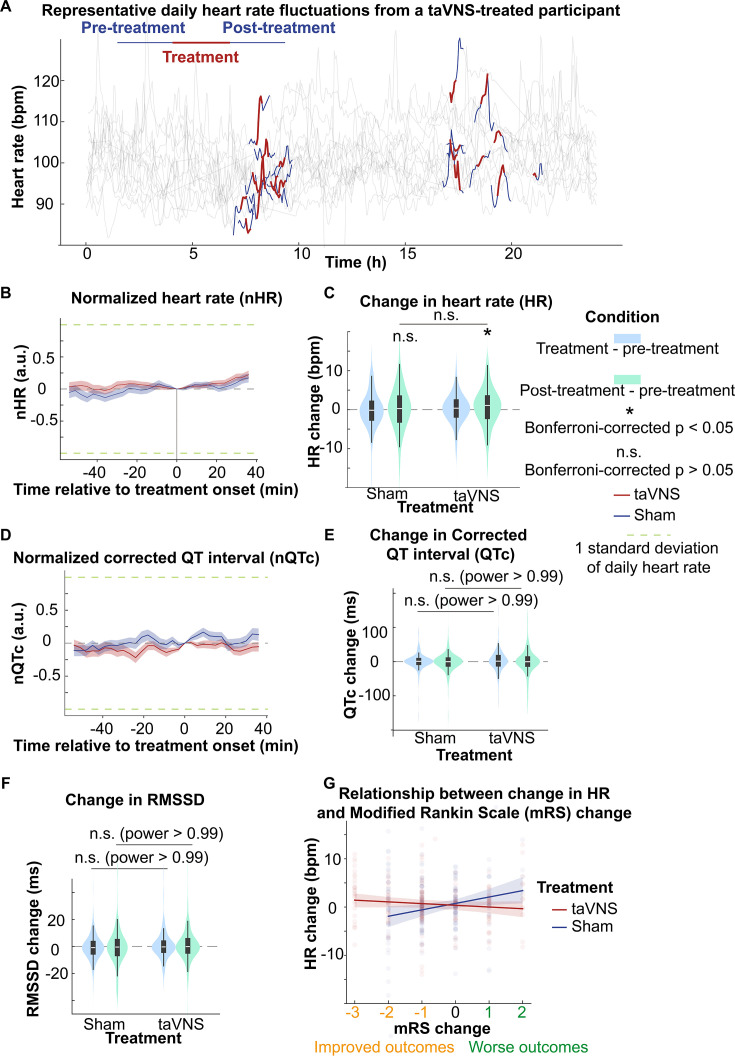
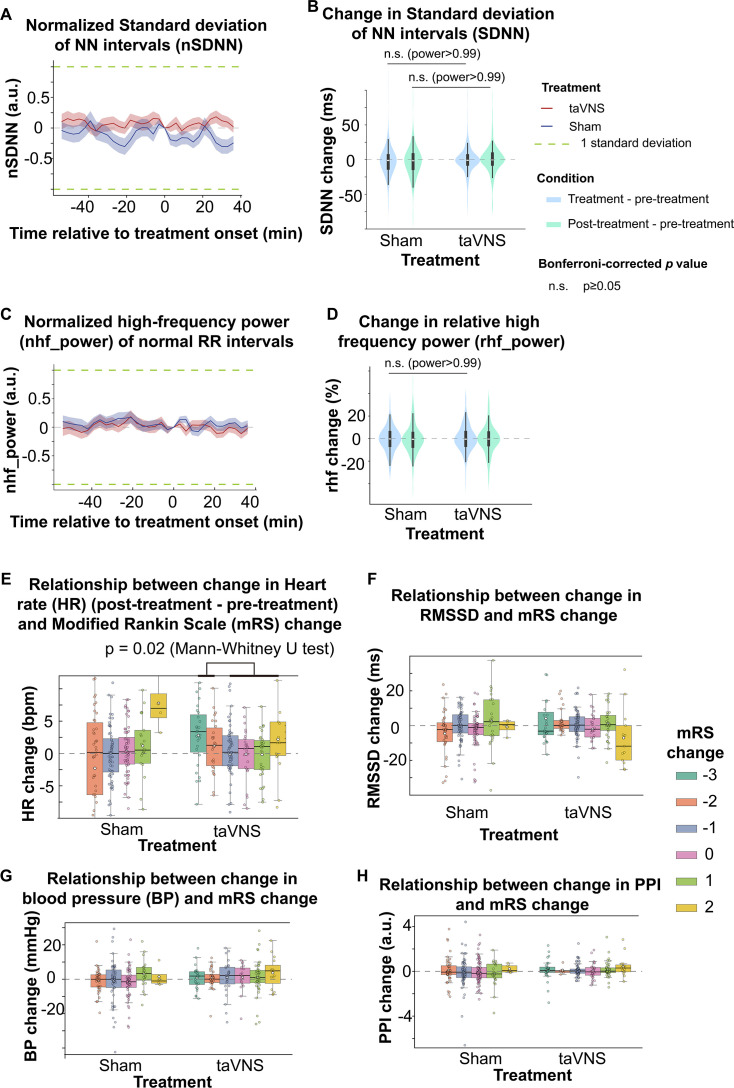
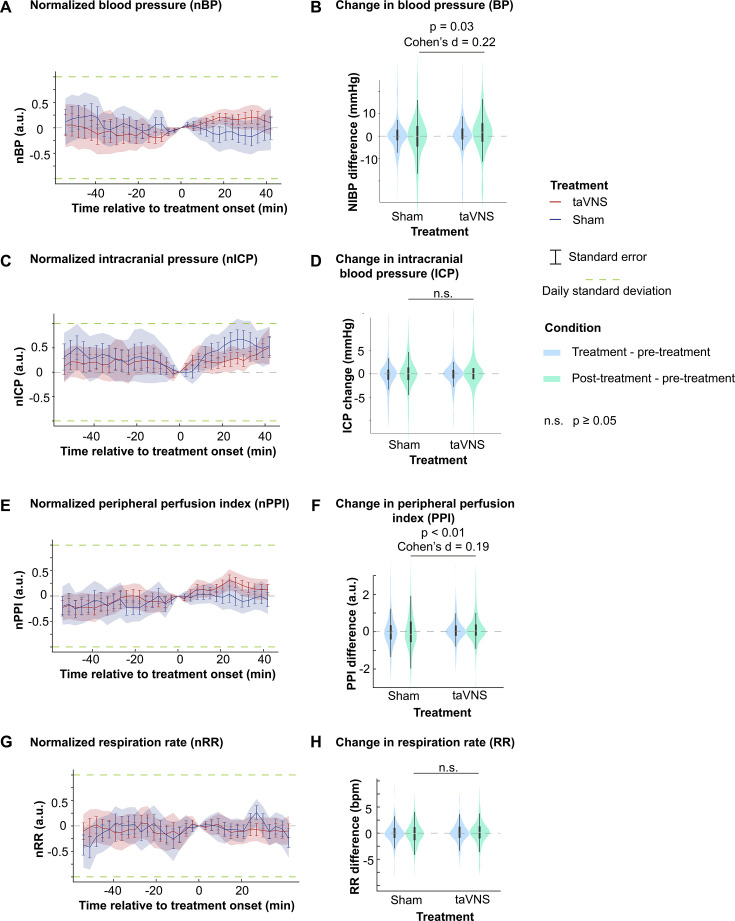
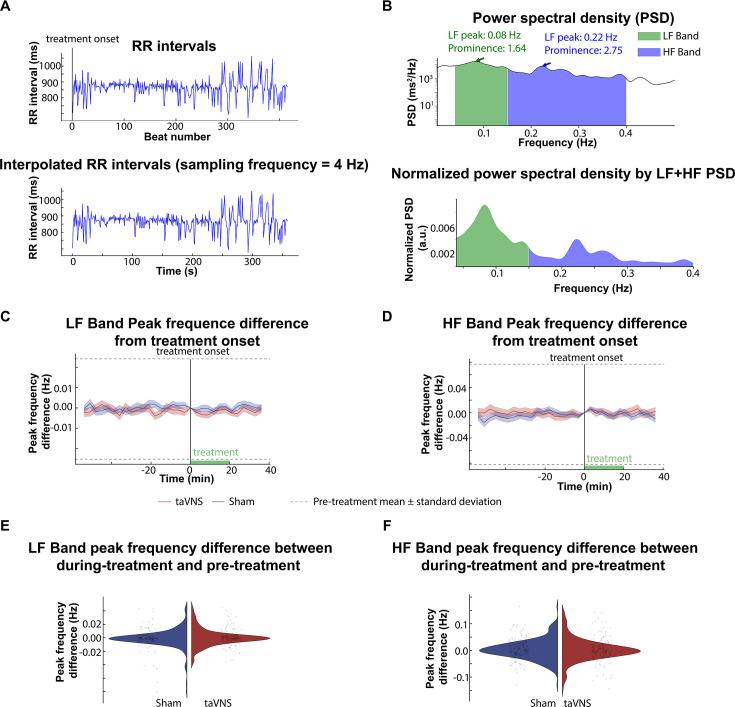
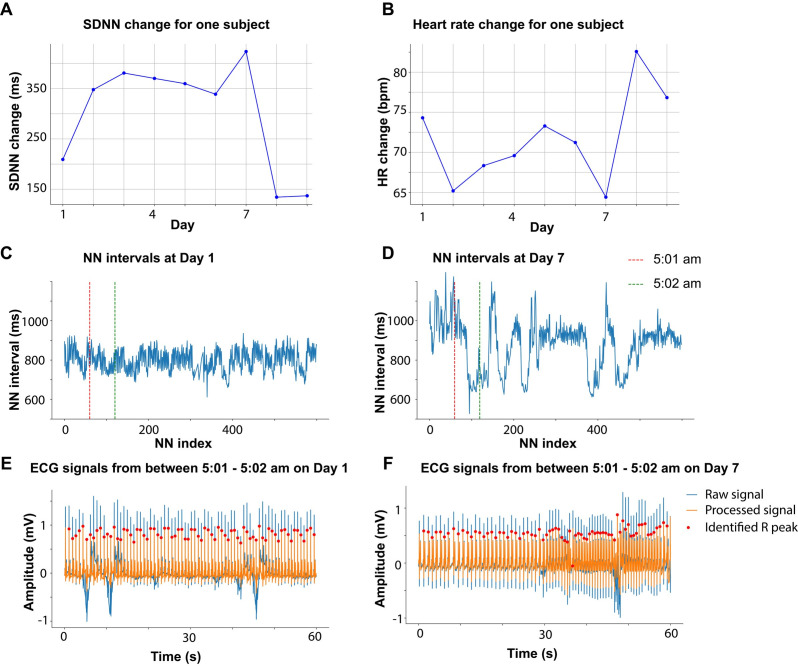
Results: We found that repetitive taVNS did not significantly alter heart rate, QT interval, blood pressure, or intracranial pressure (ICP). However, repetitive taVNS increased overall HRV and parasympathetic activity compared to the sham treatment. The increase in parasympathetic activity was most pronounced from 2 to 4 days after initial treatment (Cohen's d = 0.50). Acutely, taVNS increased heart rate, blood pressure, and peripheral perfusion index without affecting the corrected QT interval, ICP, or HRV. The acute post-treatment elevation in heart rate was more pronounced in patients who experienced a decrease of more than one point in their modified Rankin Score at the time of discharge.

Conclusions: Our study found that taVNS treatment did not induce adverse cardiovascular effects, such as bradycardia or QT prolongation, supporting its development as a safe immunomodulatory treatment approach for SAH patients. The observed acute increase in heart rate after taVNS treatment may serve as a biomarker for SAH patients who could derive greater benefit from this treatment.

Funding: The American Association of Neurological Surgeons (ALH), The Aneurysm and AVM Foundation (ALH), The National Institutes of Health R01-EB026439, P41-EB018783, U24-NS109103, R21-NS128307 (ECL, PB), McDonnell Center for Systems Neuroscience (ECL, PB), and Fondazione Neurone (PB).

Clinical trial number: NCT04557618.

Keywords: autonomic balance; cardiovascular; heart rate variability; human; medicine; neuroscience; subarachnoid hemorrhage; transcutaneous auricular vagus nerve stimulation.


Conflict of interest statement

GT, KD, PD, XL, ZL, MA, KL, AV, TK, JO, GZ, PB No competing interests declared, AH Has stock ownership in Aurenar, EL Has stock ownership in Neurolutions, Face to Face Biometrics, Caeli Vascular, Acera, Sora Neuroscience, Inner Cosmos, Kinetrix, NeuroDev, Inflexion Vascular, Aurenar, Cordance Medical, Silent Surgical, and Petal Surgical; consultant for E15, Neurolutions, Inc, Petal Surgical; Washington University owns equity in Neurolutions

Figures

Figure 1.
Figure 1.. Study rationale and clinical trial design.
(A) Immunomodulation neural pathways associated with vagus nerve stimulation include cholinergic anti-inflammatory pathway, sympathetic nervous system, and hypothalamic–pituitary–adrenal (HPA) axis. Immunogenic stimuli activate vagal afferents terminating primarily in the dorsal vagal complex. Ascending projections from the dorsal vagal complex reach the paraventricular nucleus (PVN) and rostral ventromedial medulla (RVM), activating the HPA axis and sympathetic system, respectively, to regulate the immune response. Transcutaneous auricular vagus nerve stimulation (taVNS) can affect cardiovascular function through the sympathetic system or efferent vagus nerve. (B, C) Clinical trial structure and treatment protocol. Patients in the taVNS group received electrical stimulation (0.4 mA, 250 µs pulse width, 20 Hz) for 20 min twice daily. Sham group patients wore the ear clip on the earlobe for the same duration. (D) Ear clip application for taVNS treatment.
Figure 2.
Figure 2.. The effects of transcutaneous auricular vagus nerve stimulation (taVNS) on cardiac function.
(A) Signals encoding treatment period and electrocardiogram (ECG) signals in a representative patient. (B) 3-lead ECG configuration in the intensive care unit. (C) P wave, T wave, and QRS complex are delineated from clean ECG II signals. (D, E) Heart rate and corrected QT interval changes from the first hospitalized day in the two treatment groups. (F) Changes in the percentage of prolonged QT from the first hospitalized day in the two treatment groups.
Figure 2—figure supplement 1.
Figure 2—figure supplement 1.. The effect of repetitive and acute transcutaneous auricular vagus nerve stimulation (taVNS) on uncorrected QT interval.
(A) QT interval changes from the first hospitalized day in the two treatment groups. (B) Normalized QT interval aligned at the treatment onset over time for the two treatment groups. The QT interval is normalized based on the mean and standard error of heart rate for each day. (C) The difference in QT intervals between the treatment period, post-treatment period, and pre-treatment period for the two treatment groups.
Figure 2—figure supplement 2.
Figure 2—figure supplement 2.. The distribution of Hunt & Hess classification and modified Rankin Scale for transcutaneous auricular vagus nerve stimulation (taVNS) and Sham groups.
(A) Hunt & Hess classification for both groups. (B–C) mRS at admission (B) and discharge (C) for patients in both groups. In each panel, the height of each histogram bar indicates the count (left y-axis). The overlaid curve represents the kernel density (right y-axis).
Figure 3.
Figure 3.. The effects of transcutaneous auricular vagus nerve stimulation (taVNS) on overall heart rate variability and parasympathetic activity.
(A, B) Changes in standard deviation of NN interval (SDNN) changes and root mean squares of successive differences over time for the two treatment groups. The color represents the treatment group. Green triangles represent the mean. (C) Correlation between standard electrocardiogram (ECG) features underlying autonomic activities. (D) Factor analysis showed that there are two factors underlying the standard ECG features. The first factor is referred to as overall heart rate variability. The second factor is referred to as parasympathetic activity. (E, F) The effect of taVNS on the two factors. pNNI_50: percentage of number of successive NN intervals that differ by more than 50 ms. CVI: cardiac vagal index. Total power: total power below 0.4 Hz of normal RR interval. nhf_power: relative power of the high-frequency band (0.15–0.4  Hz). CSI: cardiac sympathetic index.
Figure 3—figure supplement 1.
Figure 3—figure supplement 1.. Heart rate variability in transcutaneous auricular vagus nerve stimulation (taVNS) and Sham treatment groups.
(A) In the linear regression model (RMSSD change ~ Day * Treatment), the coefficient for interaction effect is 2.01 (p = 0.21), the coefficient for Day is −2.61 (p = 0.02), and the coefficient for Treatment is 1.38 (p = 0.88). RMSSD: root mean square of successive differences of normal RR intervals. SDNN: standard deviation of normal RR intervals. (B) Unnormalized RMSSD over time for the two treatment groups. (C) Unnormalized SDNN over time for the two treatment groups. (D) Relative RMSSD over time for the two treatment groups. (E) Relative SDNN over time for the two treatment groups.
Figure 3—figure supplement 2.
Figure 3—figure supplement 2.. Time- and frequency-domain cardiac measures in transcutaneous auricular vagus nerve stimulation (taVNS) and Sham treatment groups.
(A-E) show the changes of heart rate variability metrics following SAH. These standard heart rate variability metrics were used to perform factor analysis.
Figure 3—figure supplement 3.
Figure 3—figure supplement 3.. The normalized high-frequency power may not fully represent parasympathetic activity when the respiration rate exceeds 25 bpm.
(A) The relationship between frequency-domain HRV measures and respiration rate. (B) Increase in RR in the transcutaneous auricular vagus nerve stimulation (taVNS) treatment group was associated with reduction in normalized high-frequency power.
Figure 3—figure supplement 4.
Figure 3—figure supplement 4.. The impact of clinical outcome on heart rate variability.
(A) The change in modified Rankin Score (mRS) was similar between the transcutaneous auricular vagus nerve stimulation (taVNS) and Sham treatment groups. (B) Change in heart rate during treatment for both treatment groups, as compared to first hospitalized day, was lower in patients with improved mRS upon discharge (i.e., mRS change <0). (C–G) The relationship between improved mRS and changes in cardiovascular metrics. N(mRS < 0) = 122, N(mRS > 0) = 98.
Figure 4.
Figure 4.. Effects of repetitive transcutaneous auricular vagus nerve stimulation (taVNS) on vascular function.
(A) Representative vital signs and their physiology. Arterial line blood pressure (see Figure 4—figure supplement 1), intracranial pressure (ICP), and mean blood pressure measured regularly by nurses (BP) were recorded. Blood pressure is an index of vasodilation. Peripheral perfusion index (PPI) is the ratio between the pulsatile and the non-pulsatile blood flow, reflecting the cardiac output. (B, C) Mean BP and ICP changes from the first hospitalization day did not differ significantly between the treatment groups. (D, E) PPI change from the first hospitalized day was lower in the taVNS treatment group, while RR change was higher.
Figure 4—figure supplement 1.
Figure 4—figure supplement 1.. The effect of transcutaneous auricular vagus nerve stimulation (taVNS) on arterial line blood pressure monitoring and noninvasive blood pressure monitoring.
(A-C) Changes in systolic blood pressure (A), diastolic blood pressure (B), and arterial line blood pressure (C) from the first hospitalized day for the two treatment groups. (D) The relationship between changes in peripheral perfusion index (PPI) and changes in respiration rate (RR) for the two treatment groups. Mann–Whitney U tests were used to compare changes in blood pressure between treatment groups.
Figure 5.
Figure 5.. The acute effects of transcutaneous auricular vagus nerve stimulation (taVNS) on cardiac function.
(A) Daily fluctuation of heart rate of a subject receiving VNS treatment. The treatment period, a 20-min period before and after treatment, is highlighted. Note that a small proportion of electrocardiogram (ECG) signals to derive heart rate was missing due to the expected cyclical restarting of the monitoring system. (B, D) Normalized heart rate (QTc) aligned at the treatment onset over time for the two treatment groups. The heart rate (QTc) is normalized based on the mean and standard error of heart rate for each day. (C) The difference in HR between the treatment period, post-treatment period, and pre-treatment period for the two groups. Wilcoxon signed-rank test was used to test if the HR difference is statistically different from 0 in the VNS treatment group. Bonferroni-corrected p-value for HR difference between post-treatment and treatment period is 0.03 (N = 188, Cohen’s d = 0.1). Mann–Whitney U tests were used to compare cardiac function metric differences between the two treatment groups. (E, F) The difference in QTc and RMSSD between the treatment period, post-treatment period, and pre-treatment period for the two groups (G) The relationship between heart rate changes following acute taVNS and functional outcome.
Figure 5—figure supplement 1.
Figure 5—figure supplement 1.. Cardiac effects of acute transcutaneous auricular vagus nerve stimulation (taVNS).
(A, C) Temporal dynamics of normalized SDNN (high-frequency power). Normalized SDNN (high-frequency power) for the two treatment groups at the treatment onset was set to 0. The data is presented as a mean ± standard error. (B, D). Comparison of change in SDNN (relative high-frequency power) values from pre-treatment to treatment period (blue) and post-treatment period (green) between treatment groups. No significant differences were observed between treatment groups based on Mann–Whitney U tests. (E, F) The relationship between changes in the modified Rankin Scale (mRS) scores and changes in differential measures of cardiovascular parameters from pre-treatment to post-treatment periods. (G,H) The relationship between changes in mRS scores and changes in blood pressure (G) and PPI (H) for the two treatment groups.
Figure 5—figure supplement 2.
Figure 5—figure supplement 2.. Vascular effects of acute transcutaneous auricular vagus nerve stimulation (taVNS).
(A, C, E, G) (left) Temporal dynamics of normalized blood pressure (BP), intracranial blood pressure (ICP), peripheral perfusion index (PPI), and respiration rate (RR) in both treatment groups, aligned with the treatment onset. (B, D, F, H) (right) Comparison of change in BP, ICP, PPI, and RR from pre-treatment to treatment (blue) and post-treatment (green) periods. Mann–Whitney U tests were used to compare the change in vital signs between groups. The powers are >0.99 for RR and 0.98 for ICP.
Figure 5—figure supplement 3.
Figure 5—figure supplement 3.. The effect of acute transcutaneous auricular vagus nerve stimulation (taVNS) on peak frequencies within the high-frequency (HF) and the low-frequency (LF) bands.
To investigate the potential effects of acute taVNS treatment on the autonomic system, we analyzed the peak frequency of the HF and LF bands. (A). representative RR intervals over 6 min were linear interpolated for frequency-domain analysis. Ectopic beats and outliers were identified and corrected. (B). The power spectral density (PSD) of the interpolated RR intervals time series. Peak frequencies within the HF and LF bands and their prominence were calculated from the normalized power spectral density. (C, D) Changes in LF and HF peak frequencies over time, with peak frequencies at treatment onset (time 0) set as the baseline (0). (E, F) Comparison of the changes in peak frequencies between the during- and pre-treatment periods across treatment groups (LF band peak frequency: p = 0.54, Cohen’s d = –0.07; HF band peak frequency: p-value = 0.67, Cohen’s d = 0.04, t-test).
Author response image 1.

Update of

Similar articles

Cited by

References

    1. Addorisio ME, Imperato GH, de Vos AF, Forti S, Goldstein RS, Pavlov VA, van der Poll T, Yang H, Diamond B, Tracey KJ, Chavan SS. Investigational treatment of rheumatoid arthritis with a vibrotactile device applied to the external ear. Bioelectronic Medicine. 2019;5:4. doi: 10.1186/s42234-019-0020-4. - DOI - PMC - PubMed
    1. Bai X, Wang N, Si Y, Liu Y, Yin P, Xu C. The clinical characteristics of heart rate variability after stroke. The Neurologist. 2023;29:133–141. doi: 10.1097/NRL.0000000000000540. - DOI - PubMed
    1. Bazett HC. An analysis of the time-relations of electrocardiograms. Heart (British Cardiac Society) 1920;7:353–370.
    1. Bjerkne Wenneberg S, Löwhagen Hendén PM, Oras J, Naredi S, Block L, Ljungqvist J, Odenstedt Hergès H. Heart rate variability monitoring for the detection of delayed cerebral ischemia after aneurysmal subarachnoid hemorrhage. Acta Anaesthesiologica Scandinavica. 2020;64:945–952. doi: 10.1111/aas.13582. - DOI - PubMed
    1. Bonaz B, Sinniger V, Hoffmann D, Clarençon D, Mathieu N, Dantzer C, Vercueil L, Picq C, Trocmé C, Faure P, Cracowski J, Pellissier S. Chronic vagus nerve stimulation in Crohn’s disease: a 6‐month follow‐up pilot study. Neurogastroenterology & Motility. 2016;28:948–953. doi: 10.1111/nmo.12792. - DOI - PubMed

Publication types

Associated data

LinkOut - more resources