. 2025 May 15;27(4):948-962.
doi: 10.1093/neuonc/noae277.

A field resource for the glioma cerebrospinal fluid proteome: Impacts of resection and location on biomarker discovery

Affiliations

A field resource for the glioma cerebrospinal fluid proteome: Impacts of resection and location on biomarker discovery

Cecile Riviere-Cazaux et al. Neuro Oncol. .

Abstract

Background: While serial sampling of glioma tissue is rarely performed prior to recurrence, cerebrospinal fluid (CSF) is an underutilized longitudinal source of candidate glioma biomarkers for understanding therapeutic impacts. However, the impact of key variables to consider in longitudinal CSF samples for monitoring biomarker discovery, including anatomical location and post-surgical changes, remains unknown.

Methods: Aptamer-based proteomics was performed on 147 CSF samples from 74 patients; 71 of whom had grade 2-4 astrocytomas or grade 2-3 oligodendrogliomas. This included pre- versus post-resection intracranial CSF samples obtained at early (1-16 days; n = 20 patients) or delayed (86-153 days; n = 11 patients) time points for patients with glioma. Paired lumbar versus intracranial glioma CSF samples were also obtained (n = 14 patients).

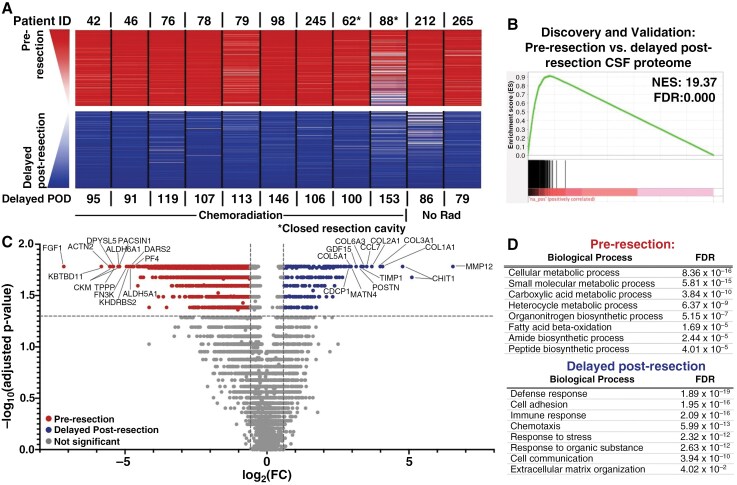
Results: Significant differences were identified in the CSF proteome between lumbar, subarachnoid, and ventricular CSF in patients with gliomas. Importantly, we found that resection had a significant, evolving longitudinal impact on the CSF proteome, with distinct sets of proteins present at different time points since resection. Our analysis of serial intracranial CSF samples suggests the early potential for disease monitoring and evaluation of pharmacodynamic impact of targeted therapies, such as bevacizumab and immunotherapies.

Conclusions: The intracranial glioma CSF proteome serves as a rich and dynamic reservoir of potential biomarkers that can be used to evaluate the effects of resection and other therapies over time. All data within this study, including detailed individual clinical annotations, are shared as a resource for the neuro-oncology community to collectively address these unanswered questions and further understand glioma biology through CSF proteomics.

Keywords: biomarker | cerebrospinal fluid | glioma | monitoring | proteomics.


Conflict of interest statement

F.M. is a co-founder of and has equity in Harbinger Health, has equity in Zephyr AI, and consults for Harbinger Health and Zephyr AI. She serves on the board of directors of Exscientia Plc. She declares that none of these relationships are directly or indirectly related to the content of this manuscript.

Figures

Figure 1.
Figure 1.
The CSF proteome differs by anatomical location. (A): (i) A volcano plot was generated by performing a series of Mann–Whitney U tests with Benjamini–Hochberg correction on GBM CSF samples obtained from the ventricular system (n = 20) versus the subarachnoid space (n = 23). Cutoffs were FC ≥1.5 and adjusted P-value ≤.05. (ii and iii) The ventricular and subarachnoid CSF samples were each split into half and categorized as discovery and validation cohorts (n = 10 each in discovery and validation for ventricular; n = 12 in discovery, and n = 11 in ventricular for the validation cohort), with subarachnoid versus ventricular CSF ranked fold-change lists generated for both cohorts. Enrichment analysis was performed to evaluate the enrichment of the discovery subarachnoid versus ventricular ranked fold-change list for the (ii) validation subarachnoid and (iii) validation ventricular CSF proteomes (top 350 proteins based on fold-change). Significance was set at normalized enrichment scores (NES) ≥10 and FDR <0.001. (B): (i) A volcano plot was generated by performing a series of Wilcoxon signed-rank tests with Benjamini–Hochberg correction on paired intracranial and lumbar CSF samples from patients with gliomas (n = 14). (ii and iii) The lumbar and intracranial pairs were split in half into discovery and validation cohorts (n = 7 pairs in each group), with paired intracranial versus lumbar ranked fold-change lists generated for both cohorts. Enrichment analysis was performed to evaluate the enrichment of the discovery intracranial versus lumbar ranked fold-change list for the (ii) validation intracranial and (ii) validation lumbar CSF proteomes. (iv) Hierarchical clustering was performed on the paired lumbar and intracranial CSF samples using the top 5% (350 proteins) of proteins via t-test. (v) Ranked average fold-change lists were generated using the paired intracranial versus lumbar patient samples based on anatomical location (ventricle, subarachnoid, or resection cavity). Enrichment analysis was performed to evaluate the enrichment of each ranked list for proteomic libraries consisting of the top 5% (350 proteins) of proteins from the average paired intracranial versus LP lists. All FDR = 0.000. Significance was set at NES ≥ 10 and FDR < 0.001.
Figure 2.
Figure 2.
Glioma resection impacts the CSF proteome early after surgery. (A) Ranked fold-change lists were generated from each patient’s paired pre- versus post-early resection (POD ≤ 35) CSF samples (n = 20). Ranked protein order is shown as a heatmap from 1 (higher pre-resection; top) to 7011 (higher early post-resection; bottom). The average rank across all 20 patients was used to list proteins. The top and bottom 200 proteins are shown. (B) The 20 pre- versus early post-resection CSF pairs were split into half and categorized as discovery and validation cohorts based on sequential order. Enrichment analysis of the discovery post- versus pre-early resection ranked fold-change list was performed for the validation pre-resection CSF proteome. (C) A volcano plot was generated by performing a series of Wilcoxon signed-rank tests with Benjamini–Hochberg correction on the paired pre- versus early post-resection CSF samples (n = 20). Cutoffs were FC ≥ 1.5 and adjusted P-value ≤ .05. (D) Functional protein network analysis was performed via STRING.db on the top 200 proteins significantly elevated prior to versus early after resection based on FC in Figure 2C. Gene ontology (GO) processes and their FDRs are reported. Significance was set at NES ≥ 10 and FDR < 0.001 for all enrichment analyses.
Figure 3.
Figure 3.
There is an evolving signature of resection between the early and delayed time points independent of chemoradiation. (A) Similar analyses to Figure 2A were performed for the paired early versus delayed post-resection CSF samples (n = 9 pairs; Figure 2). (B) Discovery cohort had 5 pairs of samples while the validation cohort had 4 pairs, based on sequential patient number. Significance was set at NES ≥ 10 and FDR < 0.001 for all enrichment analyses. (C) A volcano plot was generated by performing a series of Wilcoxon signed-rank tests with Benjamini–Hochberg correction on the paired early- versus-delayed post-resection CSF samples (n = 9). Cutoffs were FC ≥ 1.5 and adjusted P-value ≤ .05. (D) Functional protein network analysis was performed via STRING.db on the top 200 proteins significantly elevated at the early versus delayed time point after resection based on FC in Figure 3C. Gene ontology (GO) processes and their FDRs are reported. Significance was set at NES ≥ 10 and FDR < 0.001 for all enrichment analyses.
Figure 4.
Figure 4.
There is a conserved signature of resection between the baseline and delayed post-resection time point. (A) Similar analyses to Figures 2A and 3A were again performed using the pre-resection versus delayed post-resection CSF samples (n = 11 pairs). (B) Discovery cohort had 6 pairs of samples, while the validation cohort had 5 pairs, based on sequential patient order. Significance was set at NES ≥ 10 and FDR < 0.001 for all enrichment analyses. (C) A volcano plot was generated by performing a series of Wilcoxon signed-rank tests with Benjamini–Hochberg correction on the paired pre- versus-delayed post-resection CSF samples (n = 11). Cutoffs were FC ≥ 1.5 and adjusted P-value ≤ .05. (D) Functional protein network analysis was performed via STRING.db on the top 200 proteins significantly elevated at the pre-resection versus delayed post-resection time points based on FC in Figure 4C. Gene ontology (GO) processes and their FDRs are reported. Significance was set at NES ≥ 10 and FDR < 0.001 for all enrichment analyses.
Figure 5.
Figure 5.
The impact of resection evolves over time and is detectable at recurrence. (A): (i) The abundance of the top 10 proteins unique to each time point is shown for 9 patients with gliomas who had CSF samples acquired intra-operatively, early post-resection (POD ≤ 35), and delayed post-resection (POD ≥ 70). Proteins unique to each time point were found by identifying the proteins that were significantly elevated (FC ≥ 1.5, adjusted P ≤ .05) at that time point when compared to both of the other time points. The fold-change in bloody versus clean CSF samples (n = 7 pairs) is also shown. (ii) The abundance of the top 10 plasma-associated proteins (based on paired bloody versus clean CSF samples) is shown for these patients’ samples. (B) The abundance at each time point for each patient is shown for (i) fibroblast growth factor 1 (FGF1), (ii) histone 2B Type 3-B (H2BU1), and (iii) growth differentiation factor-15 (GDF-15), which were in the top 10 proteins at the pre-resection, early post-resection, and delayed post-resection time points, respectively. (C) (I and ii) Chitotriosidase-1 (CHIT1) was evaluated in the pre-resection, early post-resection, and delayed post-resection time points, as well as in primary (n = 31) versus recurrent (n = 21) GBM samples acquired intra-operatively.
Figure 6.
Figure 6.
Intracranial CSF can be acquired longitudinally for evaluation of candidate monitoring biomarkers and pharmacodynamic impact of therapies. (A) Brevican (BCA), epidermal growth factor receptor (EGFR), growth differentiation factor-15 (GDF-15), vascular endothelial growth factor-A (VEGF-A), and glial fibrillary acidic protein (GFAP) were evaluated in intracranial CSF from Patient 24, who had a recurrent GBM with known EGFR amplification. The first box on the x-axis = days on CCNU; the second box on the x-axis = days on bevacizumab. (B) The normalized RFUs of BCAN, GFAP, and VEGF-A were evaluated over time in longitudinal intracranial CSF obtained from a patient with an astrocytoma, IDH-mutant, grade 4 via an Ommaya reservoir. d-2-Hydroxyglutarate (d-2-HG) was also evaluated at each time point. The first box on the x-axis = days during which patient underwent chemoradiation; the second box on the x-axis = days on adjuvant temozolomide (adj. TMZ). (C) BCAN, GFAP, and VEGF-A were evaluated in longitudinal intracranial CSF from a patient with an astrocytoma, IDH-mutant, grade 4, as well as d-2-HG. Additionally, the T1-post-gadolinium–positive (T1 + Gad) volume was calculated from MRIs obtained at each time point. The first box on the x-axis = days during which patient underwent chemoradiation; the second box on the x-axis = days on adjuvant temozolomide (adj. TMZ). (D) The top 10 proteins based on fold-change are shown for post- versus pre-treatment with (i) bevacizumab in Patient 24 from Figure 4A, as well as (ii) post- versus pre-pembrolizumab in Patient 79, who had a GBM with a hypermutated phenotype.

References

    1. Weller M, Wick W, Aldape K, et al. Glioma. Nat Rev Dis Primers. 2015;1(1):15017. - PubMed
    1. Law M, Yang S, Wang H, et al. Glioma grading: sensitivity, specificity, and predictive values of perfusion MR imaging and proton MR spectroscopic imaging compared with conventional MR imaging. AJNR Am J Neuroradiol. 2003;24(10):1989–1998. - PMC - PubMed
    1. Bernstock JD, Gary SE, Klinger N, et al. Standard clinical approaches and emerging modalities for glioblastoma imaging. Neurooncol Adv. 2022;4(1):vdac080. - PMC - PubMed
    1. Wen PY, Bent M, Youssef G, et al. RANO 2.0: update to the response assessment in neuro-oncology criteria for high- and low-grade gliomas in adults. J Clin Oncol. 2023;41(33):5187–5199. - PMC - PubMed
    1. Huang RY, Neagu MR, Reardon DA, Wen PY. Pitfalls in the neuroimaging of glioblastoma in the era of antiangiogenic and immuno/targeted therapy–detecting illusive disease, defining response. Front Neurol. 2015;6:33. - PMC - PubMed