. 2025 Jan 17;31(1):gaae045.
doi: 10.1093/molehr/gaae045.

Animal and vegetal materials of mouse oocytes segregate at first zygotic cleavage: a simple mechanism that makes the two-cell blastomeres differ reciprocally from the start

Affiliations

Animal and vegetal materials of mouse oocytes segregate at first zygotic cleavage: a simple mechanism that makes the two-cell blastomeres differ reciprocally from the start

Thomas Nolte et al. Mol Hum Reprod. .

Abstract

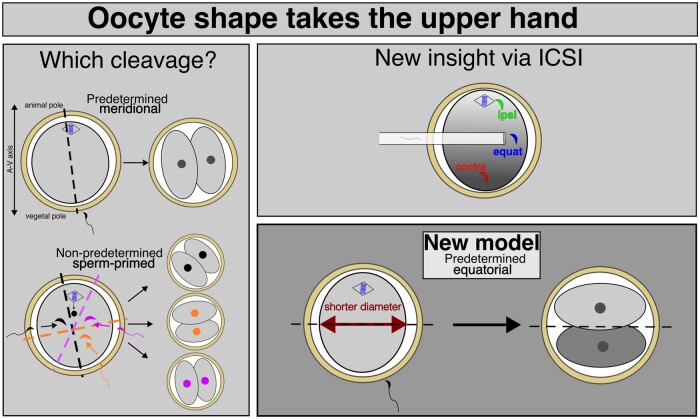
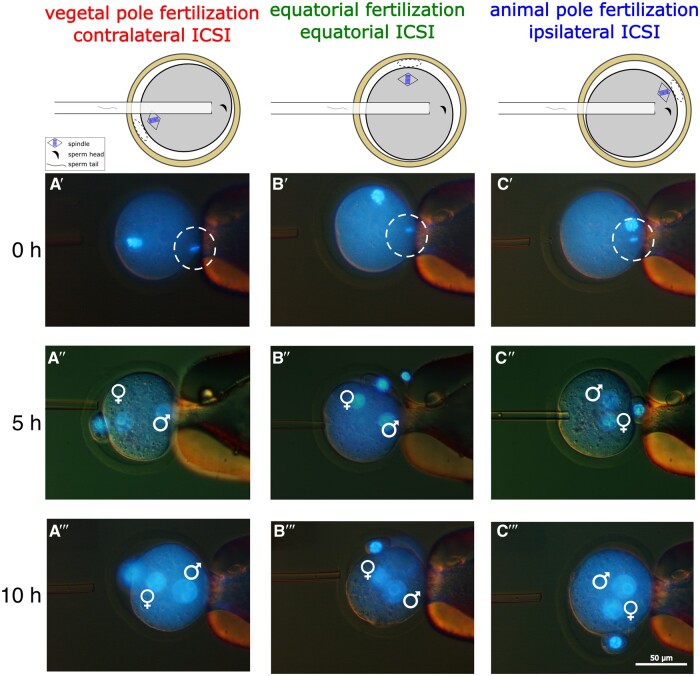
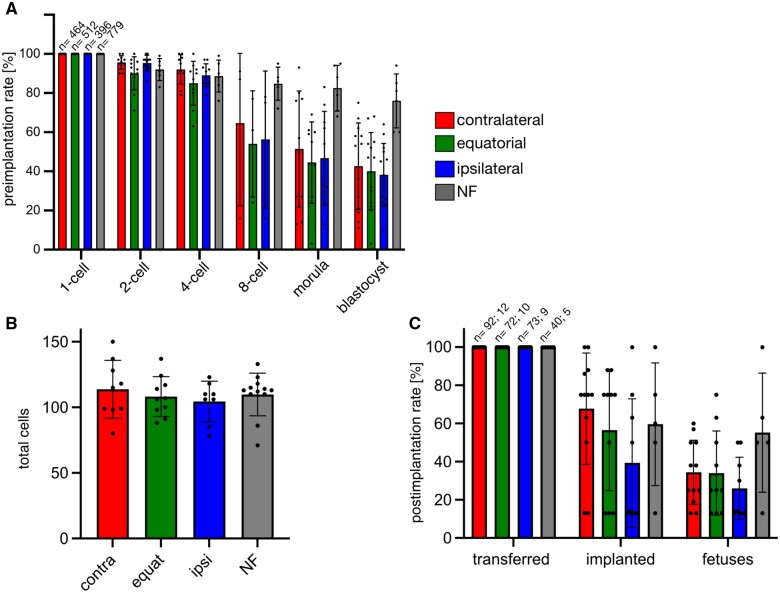
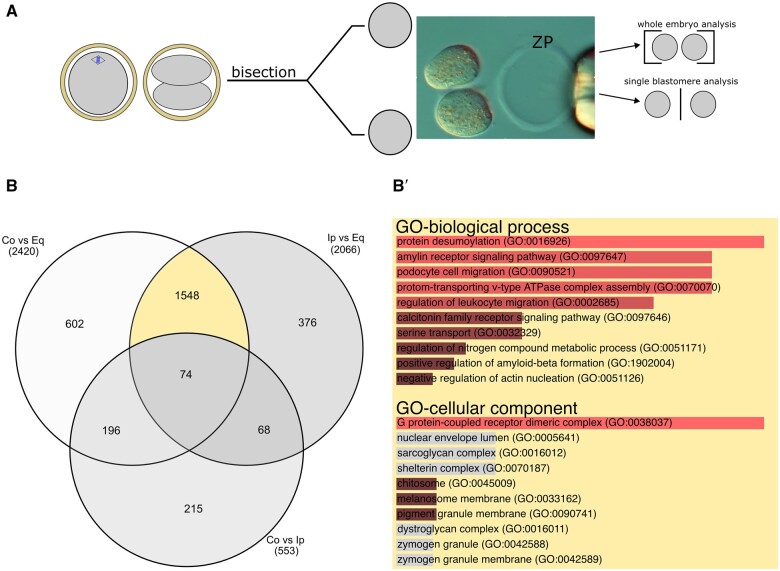
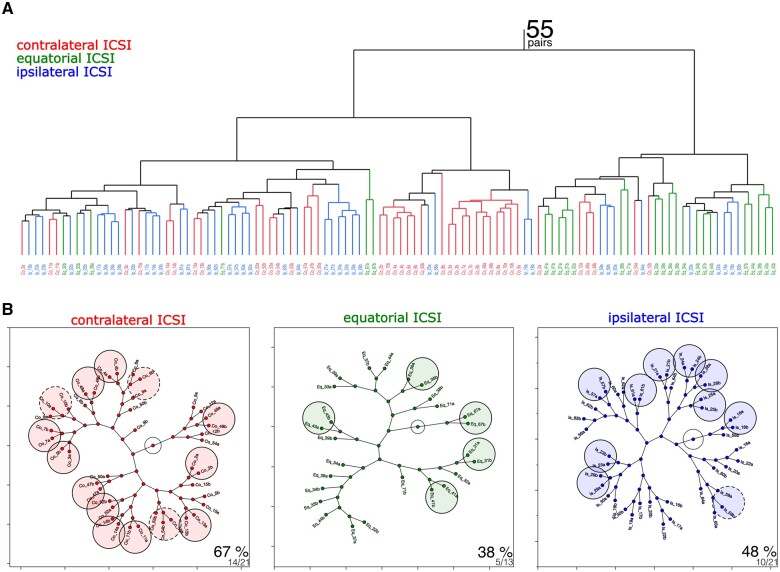
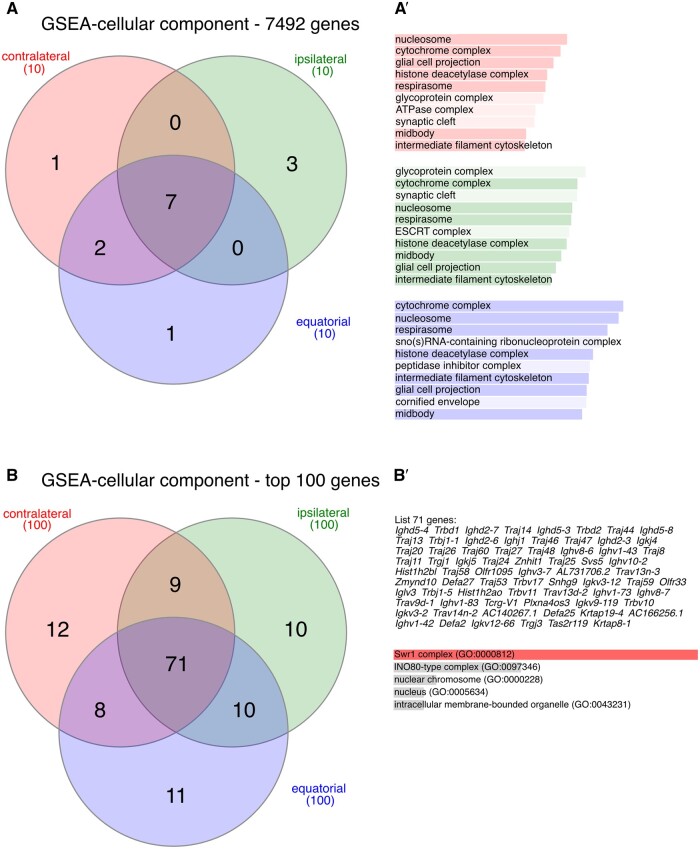
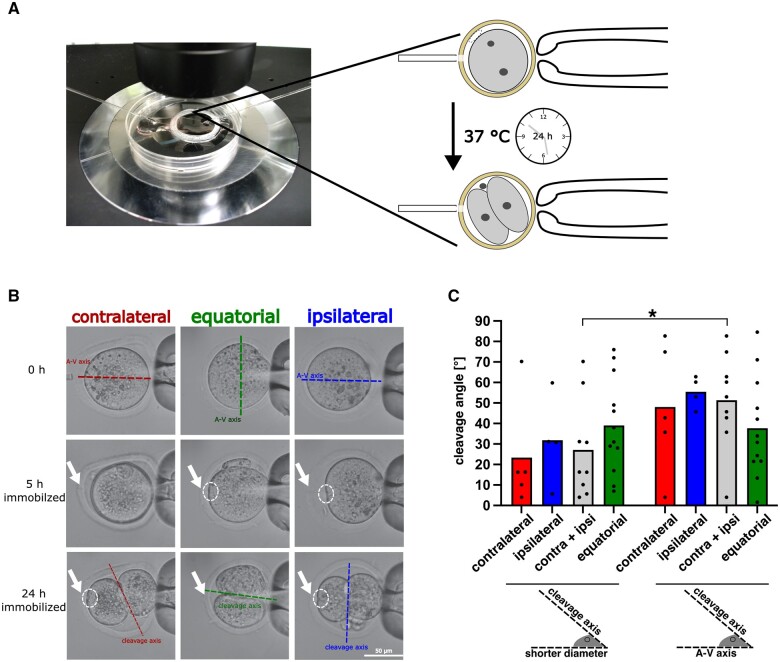
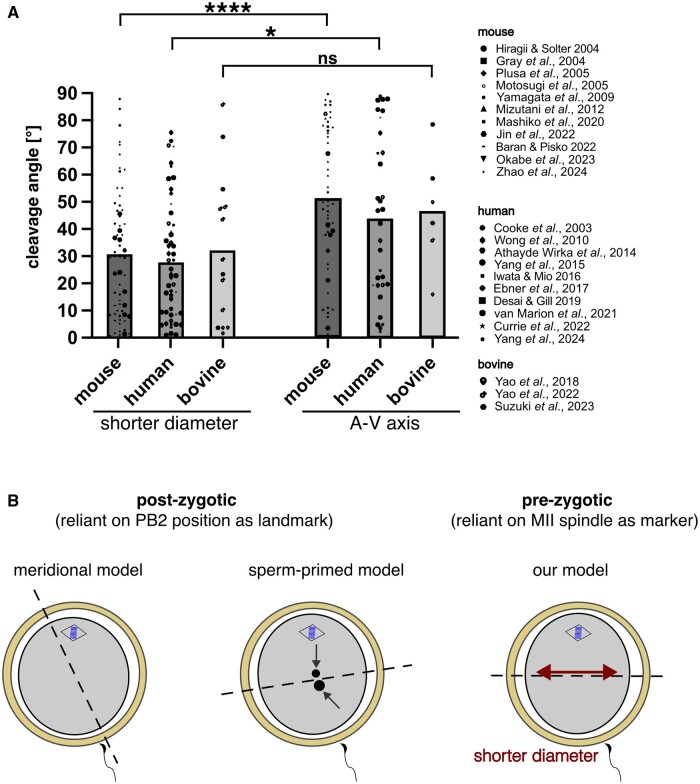
Recent advances in embryology have shown that the sister blastomeres of two-cell mouse and human embryos differ reciprocally in potency. An open question is whether the blastomeres became different as opposed to originating as different. Here we wanted to test two relevant but conflicting models: one proposing that each blastomere contains both animal and vegetal materials in balanced proportions because the plane of first cleavage runs close to the animal-vegetal axis of the fertilized oocyte (meridional cleavage); and the other model proposing that each blastomere contains variable proportions of animal and vegetal materials because the plane of the first cleavage can vary - up to an equatorial orientation - depending on the topology of fertilization. Therefore, we imposed the fertilization site in three distinct regions of mouse oocytes (animal pole, vegetal pole, equator) via ICSI. After the first zygotic cleavage, the sister blastomeres were dissociated and subjected to single-cell transcriptome analysis, keeping track of the original pair associations. Non-supervised hierarchical clustering revealed that the frequency of correct pair matches varied with the fertilization site (vegetal pole > animal pole > equator), thereby, challenging the first model of balanced partitioning. However, the inter-blastomere differences had similar signatures of gene ontology across the three groups, thereby, also challenging the competing model of variable partitioning. These conflicting observations could be reconciled if animal and vegetal materials were partitioned at the first cleavage: an event considered improbable and possibly deleterious in mammals. We tested this occurrence by keeping the fertilized oocytes immobilized from the time of ICSI until the first cleavage. Image analysis revealed that cleavage took place preferentially along the short (i.e. equatorial) diameter of the oocyte, thereby partitioning the animal and vegetal materials into the two-cell blastomeres. Our results point to a simple mechanism by which the two sister blastomeres start out as different, rather than becoming different.

Keywords: ICSI; animal model; blastomere; embryo development; fertilization; gene expression; oocyte.


Conflict of interest statement

M.B. is the current Editor-in-Chief of MHR (but had no involvement in any aspect of this article’s review process). The other authors declare no competing interests.

Figures

Graphical Abstract
Graphical Abstract
Current models disagree on the orientation of first zygotic division in relation to the sperm entry site. Through ICSI, we revealed that the oocyte shape prevails over the sperm entry site.
Figure 1.
Figure 1.
Sperm deposition at specifically predefined sites of the mouse ooplasm relative to the position of the MII spindle. (A–C) MII mouse oocytes (B6C3F1) at 14–15 h post-hCG were held in position by gentle suction of the zona pellucida with a holding pipette at the 3 o’clock position and subcortically injected with a single sperm head (CD1) using a piezo-driven needle approaching from the 9 o’clock position. (A′–C′) A single sperm head (encircled) was deposited in the cortical ooplasm opposite the spindle, i.e. contralateral (vegetal pole), half-way between poles (equator), or next to the spindle, i.e. ipsilateral (animal pole) of MII oocytes preloaded with Hoechst 33342. (A″–C″) Two pronuclei (♂♀) had formed 5 h after ICSI, attesting that the activation of the oocytes had been successful. (A″′–C″′) Pronuclei had enlarged and moved further toward the centre of the oocyte 10 h after ICSI. Blue colour in photographs is from DNA staining with Hoechst 33342 (1 µg/ml). MII, metaphase II.
Figure 2.
Figure 2.
Full development after site-specific ICSI. (A) Blastocysts formed at rates not significantly different from each other in all three ICSI groups (contralateral 43 ± 22%, equatorial 40 ± 20%; ipsilateral 38 ± 16%; P > 0.555; Wilcoxon test), albeit lower than those of oocytes subjected to natural fertilization (NF; 76 ± 14%; P < 0.004; Wilcoxon test). The starting number of zygotes is written at the top of the one-cell bars of the histogram. (B) Blastocysts’ total cell numbers were similar across all groups (contralateral ICSI 114 ± 6; equatorial ICSI 108 ± 6; ipsilateral ICSI 104 ± 6; NF 110 ± 5; P > 0.229; Wilcoxon test). Numbers of blastocysts counted in (B): contralateral = 9; equatorial = 10; ipsilateral = 8; NF = 12. (C) After transfer to the uteri of pseudo-pregnant females, blastocysts from oocytes fertilized by ICSI developed to term at rates not significantly different from each other (contralateral = 34 ± 17%; equatorial = 34 ± 22%; ipsilateral = 26 ± 16%; P > 0.233, Wilcoxon test), albeit lower than the rates of NF counterparts (55 ± 31%; P > 0.073, Wilcoxon test). Starting numbers of transferred blastocysts and recipient mothers are written at the top of the leftmost bars of the histogram. Data presented in A–C are means and standard deviations; black dots represent the individual replicates.
Figure 3.
Figure 3.
Different fertilization topologies lead to distinct gene expression profiles in two-cell embryos. (A) Scheme and representative image of a two-cell embryo being bisected at 22–24 h post-ICSI to generate single blastomeres for single cell RNA-seq (110 cells, 7492 mRNAs; GSE241089). The transcriptomes were either added together for analysis at the whole embryo level or kept distinct for analysis at the inter-blastomere level (Figs. 4 and 5). (B) Venn diagram representation (rendered with InteractiVenn; Heberle et al., 2015) of the differences in gene expression between whole two-cell embryos of the three ICSI groups. (B′) GO terms enriched in the subset of 1548 genes representing those potentially affected by ICSI-inflicted DNA damage on the spindle (GO analysis performed with Enrichr; Chen et al., 2013). Co, contralateral ICSI; Eq, equatorial ICSI; GO, gene ontology; Ip, ipsilateral ICSI; ZP, zona pellucida.
Figure 4.
Figure 4.
Different fertilization topologies lead to distinct differences of gene expression between the monozygotic blastomeres. (A) Following contralateral, equatorial or ipsilateral ICSI, the individual blastomeres’ transcriptomes (110 cells, 7492 mRNAs; GSE241089) were subjected to non-supervised hierarchical clustering analysis to see if they would return the original three ICSI groups. (B) Within the ICSI groups, the individual blastomeres’ transcriptomes were rendered as constellation diagrams to appreciate how often each blastomere would be matched correctly to the companion blastomere (encircled). Circles with solid line indicate perfect matches, circles with dotted line indicate near-perfect matches (i.e. the blastomeres and its companion blastomere are separated by a single node). The proportions shown at the bottom-right corners of constellation diagrams indicate the number of matches over the number of pairs, and the corresponding percentage. The pairs were coded as follows: ‘Co’ or ‘Eq’ or ‘Ip’ _Embryo number_‘a’ or ‘b’, to indicate the one or the other blastomere (‘a’ or ‘b’) of a given embryo (‘Embryo number’) from contralateral (Co), equatorial (Eq) or ipsilateral (Ip) ICSI.
Figure 5.
Figure 5.
Gene set enrichment analysis (GSEA) of the inter-blastomere differences of gene expression. (A) Venn diagram representation (InteractiVenn; Heberle et al., 2015) of the top-10 GO-CC terms found enriched (Webgestalt; Zhang et al., 2005; Elizarraras et al., 2024) in the full set (7492 mRNAs) of inter-blastomere differences (ranked) after contralateral, equatorial and ipsilateral ICSI. Seven of the 10 terms are common to the three groups. (A′) The seven common GO-CC terms are shown darkened in the bar chart. (B) Venn diagram representation of the top-100 inter-blastomere differences after contralateral, equatorial, and ipsilateral ICSI. (B′) The shared 71 genes were subjected to GO analysis (Enrichr; Chen et al., 2013), returning the ‘Swr1 complex’ which is related to meiosis. GO-CC, gene ontology–cellular component.
Figure 6.
Figure 6.
The shorter diameter of MII oocytes overrides the effect of the fertilization site in MII mouse oocytes. (A) Overview of the micromanipulation chamber placed on ThermoPlate at 37°C on the stage of the inverted microscope. One oocyte (B6C3F1) at a time was injected with a single sperm head (CD1). After injection the oocyte was not released but held in position (immobilized) for 24 h in the micromanipulation chamber, thereby allowing for pronuclear formation and first cleavage. (B) Representative images of oocytes of each ICSI group, showing the A–V axis of oocytes, the cleavage axis, and the ICSI hole in the zona pellucida (ZP; white arrow) as well as the dent left by the ICSI needle in the oolemma (white circle). (C) Distribution of angles (°) of departure of first cleavage axis from shorter diameter or from A–V axis of MII oocyte, according to the type of ICSI. The angles are smaller, i.e. the first cleavage is closer to the shorter diameter and reach statistical significance when the polar ICSIs (contra, ipsi) are combined (*P = 0.0391; Wilcoxon test).
Figure 7.
Figure 7.
Re-analysis of publicly available time-lapse imaging datasets and proposal for a new model of first zygotic cleavage. (A) Histogram shows the angle (°) of departure of the first cleavage axis from the shorter diameter versus A–V axis of zygotes in three mammalian species. Angle (ordinate) versus species (abscissa) is shown for each scored oocyte of each study (note the symbols to the right side of the histogram). The angle of first cleavage is closer to the shorter diameter than to the A–V axis (mouse, ****P < 0.0001; human, *P = 0.0136; bovine, ns, P = 0.2391; Wilcoxon test). (B) Summary of the previous models of first zygotic cleavage (based on post-zygotic observations) compared to our proposed model (based on pre-zygotic observations). A–V, animal-vegetal; PB2, second polar body; MII, metaphase II.

Similar articles

Cited by

References

    1. Ajduk A, Ilozue T, Windsor S, Yu Y, Seres KB, Bomphrey RJ, Tom BD, Swann K, Thomas A, Graham C et al. Rhythmic actomyosin-driven contractions induced by sperm entry predict mammalian embryo viability. Nat Commun 2011;2:417. - PMC - PubMed
    1. Antczak M, Van Blerkom J. Oocyte influences on early development: the regulatory proteins leptin and STAT3 are polarized in mouse and human oocytes and differentially distributed within the cells of the preimplantation stage embryo. Mol Hum Reprod 1997;3:1067–1086. - PubMed
    1. Antczak M, Van Blerkom J. Temporal and spatial aspects of fragmentation in early human embryos: possible effects on developmental competence and association with the differential elimination of regulatory proteins from polarized domains. Hum Reprod 1999;14:429–447. - PubMed
    1. Armant DR, Kaplan HA, Lennarz WJ. Fibronectin and laminin promote in vitro attachment and outgrowth of mouse blastocysts. Dev Biol 1986;116:519–523. - PubMed
    1. Athayde Wirka K, Chen AA, Conaghan J, Ivani K, Gvakharia M, Behr B, Suraj V, Tan L, Shen S. Atypical embryo phenotypes identified by time-lapse microscopy: high prevalence and association with embryo development. Fertil Steril 2014;101:1637–1648 e1631-1635. - PubMed

LinkOut - more resources