

CAGI6 ID panel challenge: assessment of phenotype and variant predictions in 415 children with neurodevelopmental disorders (NDDs)
- PMID: 39786577
- PMCID: PMC11976362
- DOI: 10.1007/s00439-024-02722-w
CAGI6 ID panel challenge: assessment of phenotype and variant predictions in 415 children with neurodevelopmental disorders (NDDs)
Abstract
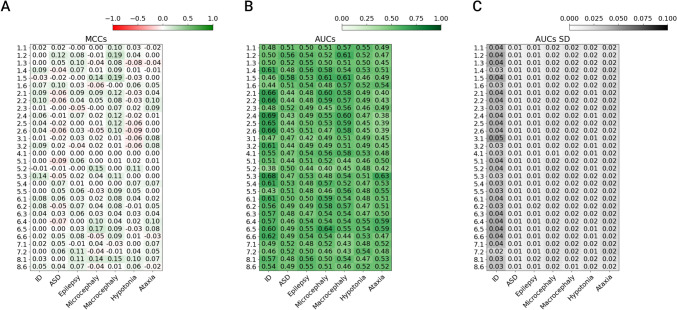
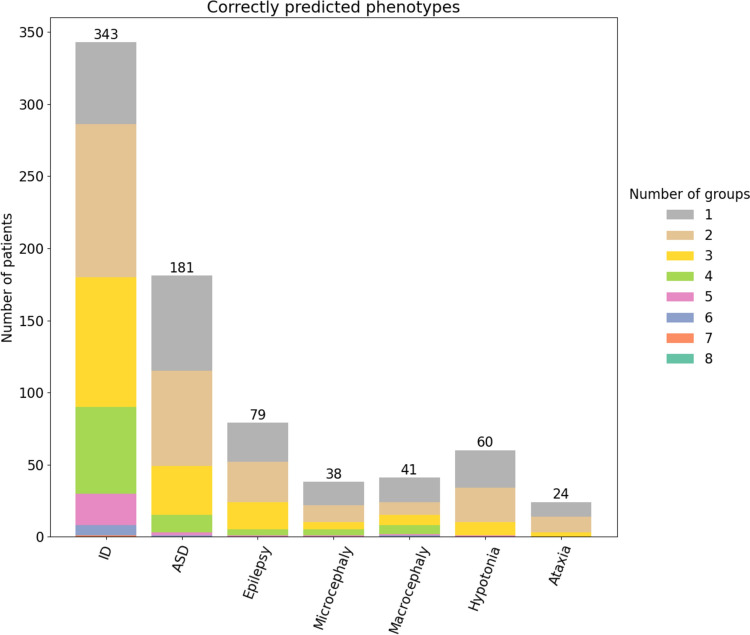
The Genetics of Neurodevelopmental Disorders Lab in Padua provided a new intellectual disability (ID) Panel challenge for computational methods to predict patient phenotypes and their causal variants in the context of the Critical Assessment of the Genome Interpretation, 6th edition (CAGI6). Eight research teams submitted a total of 30 models to predict phenotypes based on the sequences of 74 genes (VCF format) in 415 pediatric patients affected by Neurodevelopmental Disorders (NDDs). NDDs are clinically and genetically heterogeneous conditions, with onset in infant age. Here, we assess the ability and accuracy of computational methods to predict comorbid phenotypes based on clinical features described in each patient and their causal variants. We also evaluated predictions for possible genetic causes in patients without a clear genetic diagnosis. Like the previous ID Panel challenge in CAGI5, seven clinical features (ID, ASD, ataxia, epilepsy, microcephaly, macrocephaly, hypotonia), and variants (Pathogenic/Likely Pathogenic, Variants of Uncertain Significance and Risk Factors) were provided. The phenotypic traits and variant data of 150 patients from the CAGI5 ID Panel Challenge were provided as training set for predictors. The CAGI6 challenge confirms CAGI5 results that predicting phenotypes from gene panel data is highly challenging, with AUC values close to random, and no method able to predict relevant variants with both high accuracy and precision. However, a significant improvement is noted for the best method, with recall increasing from 66% to 82%. Several groups also successfully predicted difficult-to-detect variants, emphasizing the importance of variants initially excluded by the Padua NDD Lab.
© 2025. The Author(s).
Conflict of interest statement
Declarations. Ethical approval and consent to participate: This study was performed in line with the principles of the Declaration of Helsinki. Approval was granted by the Ethics Committee of University Hospital of Padua, Italy. According to approved protocols of each referring clinical center, written informed consent was obtained from the probands or their legal representatives for specimen collection and genetic analysis. All individuals recruited provided informed consent for their participation in the study and publication of relevant findings. Conflict of interest: The authors declare no conflict of interest.
Figures


Update of
-
CAGI6 ID-Challenge: Assessment of phenotype and variant predictions in 415 children with Neurodevelopmental Disorders (NDDs).Res Sq [Preprint]. 2023 Aug 2:rs.3.rs-3209168. doi: 10.21203/rs.3.rs-3209168/v1. Res Sq. 2023. Update in: Hum Genet. 2025 Mar;144(2-3):227-242. doi: 10.1007/s00439-024-02722-w. PMID: 37577579 Free PMC article. Updated. Preprint.
References
-
- Aspromonte MC, Bellini M, Gasparini A, Carraro M, Bettella E, Polli R, Cesca F, Bigoni S, Boni S, Carlet O, Negrin S, Mammi I, Milani D, Peron A, Sartori S, Toldo I, Soli F, Turolla L, Stanzial F, Leonardi E (2019) Characterization of intellectual disability and autism comorbidity through gene panel sequencing. Hum Mutat 40(9):1346–1363. 10.1002/humu.23822 - PMC - PubMed
-
- Aspromonte MC, Del Conte A, Polli R, Baldo D, Benedicenti F, Bettella E, Bigoni S, Boni S, Ciaccio C, D’Arrigo S, Donati I (2023) Rare variants in 45 genes account for 25% of cases with NDDs in 415 pediatric patients. 10.21203/rs.3.rs-3139796/v1
-
- Bradley AP (1997) The use of the area under the ROC curve in the evaluation of machine learning algorithms. Pattern Recogn 30(7):1145–1159. 10.1016/S0031-3203(96)00142-2
MeSH terms
Grants and funding
LinkOut - more resources
Full Text Sources
Miscellaneous
