. 2025 Mar:80:103486.
doi: 10.1016/j.redox.2024.103486. Epub 2024 Dec 31.

Exquisite sensitivity of Polycystin-1 to H2O2 concentration in the endoplasmic reticulum

Affiliations

Exquisite sensitivity of Polycystin-1 to H2O2 concentration in the endoplasmic reticulum

Elisa Speranza et al. Redox Biol. 2025 Mar.

Abstract

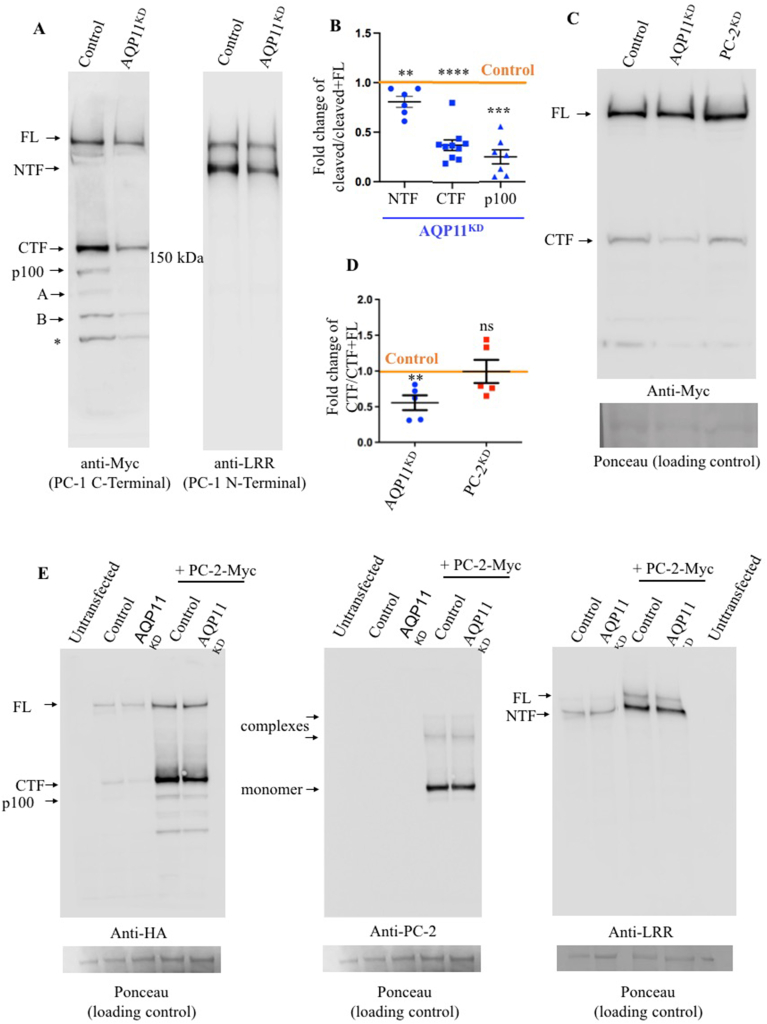
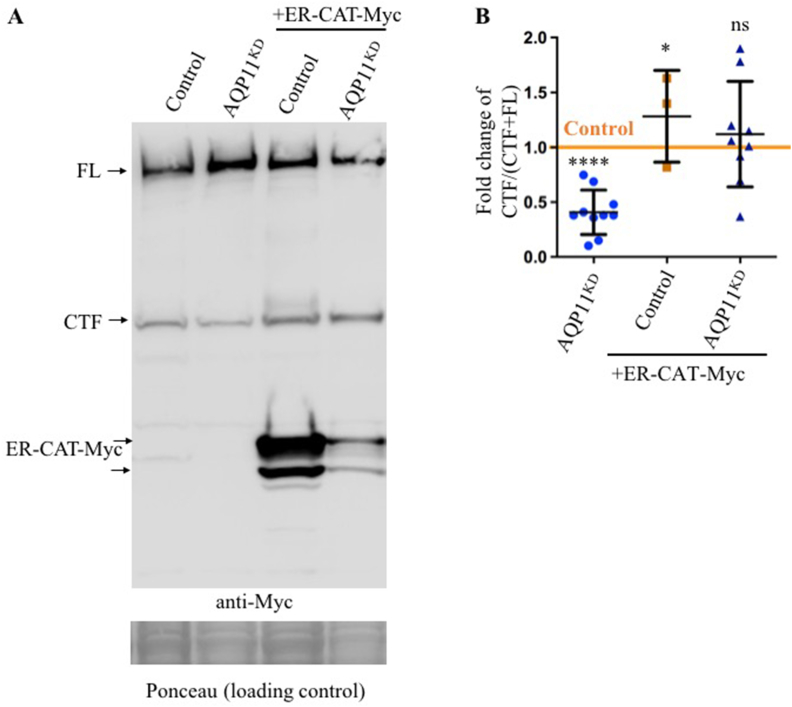
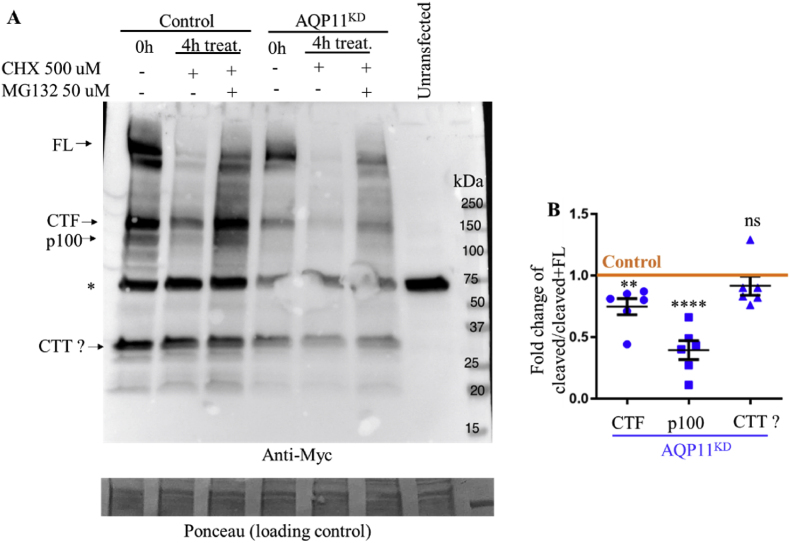
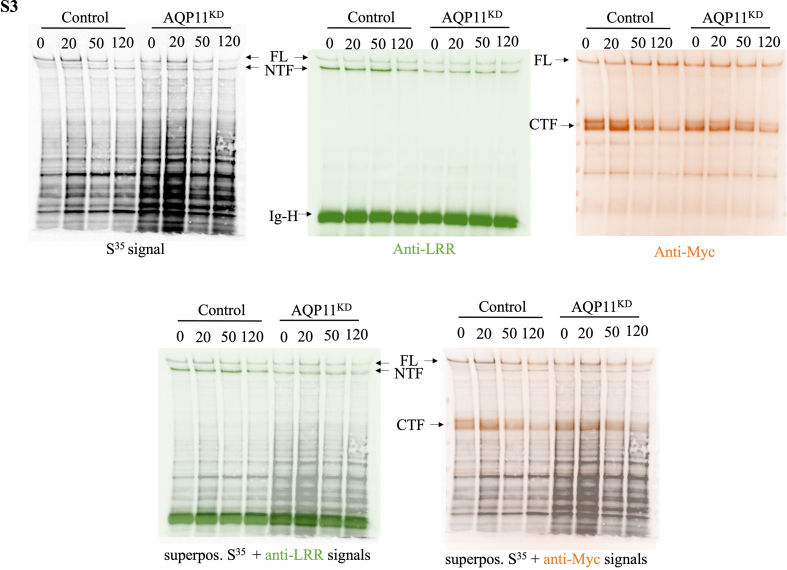
Aquaporin11 (AQP11) is an endoplasmic reticulum (ER) resident peroxiporin. It allows H2O2 transport from the lumen to the cytosol, guaranteeing redox homeostasis and signaling in and between the two organelles. Interestingly, Aqp11-/- mice develop a fatal, early onset polycystic kidney disease (PKD) similar to Autosomal Dominant PKD, a condition frequently associated with mutations of polycystin-1 (PC-1) in human patients. Here we investigated the molecular mechanisms of AQP11-associated PKD. Using different cell models, we show that transient downregulation of AQP11 selectively prevents the biogenesis of overexpressed PC-1. Expression of catalase in the ER lumen rescues the phenotype, demonstrating a direct role of (H2O2)ER in controlling the complex maturation of PC-1. Analysis of endogenous Pc-1 revealed an additional regulatory role at the pre-translational level. Taken together, our results show that AQP11 controls the complex biogenesis of PC-1 at multiple levels governing H2O2 intra and inter-organellar fluxes, with important implications in the pathogenesis and onset of PKD.

Keywords: Aquaporin 11; H(2)O(2); Polycystic kidney disease; Polycystin-1; Protein transport; Redox homeostasis.


Conflict of interest statement

Declaration of competing interest I declare that to the best of my knowledge the authors of this manuscript have no financial interests.

Figures

Image 1
Graphical abstract
Fig. 1
Fig. 1
AQP11KDaffects PC-1 protein HeLa cells transiently expressing PC-1-Myc were transfected with AQP11-specific (AQP11KD) or scrambled (mock) siRNAs. Aliquots of their lysates were resolved electrophoretically, and blots sequentially decorated with anti-Myc, anti-HA or anti-LRR antibodies. A) As expected, anti-Myc antibodies recognize full length (FL) PC-1, CTF and p100. The asterisk corresponds to a cross-reaction of the anti-Myc antibody. Anti-LRR antibodies recognize instead the FL protein and its N-terminal fragment (NTF). B) Densitometric analyses of numerous gels like the one shown in A allowed to calculate the abundance of PC-1 fragments in silenced cells relative to controls. The graph shows the ratio between the indicated cleaved form (NTF, CTF, p100) and the total protein (cleaved + FL) in AQP11KD relative control HeLa cells. Each dot corresponds to a single experiment. NTF was measured in 6 experiments, CTF in 10 experiments and p100 in 8 experiments. The graphs show the mean with SEM (P-value: NTF = 0.0059; CTF<0.0001; p100 < 0.0001). C) Unlike AQP11KD, PC-2 silencing does not decrease CTF accumulation (see quantification below). D)The decrease in CTF accumulation was calculated as described in Fig. 1B, comparing only the experiments in which both AQP11 and PC-2 were silenced in parallel (Average of 5 experiments. Each dot is an independent experiment). The graphs show the mean with SEM (P-value: AQP11KD = 0.0026; PC-2KD = 0.9714). E) Co-expression of PC-2-Myc stabilizes most PC-1-HA derived isoforms in control and AQP11KD cells.
Fig. 2
Fig. 2
Expression of catalase in the ER reduces (H2O2)ERand rescues the phenotype of AQP11KDcells. Stable HeLa transfectants expressing HyPer in the ER were silenced and transfected as indicated A) Clearly, the characteristic decrease of CTF is no longer evident in cells that express ER-CAT-Myc. Thus, lowering (H2O2)ER rescues CTF accumulation in AQP11KD cells. Note that also at a relatively low expression levels was ER-CAT-Myc capable of lowering (H2O2)ER. B) Densitometric quantification of the CTF/(CTF + FL) suggests that lowering (H2O2)ER promotes CTF accumulation independently from AQP11KD. Each dot corresponds to a single experiment. The graphs show the mean with SEM. (P-values: AQP11KD < 0.0001; Control + ER-CAT-Myc = 0.0253; AQP11KD + ER-CAT-Myc = 0.4).
Fig. 3
Fig. 3
AQP11KDdoes not inhibit PC-1 autoproteolysis A) HEK293T cells expressing PC-1-Myc w/wo previous AQP11 silencing were labeled for 20 min with radioactive amino acids, and their lysates immunoprecipitated with a mix of anti-Myc and anti-LRR antibodies. The gel was transferred to nitrocellulose and the membrane first developed for autoradiography to detect newly synthetized, radioactive proteins. The same membrane was then decorated with anti-LRR antibodies to detect the total protein pools. Only the top part of the gel is shown. See Fig. S3 for the whole image. B) The graphs show the mean with SEM from three independent experiments where the ratio between the signal from the newly synthetized and the total FL or NTF was calculated.
Fig. 4
Fig. 4
Catalase partly rescues CTF accumulation in AQP11 deficient cells HeLa cells transfected and/or silenced as indicated were cultured in the presence of CHX to block protein synthesis. A) Aliquots of their cell lysates were resolved by SDS-PAGE and blots decorated with anti-Myc. Note that the decreased CTF stability in AQP11KD cells is rescued by ER-CAT-Myc. B) The graphs show the mean with SEM from two independent experiments in which we calculated the ratio between FL or CTF and the loading control (ponceau).
Fig. 5
Fig. 5
Effects pf AQP11 KD on CTF stability. HeLa transfectants expressing PC-1-Myc and silenced as indicated were treated with CHX for 4 h with or without inhibitors of lysosomal (bafilomycin, Baf) or proteasomal (MG132) degradation. A) Aliquots of the lysates were immunoblotted with the indicated antibodies. B) The intensity of the FL and CTF PC-1 was quantified by densitometry. Average from four independent experiments. The graphs show the mean with SEM (P-values: Control = 0.0054; Control Baf = 0.0179; Control MG132 = 0.7682; AQP11KD < 0.0001; AQP11KD Baf = 0.0014; AQP11KD MG132 = 0.6360).
Fig. 6
Fig. 6
Stability of a 30 kDa C-terminal fragment pf PC-1 (CTT?). A) HeLa transfectants expressing PC-1-Myc were treated as indicated. To identify also smaller proteolytic fragments aliquots from the cell lysates were resolved by 4–12 % polyacrylamide gels. B) The graph compares the abundance of the indicated fragments (CTF, p100, CTT) in AQP11KD relative to control cells. Each dot corresponds to one independent experiment. The graphs show the mean with SEM. (P-value: CTF = 0.0031; p100 < 0.0001; CTT = 0.3090).
Fig. 7
Fig. 7
Pre-translational regulation of ‘endogenous’ Pc-1 Aqp11KDin MEFs MEFs isolated from knock in mice expressing ‘endogenous’ tagged Pc-1 were transfected with Aqp11-specific (Aqp11KD) or control siRNAs. Aliquots of their lysates were resolved electrophoretically, and blots sequentially decorated with anti Myc, anti-HA or anti-LRR antibodies A) Murine Aqp11 was silenced in Myc-tagged clone 2 and corresponding parental untagged control clone 5 or HA-tagged clone 2.8 and parental control clone 2.6. Cell lysates were analyzed by WB. As expected, anti-Myc and anti-HA recognize FL and CTF only in the corresponding tagged clones, whilst anti-LRR decorate FL and NTF also in untagged parental control clones. B) Densitometric quantifications. The signal of each isoform was normalized over tubulin signal. Anti-Myc/HA allows to distinguish FL and CTF signal. Since the FL and NTF signal were not sufficiently resolved by anti-LRR, the graph shows the sum of the two bands. Each color corresponds to a clone and each dot corresponds to a single experiment. FL and CTF decrease was measured in three experiments for clone 2 and six experiments for clone 2.8 by the anti-Myc/HA signal. LRR decrease was measured in five experiments for clone 2.8 and three experiments for each of the other three clones. The graphs show the mean. (P-value: FL < 0.0001; CTF<0.0001; FL + NTF<0.0001). C) RT-qPCR analyses of Aqp11 or Pc-1 mRNA normalized on Hprt1 in MEFs cells after Aqp11 silencing relative to controls. Each color corresponds to a clone and each dot corresponds to a single experiment. The graphs show the mean with SEM. (P-value Aqp11: Aqp11KD < 0.0001; P-value Pc-1: Aqp11KD < 0.0001).
Supplementary Fig. S1
Validation of the detection system and generality of the phenotype A. Proteolytic processing of PC-1 yields several fragments carrying the C-terminal tag. Anti-Myc antibodies detect FL PC-1, CTF, p100 and other not identified C-terminal derived forms which are indicated by the arrows. The asterisk (∗) points to a cross-reactive unidentified band which is detected also in untransfected cells. B. The abundance of FL or CTF isoforms were quantified by densitometric analysis of the individual bands and normalized over a loading control (anti-tubulin signal or ponceau). While the intensity of the FL bands varies with different transfection efficiency, the CTF signal is always reduced in AQP11KD cells compared to controls. Each dot represents an independent experiment. Lines connect FL and CTF measured in the same experiment. The graphs show the mean with SEM (P-value: FL = 0.8379; CTF<0.0001). C. AQP11KD affects the processing of PC-1-HA transiently expressed in HeLa cells. D. AQP11KD inhibits CTF accumulation of transiently transfected PC-1-Myc in HEK cells. E. The abundance of the PC-1 fragments in HEK293T cells was quantified by densitometry and expressed as the ratio between CTF and the total protein (CTF + FL) in AQP11KD relative to control. Each dot represents an independent experiment. The graphs show the mean with SEM. (P-value: HEK293T = 0.0209). F. Residual expression of AQP11 upon silencing in HeLa cells quantified by RT-qPCR. The graphs show the mean with SEM. (P-value: AQP11KD < 0.0001). G. Expression level of PC-1-Myc upon transient transfection in control and AQP11KD HeLa cells was quantified by RT-qPCR as threshold cycle (Ct) of PC-1 normalized over GAPHD. The graphs show the mean with SEM (P-value: AQP11KD = 0.1117). H. RT-qPCR analysis of AQP11 (blue) or PC-2 (red) mRNAs normalized on GAPDH to determine residual expression following silencing. The graphs show the mean with SEM (P-value: AQP11KD: 0.0067; PC-2KD < 0.0001). I. The abundance of FL or CTF isoforms were quantified as described above in S1B. While FL varies depending on transfection efficiency, the CTF signal is marginally reduced in PC-2KD cells compared to controls, confirming that defective CTF accumulation can be exaggerated by the paucity of PC-2. Each dot represents an independent experiment. Lines connect FL and CTF measured in the same experiment. The graphs show the mean with SEM (P-value: FL = 0.7432; CTF = 0.0575). J. Aliquots of HeLa cells silenced as indicated were resolved electrophoretically and blots decorated with anti-PC-2 antibodies. The results indicate that neither the total amount nor the oligomerization state of endogenous PC-2 molecules is affected by AQP11KD. HeLa cells were used unless otherwise indicated.
Supplementary Fig. S2
AQP11KD does not significantly alter IgM polymerization A) The expression of catalase in the ER counteracts the increase in (H2O2)ER induced by AQP11KD calculated from the basal ratio (488/405) of the Hyper ER-Lumen sensor (n = 2, see also refs. [[7], [34]]). B) As previously described [30] mifepristone was used to induce abundant production of secretory IgM by stable HeLa transfectants before or after AQP11KD. Aliquots of the cell lysates or conditioned supernatants were resolved by SDS-PAGE under non-reducing conditions and decorated with anti-μ antibodies [56]. C) IgM secretion quantified by ELISA in three independent experiments. The graphs show the mean with SEM. (P-value: AQP11KD = 0,2)
None
Supplementary Figure S3: The entire membrane of the pulse-chase is shown with the radioactive signal (top left panel), the anti-LRR immunoblot (top middle) or the anti-Myc immunoblot (top right). The dark 55 kDa band decorated by anti-LRR likely consists of the heavy chain of the antibodies used for immunoprecipitation (Ig-H). The lower two panels show the superposition of the images.
Supplementary Fig. S4
CTF disappears faster than NTF upon blockade of protein synthesis. HeLa transfectants expressing PC-1-Myc were cultured for 4 h with or without cycloheximide (CHX). Note that the CTF signal is almost entirely lost, while NTF shows higher stability and longer half-life.
Supplementary Fig. S5
AQP11KD does not significantly increase PC-1 detergent insolubility A)HeLa transfectants expressing PC-1-Myc were silenced as indicated and lysed in two steps. First, post nuclear supernatants were obtained by centrifugation after 1 % CHAPS solubilization. Then, the pellet was resuspended in 2 % SDS and sonicated. B) The abundance of the PC-1 fragments was quantified by densitometry and expressed as the ratio between CTF and the total protein (CTF + FL) in AQP11KD relative to control. Each dot represents an independent experiment. The graphs show the mean with SEM (P-value: 1 % CHAPS = 0.0235: 2 % SDS = 0.1182).
Supplementary Fig. S6
Schematic representation of PC-1-Myc derived isoforms The molecular weight of each fragment is indicated below.
Supplementary Fig. 7
Investigating the phenotype in Aqp11KDMEF cells. A) The ratio between CTF and total protein (CTF + FL) in Aqp11KD relative to control was calculated in MEFs isolated from knock-in mice expressing ‘endogenous’ Myc or HA tagged Pc-1 [57,58]. Each color represents a clone, and each dot represents an independent experiment. The graphs show the mean of 6 independent experiments (P-value: MEF = 0.3903). B) Inhibiting proteasomal degradation does not rescue Pc-1 accumulation in Aqp11KD MEFs. MEFs with the indicated genotypes were treated with or without cycloheximide (CHX) for 4 h. To address proteasomal contribution, cells were also treated with the proteasome inhibitor MG132 combined with CHX. Anti-ubiquitin antibodies confirmed proteasomal inhibition. C) The abundance of FL or CTF was quantified by densitometry and normalized over the tubulin signal. Each color represents one clone and each dot a single experiment (n = 2). D) RT-qPCR analysis of Aqp11 or Pc-2 mRNA normalized on Hprt1 in MEFs cells upon Aqp11KD relative to control. Each color corresponds to a clone and each dot corresponds to a single experiment. The graph shows the mean. (P-value Aqp11 < 0.0001, Pc-2 = 0.1402).

References

    1. Sies H., Jones D.P. Reactive oxygen species (ROS) as pleiotropic physiological signalling agents. Nat. Rev. Mol. Cell Biol. 2020;21:363–383. - PubMed
    1. Nordzieke D.E., Medraño-Fernandez I. The plasma membrane: a platform for intra-and intercellular redox signaling. Antioxidants. 2018;7 doi: 10.3390/antiox7110168. Preprint at. - DOI - PMC - PubMed
    1. Meng T.-C., Fukada T., Tonks N.K. Reversible oxidation and inactivation of protein tyrosine phosphatases in vivo. Mol. Cell. 2002;9:387–399. - PubMed
    1. Miller E.W., Dickinson B.C., Chang C.J. Aquaporin-3 mediates hydrogen peroxide uptake to regulate downstream intracellular signaling. Proc. Natl. Acad. Sci. U. S. A. 2010;107 - PMC - PubMed
    1. Bertolotti M., et al. Tyrosine Kinase signal modulation: a matter of H2O2 membrane permeability? Antioxidants Redox Signal. 2013;19:1447–1451. doi: 10.1089/ars.2013.5330. Preprint at. - DOI - PMC - PubMed

LinkOut - more resources