. 2025 Mar:80:103480.
doi: 10.1016/j.redox.2024.103480. Epub 2024 Dec 31.

De novo lipogenesis protects dormant breast cancer cells from ferroptosis and promotes metastasis

Affiliations

De novo lipogenesis protects dormant breast cancer cells from ferroptosis and promotes metastasis

Beatriz Puente-Cobacho et al. Redox Biol. 2025 Mar.

Abstract

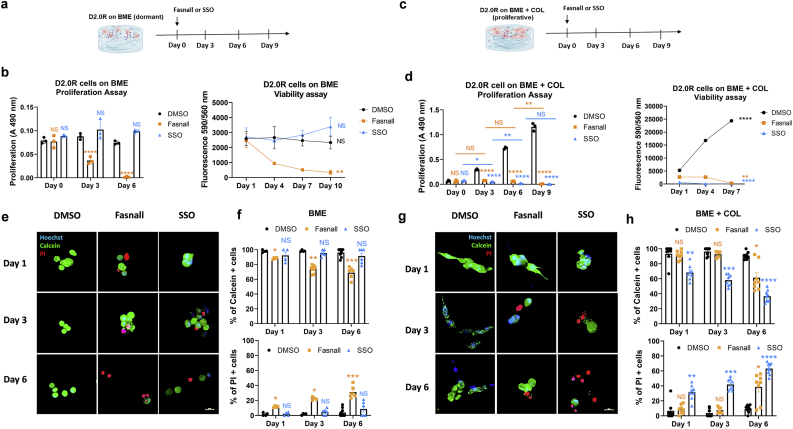
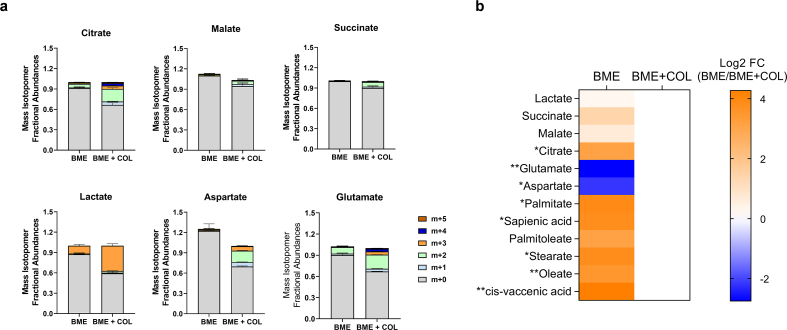
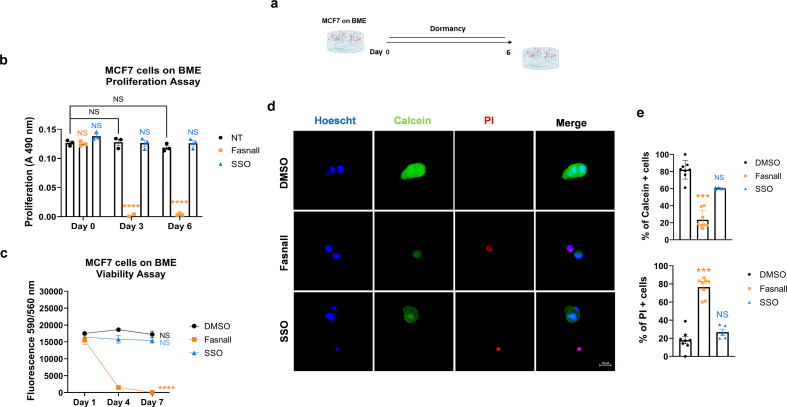
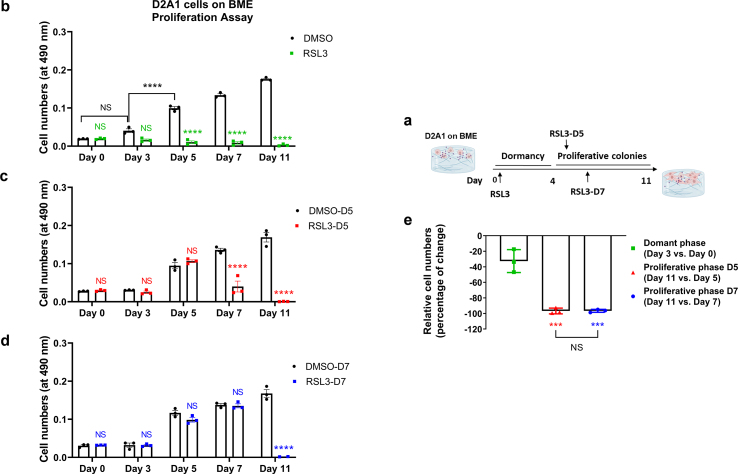
Dormant disseminated tumor cells (DTCs) remain viable for years to decades before establishing a clinically overt metastatic lesion. DTCs are known to be highly resilient and able to overcome the multiple biological hurdles imposed along the metastatic cascade. However, the specific metabolic adaptations of dormant DTCs remain to be elucidated. Here, we reveal that dormant DTCs upregulate de novo lipogenesis and favor the activation and incorporation of monounsaturated fatty acids (MUFAs) to their cellular membranes through the activation of acyl-coenzyme A synthetase long-chain family member 3 (ACSL3). Pharmacologic inhibition of de novo lipogenesis or genetic knockdown of ACSL3 results in lipid peroxidation and non-apoptotic cell death through ferroptosis. Clinically, ACSL3 was found to be overexpressed in quiescent DTCs in the lymph nodes of breast cancer patients and to significantly correlate with shorter disease-free and overall survival. Our work provides new insights into the molecular mechanisms enabling the survival of dormant DTCs and supports the use of de novo lipogenesis inhibitors to prevent breast cancer metastasis.

Keywords: Breast cancer; Ferroptosis; Lipid metabolism; Lipid peroxidation; Metastasis; Monounsaturated fatty acids activation; Tumor cell dormancy.


Conflict of interest statement

Declaration of competing interest The authors declare the following financial interests/personal relationships which may be considered as potential competing interests: S.-M.F. has received funding from BlackBelt Therapeutics, Gilead and Alesta Therapeutics, is in the advisory board of Alesta Therapeutics, has consulted for Fund+ and Droia Ventures and is in the advisory board of several Cell Press Journals. All other authors have no conflicts of interest to declare.

Figures

Image 1
Graphical abstract
Fig. 1
Fig. 1
Dormant breast cancer cells activate de novo lipogenesis. a.13C6-glucose (1 g/L) stable isotope tracing over 5 days was used to reveal flux of carbon from glucose into TCA cycle metabolites in D2.0R cells on BME and BME + COL matrices, as measured by LC-MS. Absolute isotopolog distribution is shown (n = 3–4 biological replicates). b. Relative total abundances of polar metabolites and fatty acids in dormant D2.0R cells on BME matrices as compared to proliferating D2.0R cells on BME + COL matrices at day 5 of culture (n = 3–4). Unpaired two-tailed t-tests with Welch correction. ∗P < 0.05, ∗∗P < 0.01. c. Palmitate (left) and stearate (right) labelling from 13C6-glucose in D2.0R cells on BME and BME + COL matrices at day 5 of culture. d.de novo palmitate (upper graph) and stearate (lower graph) synthesis rate in dormant D2.0R cells on BME matrices as compared to proliferating D2.0R cells on BME + COL matrices at day 5 of culture (n = 6–8 biological replicates). Unpaired two-tailed t-tests with Welch correction. ∗∗∗P < 0.001.
Fig. 2
Fig. 2
Inhibiting fatty acid synthesis reduces the viability of dormant D2.0R cells and reduces the fraction of proliferating D2.0R cells in 3D culture. Figure shows data of one out of three independent experiments done in triplicate with equivalent results. a. Outline of the proliferation and viability experiments on BME matrices. b. Proliferation (left) (mean ± s.e.m, n = 3 wells. Comparisons by one-way ANOVA plus Tukey's multiple comparisons post-test for Day 0, Day 3 and Day 6 time points. ∗∗P ≤ 0.01; ∗∗∗∗P ≤ 0.0001) and viability (right) (mean ± s.e.m, n = 3 wells. Comparisons at Day 10 by one-way ANOVA plus Tukey's multiple comparisons post-test. ∗∗P ≤ 0.01 relative to Day 1 for each group) assays of D2.0R cells on BME matrices treated with Fasnall (40 μM) and SSO (200 μM). c. Outline of the proliferation and viability experiments on BME + COL matrices. d. Proliferation (left) (mean ± s.e.m, n = 3 wells. Comparisons by one-way ANOVA plus Tukey's multiple comparisons post-test for Day 0, Day 3, Day 6 and Day 9 time points. ∗∗P ≤ 0.01) and viability (right) (mean ± s.e.m, n = 3 wells. Comparisons at Day 7 by one-way ANOVA plus Tukey's multiple comparisons post-test. ∗∗P ≤ 0.01; ∗∗∗∗P ≤ 0.0001 relative to Day 1 for each group) assays of D2.0R cells on BME + COL matrices treated with Fasnall (40 μM) and SSO (200 μM). e. Representative propidium iodide (PI, red) and Calcein AM (green) staining of D2.0R cells on BME, either treated with Fasnall, SSO or vehicle. Scale bar is 20 μm. Viability and cell death indexes of D2.0R on BME were calculated as the percentage of cells positively stained for Calcein AM or PI, as shown in f. (mean ± s.e.m, n = 100–269 cells per group. Comparison by Mann-Whitney U test, two-sided. ∗P ≤ 0.05; ∗∗∗∗P ≤ 0.0001). g. Representative PI (red) and Calcein AM (green) staining of D2.0R cells on BME + COL, either treated with Fasnall, SSO or vehicle. Scale bar is 20 μm. h. Viability and cell death indexes of D2.0R on BME + COL were calculated as the percentage of cells positively stained for Calcein AM or PI (mean ± s.e.m, n = 139–287 cells per group. Comparison by Mann-Whitney U test, two-sided. ∗P ≤ 0.05; ∗∗∗∗P ≤ 0.0001). DMSO, cell treated with vehicle; Fasnall, cells treated with 40 μM Fasnall immediately after plating; SSO, cells treated with 200 μ M SSO immediately after plating.
Fig. 3
Fig. 3
Fatty acids synthesis inhibition reduces the lung tumor burden of D2.0R cells in vivo. a. Experiment design. b. Total lung surface burden of athymic nu/nu mice receiving tail-vein injections of 1 × 106 D2.0R GFP cells, followed by vehicle (DMSO + Saline) or 10 mg/kg body weight of Fasnall, twice week for 3 weeks (data show mean ± s.e.m, n = 8–9 mice per group. Comparison by Mann-Whitney U test, two-sided). c. Absolute numbers of dormant DTCs and micrometastasis per lung in mice either treated with vehicle or Fasnall (data show mean ± s.e.m, n = 8–9 mice per group. Comparisons by Mann-Whitney U test, two-sided). Lesions <1000 pixels2 correspond to dormant DTCs and lesions >1000 pixels2 represent micrometastasis d. Representative images of dormant disseminated tumor cells (DTCs) and micrometastatic lesions in the lung from the experiment are shown in b. Scale bar is 400 μm.
Fig. 4
Fig. 4
Dormant breast cancer cells exert a ferroptosis-resistant state. a. Pathway enrichment analysis (upper panel) focusing on cellular metabolism for RNA expression in D2.0R cells on BME as compared with D2.0 R cells on BME + COL after 5 days in culture. The graph represents metabolic pathways which are significantly modulated in dormant as compared to proliferating D2.0R cells based on the gene hit size (adjusted P value (padj) < 0.05). The values are represented in logarithmic scale (base 10). The gene sets were obtained from the Gene Ontology (GO) Biological Process database https://geneontology.org/. Enrichment plots (lower panel) of positive regulation of lipid biosynthetic process (left) and iron ion homeostasis (right) pathways in dormant D2.0R cells compared with proliferative D2.0R cells, as identified by the GSEA computational method https://www.gsea-msigdb.org/gsea/. Columns indicate individual samples and rows represent each gene. Red represents a high expression level and blue indicates a low expression level. NES, normalized enrichment score; NOM P value, nominal P value; FDR value, false discovery rate value. b. Graphical summary of the expression profile of overexpressed (red) and downexpressed (green) genes involved in ferroptosis, in D2.0R cells on BME as compared with D2.0 R cells on BME + COL. Ferroptosis inducers (purple) and inhibitors (pink) used in this study were included. Representative images are shown for c. Fluorescent staining of oxidized lipid (BODIPY C11 oxidized: BODIPY C11Ox, green) and non-oxidized lipid (BODIPY C11 non-oxidized: BODIPY C11Non-ox, red) markers of live D2.0R cells on BME (upper panels) and BME + COL (lower panels) after treatment with either RSL3 (2,5 μM) or vehicle for 5 days, with quantification of the mean fluorescence intensity (MFI) ratio of the oxidized BODIPY C11 probe (BODIPY C11Ox) to total BODIPY C11 signal detected (BODIPY C11Ox + BODIPY C11Non-ox) (mean ± s.e.m, n = 40–128 cells per group. Comparisons are relative to D2.0R cells treated with vehicle in both conditions by Kruskal-Wallis, Dunn's post-test. ∗P ≤ 0.05; ∗∗∗∗P ≤ 0.0001) (upper graph) and quantification of the relative increase in BODIPY MFI ratio in D2.0R cells on BME or BME + COL matrices upon treatment with the ferroptosis inductor RSL3 (mean ± s.e.m, n = 40–128 cells. Comparison by Mann-Whitney U test, two-sided. ∗∗∗P ≤ 0.0001) (lower graph). Scale bar is 20 μm. d. Dose-dependent reduction in D2.0R cell numbers on BME (upper left graph) and BME + COL (lower left graph) upon treatment with increasing concentrations (0–8 μM) of RSL3 as determined by MTS assay at days 0 and 3 of culture (mean ± s.e.m, n = 3 wells. Comparisons at day 3 by one-way ANOVA plus Tukey post-test. ∗∗P ≤ 0.01; ∗∗∗∗P ≤ 0.0001). On the right, quantification of the relative decrease in D2.0R cell numbers, seeded on BME and BME + COL matrices, upon treatment with 2 μM RSL3 for 3 days with respect to vehicle treated control cells. e. Representative images of live D2.0R cells stained with BODIPY C11 and treated with either Fasnall or vehicle for 5 days on BME matrices. Scale bar is 20 μm and 5 μm. On the right, quantification of the MFI ratio for BODIPY C11 of D2.0R cells on BME matrices treated with vehicle or Fasnall for 5 days (mean ± s.e.m, n = 66–84 cells per group. Comparison by Mann-Whitney U test, two-sided. ∗∗∗P ≤ 0.0001).
Fig. 5
Fig. 5
ACSL3 protects dormant breast cancer cells against lipid peroxide-induced toxicity. a. Significant correlations between low expression of ACSL3 gene and compound lethality from the Cancer Therapeutics Response Portal dataset. Each dot represents one compound. Ferroptosis-inducing compounds are highlighted in green. b. Proliferation (left graph. Mean ± s.e.m, n = 3 wells. Comparisons by one-way ANOVA plus Tukey's multiple comparisons post-test for Day 0, Day 3 and Day 6 time points. ∗∗P ≤ 0.01) and viability (right graph. Mean ± s.e.m, n = 3 wells. Comparisons at Day 7 by one-way ANOVA plus Tukey's multiple comparisons post-test. ∗∗P ≤ 0.01 relative to Day 1 for each group) assays of D2.0R control and D2.0R ACSL3LOF cells on BME. c. Representative images of live D2.0R control and D2.0R ACSL3LOF cells stained with BODIPY C11 and cultured on BME matrices for 6 days. Scale bar is 20 μm and 5 μm. On the right, quantification of the MFI ratio of the oxidized BODIPY C11 probe (BODIPY C11Ox) to total BODIPY C11 signal detected (BODIPY C11Ox + BODIPY C11Non-ox) in D2.0R control and D2.0R ACSL3LOF cells on BME matrices for 6 days (mean ± s.e.m, n = 44–52 cells per group. Comparison by Mann-Whitney U test, two-sided. ∗∗∗P ≤ 0.0001). d. Quantification of dormant D2.0R control and D2.0R ACSL3LOF cell numbers upon treatment with either vehicle, Fasnall and/or Fer-1 (upper graph); vehicle, AAPH and/or Fer-1 (center graph) and vehicle, hydrogen peroxide (H2O2) and/or Fer-1 (lowest graph) for 6 days (data show mean ± s.e.m, n = 3 wells. Comparisons by one-way ANOVA plus Tukey post-test at day 6 and relative to vehicle-treated control cells, with pairwise comparisons indicated by square brackets. NS, not significant; ∗∗P ≤ 0.01; ∗∗∗P ≤ 0.001; ∗∗∗∗P ≤ 0.0001). e. Total lung surface burden of athymic nu/nu mice tail-vein injected with 1 × 106 D2.0R-GFP control or D2.0R-GFP ACSL3LOF cells. The animals received a single-dose treatment with either saline (vehicle) or 200 mg/kg AAPH, via nasal instillation at day 18 post-injection of the tumor cells (data represent mean ± s.e.m, n = 8–10 mice per group. Comparison by Kruskal-Wallis, Dunn's post-test). f. Total lung surface burden of athymic nu/nu mice tail-vein injected with 1 × 106 D2.0R-GFP control or D2.0R-GFP ACSL3LOF cells. The animals received a daily dose of Fer-1 (5,2 mg/kg) or vehicle (DMSO + Saline) intraperitoneally, for 3 weeks (data represent mean ± s.e.m, n = 8–10 mice per group. Comparison by Kruskal-Wallis, Dunn's post-test). Representative images of the data shown in e. and f. can be found in Supplementary Fig. S11, a and b, respectively.
Fig. 6
Fig. 6
ACSL3 knockdown and fatty acid synthesis inhibition cooperatively reduce MUFAs synthesis and lipid peroxidation in the plasma membrane. a. Relative levels of eight different lipid species determined by GC-MS in D2.0R control cells and D2.0R ACSL3LOF cells seeded on BME and treated for 5 days with either vehicle (upper panel) or Fasnall (40 μM) (lower panel). Data show the logarithm to the base 2 of the fold change for each lipid specie in the D2.0R ACSL3LOF vs. D2.0R control cells (comparisons are relative to DHA and Adrenic acid by Kruskal-Wallis, Dunn's post-test. NS; not significant; ∗P ≤ 0.05; ∗∗P ≤ 0.01). b. Quantification of dormant D2.0R control and D2.0R ACSL3LOF cell numbers upon treatment with either vehicle, Fasnall, exogenously added OA or/and exogenously added POA to BME-based 3D cultures for 6 days (mean ± s.e.m, n = 3 wells. Comparisons by one-way ANOVA plus Tukey post-test at day 6 and relative to vehicle-treated control cells, with pairwise comparisons indicated by square brackets. NS, not significant; ∗P ≤ 0.05; ∗∗P ≤ 0.01; ∗∗∗P ≤ 0.001; ∗∗∗∗P ≤ 0.0001). c. Representative images of dormant D2.0R cells on BME matrices, either treated with vehicle or Fasnall (40 μM) and stained with BODIPY C11581/591 and Cell Mask (plasma membrane marker). Scale bar is 20 μm and 5 μm. d. Percentage of co-localization between red (BODIPY C11OX) and far red (Cell Mask. Colored in aqua for clarity) pixels and between green (BODIPY C11Non-ox) and far red (Cell Mask. Colored in aqua for clarity) pixels ± Fasnall (mean ± s.e.m, n = 53–58 cells per group. Comparisons are relative to untreated control cells by Kruskal-Wallis, Dunn's post-test. ∗∗∗∗P ≤ 0.0001). DHA, Docosahexaenoic acid; MUFA, monounsaturated fatty acid; OA, oleic acid; POA, palmitoleic acid; PUFA, polyunsaturated fatty acid.
Fig. 7
Fig. 7
ACSL3 expression promotes the survival of human DTCs and BC progression. a. BC patient samples of primary tumors (n = 16), lymph nodes with solitary DTCs (n = 20) and metastasis (n = 16) were immunostained for ACSL3, Ki67 and CK. Scale bar, 500 and 50 μm. The total number of cells analyzed is 102,585 cells for primary tumors, 113,390 DTCs in lymph nodes and 70,656 cells in metastatic lesions. b. Graph showing the percentage of ACSL3high, ACSL3moderate, or ACSL3low cells in primary tumor (PT), DTCs in lymph node (LN), or mestastasis (M). ∗, P < 0.05 by Fisher's exact test. c. Graph showing the percentage of cells in PT, LN or M exhibiting either a granular cytoplasmic or perinuclear ACSL3 staining pattern. ∗∗∗∗, P < 0.0001 by Fisher's exact test. d. Kaplan–Meier plots of DFS (upper panel) or OS (lower panel) generated from 19 BC patients in this study stratified by low (n = 12) or high (n = 7) ACSL3 staining intensity of DTCs in the lymph node. Hazard ratio (HR) with 95 % confidence intervals and log-rank P value are shown. e. Representative ACSL3 (green) and TGOLN2 (red, trans-Golgi network marker) immunofluorescence of D2.0R cells seeded on BME matrices (dormant) or on BME + COL matrices (proliferative). Scale bar is 20 μm and 10 μm. f. Overlap coefficient between green (ACSL3) and red (TGOLN2) pixels (mean ± s.e.m, n = 111–118 cells per group. Comparison by Mann-Whitney test. ∗∗∗∗P ≤ 0.0001).
figs1
figs1
figs2
figs2
figs3
figs3
figs4
figs4
figs5
figs5
figs6
figs6
figs7
figs7
figs8
figs8
figs9
figs9
figs10
figs10
figs11
figs11
figs12
figs12

References

    1. Sung H., Ferlay J., Siegel R.L., Laversanne M., Soerjomataram I., Jemal A., Bray F. Global cancer statistics 2020: GLOBOCAN estimates of incidence and mortality worldwide for 36 cancers in 185 countries. Ca - Cancer J. Clin. 2021;71:209–249. doi: 10.3322/CAAC.21660. - DOI - PubMed
    1. Pedersen R.N., Esen B.Ö., Mellemkjær L., Christiansen P., Ejlertsen B., Lash T.L., Nørgaard M., Cronin-Fenton D. The incidence of breast cancer recurrence 10-32 Years after primary diagnosis. J. Natl. Cancer Inst. 2022;114:391–399. doi: 10.1093/JNCI/DJAB202. - DOI - PMC - PubMed
    1. Metzger-Filho O., Sun Z., Viale G., Price K.N., Crivellari D., Snyder R.D., Gelber R.D., Castiglione-Gertsch M., Coates A.S., Goldhirsch A., Cardoso F. Patterns of Recurrence and outcome according to breast cancer subtypes in lymph node-negative disease: results from international breast cancer study group trials VIII and IX. J. Clin. Oncol. 2013;31:3083–3090. doi: 10.1200/JCO.2012.46.1574. - DOI - PMC - PubMed
    1. Nobre A.R., Dalla E., Yang J., Huang X., Wullkopf L., Risson E., Razghandi P., Anton M.L., Zheng W., Seoane J.A., Curtis C., Kenigsberg E., Wang J., Aguirre-Ghiso J.A. ZFP281 drives a mesenchymal-like dormancy program in early disseminated breast cancer cells that prevents metastatic outgrowth in the lung. Nat. Cancer. 2022;3:1165–1180. doi: 10.1038/S43018-022-00424-8. - DOI - PubMed
    1. Harper K.L., Sosa M.S., Entenberg D., Hosseini H., Cheung J.F., Nobre R., Avivar-Valderas A., Nagi C., Girnius N., Davis R.J., Farias E.F., Condeelis J., Klein C.A., Aguirre-Ghiso J.A. Mechanism of early dissemination and metastasis in Her2+ mammary cancer. Nature. 2016;540:588–592. doi: 10.1038/NATURE20609. - DOI - PMC - PubMed

Substances

LinkOut - more resources