. 2025 Feb:92:102097.
doi: 10.1016/j.molmet.2025.102097. Epub 2025 Jan 7.

LGR4 is essential for maintaining β-cell homeostasis through suppression of RANK

Affiliations

LGR4 is essential for maintaining β-cell homeostasis through suppression of RANK

Joanna Filipowska et al. Mol Metab. 2025 Feb.

Abstract

Objective: Loss of functional β-cell mass is a major cause of diabetes. Thus, identifying regulators of β-cell health is crucial for treating this disease. The Leucine-rich repeat-containing G-protein-coupled receptor (GPCR) 4 (LGR4) is expressed in β-cells and is the fourth most abundant GPCR in human islets. Although LGR4 has regenerative, anti-inflammatory, and anti-apoptotic effects in other tissues, its functional significance in β-cells remains unknown. We have previously identified Receptor Activator of Nuclear Factor Kappa B (NFκB) (RANK) as a negative regulator of β-cell health. In this study, we assessed the regulation of Lgr4 in islets, and the role of LGR4 and LGR4/RANK stoichiometry in β-cell health under basal and stress-induced conditions, in vitro and in vivo.

Methods: We evaluated Lgr4 expression in mouse and human islets in response to acute (proinflammatory cytokines), or chronic (high fat fed mice, db/db mice, and aging) stress. To determine the role of LGR4 we employed in vitro Lgr4 loss and gain of function in primary rodent and human β-cells and examined its mechanism of action in the rodent INS1 cell line. Using Lgr4fl/fl and Lgr4fl/fl/Rankfl/fl × Ins1-Cre mice we generated β-cell-specific conditional knockout (cko) mice to test the role of LGR4 and its interaction with RANK in vivo under basal and stress-induced conditions.

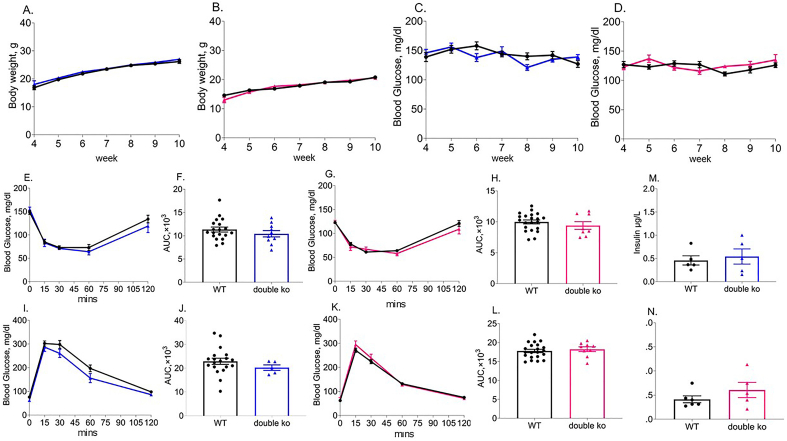
Results: Lgr4 expression in rodent and human islets was reduced by multiple stressors. In vitro, Lgr4 knockdown decreased proliferation and survival in rodent β-cells, while overexpression protected against cytokine-induced cell death in rodent and human β-cells. Mechanistically, LGR4 protects β-cells by suppressing RANK- Tumor necrosis factor receptor associated factor 6 (TRAF6) interaction and subsequent activation of NFκB. Lgr4cko mice exhibit normal glucose homeostasis but increased β-cell death in both sexes and decreased β-cell proliferation and maturation only in females. Male Lgr4cko mice under stress displayed reduced β-cell proliferation and a further increase in β-cell death. The impaired β-cell phenotype in Lgr4cko mice was rescued in Lgr4/Rank double ko (dko) mice. Upon aging, both male and female Lgr4cko mice displayed impaired β-cell homeostasis, however, only female mice became glucose intolerant with decreased plasma insulin.

Conclusions: These data demonstrate a novel role for LGR4 as a positive regulator of β-cell health under basal and stress-induced conditions, through suppressing the negative effects of RANK.

Keywords: LGR4; NFκB; RANK; β-cell death; β-cell proliferation; β-cell stress.


Conflict of interest statement

Declaration of competing interest R.C.V. and N.G.K. are named inventors on two U.S. utility patents, no. 9333239, issued on 10 May 2016, and no. 9724386, issued on 08 August 2017, for “Use of Osteoprotegerin (OPG) to increase human pancreatic beta cell survival and proliferation”. All other authors declare no competing interests.

Figures

Image 1
Graphical abstract
Figure 1
Figure 1
Lgr4 expression and regulation in mouse and human islets under stress. (A) Violin plot representation of Lgr4 expression in the endocrine cells of mouse pancreatic islets based on published single-cell transcriptome data [40] analyzed using https://tabula-muris.ds.czbiohub.org/, with the different cell type clusters labeled. (B, C) Heat maps showing Lgr4 mRNA, along with other maturity (mat) and immaturity (imm) markers in a meta-analysis of published RNA-seq data in islets from (B) 8 weeks old db/db mice and age-matched BKS controls (n = 2) [41] and (C) adult (10-week-old) C57BL/6J mice fed with a chow diet or a high fat diet (HFD) for two months (n = 2) [42]. Blue and red colors indicate relatively low and high expression levels, respectively. (D) Heat map showing Lgr4 mRNA in a meta-analysis of publicly available single-cell (sc) RNA sequencing data set GSE162512 from 1-week HFD or standard diet (SD)-fed male mice [43]. Yellow and blue colors indicate relative low and high expression levels, respectively. qPCR analysis of Lgr4 expression relative to Cyclophilin A as housekeeping gene in (E) mouse islets from 4- and 24-month-old C57Bl/6 male mice (n = 4–9), (F) mouse islets treated with vehicle (CTRL) or cytokine mix (CYT) for 24 h (n = 5). (G) Violin plot representation of LGR4 expression in the endocrine cells of human pancreatic islets based on published single-cell transcriptome analysis [44], with the different endocrine cell type clusters labeled. (H) Heat map showing LGR4 mRNA, along with islet maturity (MAT) and inflammatory (INFL) markers in RNA-seq analysis of human islets (n = 4; 2 female and 2 male donors) treated with vehicle (CTRL) or cytokine mix (CYT) for 24 h. Blue and red colors indicate relative low and high expression, respectively. (I) LGR4 mRNA levels in arbitrary units (A.U.) from the RNA-seq analysis of human islets described in (H). (J) qPCR analysis of LGR4 expression relative to BETA ACTIN in an independent cohort of human islets (n = 4; 2 female and 2 male donors) treated with vehicle (CTRL) or cytokine mix (CYT) for 24 h. (K) LGR4 expression in the human β-cell line (EndoC-βH5) treated with vehicle (CTRL) or CYT for 48 h based on meta-analysis of published transcriptome data [51] using https://www.ncbi.nlm.nih.gov/geo/query/acc.cgi?acc=GSE218735 (n = 4). ∗p < 0.05, ∗∗p < 0.01, ∗∗∗p < 0.001 vs 4 month or CTRL. Individual symbols in the graphs represent individual mouse islet preps (E, F), or independent experiments on different human islet preps (I–K). All data represent mean ± SEM. Statistical analysis was done by t-test. (For interpretation of the references to color in this figure legend, the reader is referred to the Web version of this article).
Figure 2
Figure 2
Lgr4 downregulation decreases β-cell proliferation and increases β-cell death in INS1 cells and mouse islets in vitro. INS1 cells un-transfected (−) (inverted triangle symbols) or transfected with scrambled (SC) (circle symbols) or Lgr4 (rectangle symbols) siRNA for 48–72 h were assayed for (A) Lgr4 expression relative to Cyclophilin A by qPCR after 48 h (n = 4–5); (B) BrdU incorporation by immunofluorescent staining for BrdU (red) and nuclear DAPI (blue), after 72 h, with the addition of BrdU to the culture medium for the last 2 h, scale bar is 50 μm; (C) proliferation measured as percent BrdU-positive cells for the treatment described in (B) (n = 6); (D, E) cell death measured as percent Cleaved Caspase-3 (CC3)-positive cells (D) basally after 72 h (n = 3–5), or (E) after treatment without (-) or with cytokine mix (CYT) for the last 16 or 24 h (n = 3–6). Lgr4fl/fl mouse islet cells transduced for 72 h with adenovirus (Ad) LacZ as control (CTRL) or AdCre to knockout Lgr4 (Lgr4ko) were assayed for (F) Cre recombinase (green or white), insulin (red) and DAPI (blue) by immunofluorescent staining after 72 h shown as separate or merged panels, scale bar is 20 μm; (G) Lgr4 relative to Cyclophilin A mRNA by qPCR after 72 h, with square blue symbols representing male Lgr4ko (n = 3), square pink symbols representing female Lgr4ko (n = 3), and circle black symbols representing corresponding male or female CTRL mouse islets; (H, I, J) β-cell proliferation after 72 h, on (H) pHH3 (red), insulin (green) and DAPI (blue) stained immunofluorescent cells, scale bar is 50 μm, measured as percent pHH3 and insulin double-positive cells and depicted as fold over CTRL in (I) male (n = 5), (CTRL 0.28 ± 0.08% proliferating β cells) and (J) female (n = 5) mice, (CTRL 0.89 ± 0.23% proliferating β cells); (K, L) percent β-cell death measured as TUNEL- and insulin-positive cells, after 72 h, in (K) male (n = 3) and (L) female (n = 3) mouse islets. #p < 0.05, ##p < 0.01, ####p < 0.0001 vs un-transfected (−) and SC groups for the same treatment in INS1 cells, and vs CTRL for mouse islets. ∗∗p < 0.01 vs untreated (−) INS1 cells from the same group. Individual symbols in the graphs represent independent experiments in INS1 cells (A, C–E) or individual mouse islet preps with controls derived from the same sex as the Lgr4ko (G, I–L), averaging duplicate samples for all experiments. All data represent mean ± SEM. Statistical analysis was by t-test for comparison of two groups, and by ANOVA with Tukey's post-hoc analysis for comparison of more than two groups. (For interpretation of the references to color in this figure legend, the reader is referred to the Web version of this article).
Figure 3
Figure 3
LGR4 overexpression protects β-cells against proinflammatory cytokine-induced cell death in INS1 cells, mouse, and human islets. (A–C) INS1 cells were untreated (Untr) (black inverted triangles) or transduced with adenovirus (Ad) LacZ as control (AdCtrl) (black circles) or AdLgr4 (brown squares) and (A) assessed for Lgr4 mRNA expression by qPCR after 48 h (n = 4); or treated after 24 h without (−) or with cytokine mix (CYT) for an additional 24 h and (B) stained for Cleaved Caspase-3 (CC3) (green) and DAPI (blue), and (C) quantified for cell death as percent CC3-positive cells (n = 3). (D–F) Mouse or (G–I) human islet cells were transduced with adenovirus (Ad) Cre as control (AdCtrl) (black circles) or species-specific AdLgr4 (brown squares) and (D, G) assessed for Lgr4 mRNA expression by qPCR after 48 h in (D) mouse (n = 3; mixed, female and male mice) and (G) human (n = 4; 2 female and 2 male donors) islets; or treated after 24 h without (-) or with cytokine mix (CYT) for an additional 24 h. Mouse islet cells were (E) stained for TUNEL (green), insulin (red), and DAPI (blue), and (F) quantified for percent β-cell death represented as fold over Ad-Ctrl (n = 6; 2 female and 4 male donors), (Ad-Ctrl/- 1.30 ± 0.56% TUNEL-positive β cells). Human islet cells were (H) stained for LGR4 (green), insulin (red) and DAPI (blue) after 72 h; and (I) quantified for percent β-cell death represented as fold over Ad-Ctrl (n = 5; 2 female and 3 male donors), (Ad-Ctrl/- 0.68 ± 0.21% TUNEL-positive β cells). #p < 0.05, ##p < 0.01 vs Untr and AdCtrl groups in INS1 cells, and vs AdCtrl group in mouse and human islets with similar treatments. ∗∗p < 0.01 vs no cytokine treatment (−) from the same group. White bar indicates the scale for the immunofluorescent images (50 μm). Individual symbols in the graphs represent independent experiments in INS1 cells (A, C) or individual mouse (D, F) or human (G, I) islet preps, with controls derived from the same sex as AdLGR4, averaging duplicate samples for all experiments. All data represent mean ± SEM. Statistical analysis was by t-test for comparison of two groups, and by ANOVA with Tukey's post-hoc analysis for comparison of more than two groups. (For interpretation of the references to color in this figure legend, the reader is referred to the Web version of this article).
Figure 4
Figure 4
LGR4 improves β-cell survival through suppressing RANK-TRAF6 interaction and the subsequent activation of NFκB. INS1 cells were transfected with scrambled (SC) (black circles), Rank (Rankko) (brown diamonds), Lgr4 (Lgr4ko) (brown squares), or Lgr4 and Rank (double ko) (brown triangles), siRNAs (n = 4 each) and assayed for (A) Lgr4 and (B) Rank mRNAs by qPCR after 48 h, and (C) cell death by percent CC3-positive cells after 48 h. β-cell death, quantified as percent CC3-positive cells, in INS1 cells transfected with scrambled (SC) (black circles) or Lgr4 (Lgr4ko) (brown squares) siRNAs for 48 h, (D) and subsequently treated for 24 h without (Vehicle) or with RANKL or (E) RSPO1 (n = 4 each); or treated with (+) or without (−) TRAF6 peptide inhibitor for the last 16 h (n = 3). (E) Immunofluorescent staining for phSer468 NFκB p65 (green) and DAPI (blue) of these cells; (F) and quantification of nuclear phSer468 NFκB, with cytokine (CYT) treatment used as a positive control (n = 4). (G–H) Percent CC3-positive cells without (−) or with (+) treatment with PDTC inhibitor (G) under basal (n = 3) and (H) after cytokine-treatment for 16 h (n = 3). #p < 0.05, ##p < 0.01 vs SC and double ko groups with the same treatment. ∗p < 0.05, ∗∗p < 0.01 vs no inhibitor treatment (−) from the same group. White bar indicates the scale for the immunofluorescent images (50 μm). Individual symbols in the graphs represent independent experiments in INS1 cells, averaging duplicate samples. All data represent mean ± SEM. Statistical analysis was by t-test for comparison of two groups, and by ANOVA with Tukey's post-hoc analysis for comparison of more than two groups. (For interpretation of the references to color in this figure legend, the reader is referred to the Web version of this article).
Figure 5
Figure 5
Young adult Lgr4cko mice exhibit impaired β-cell health compared to WT controls under basal and increased metabolic stress. (A) Representative images of immunofluorescent staining of mouse pancreatic sections from 13-week-old WT and Lgr4cko female mice for pHH3 (red), insulin (green), and DAPI (blue). Percent pHH3-positive β-cells in WT and Lgr4cko (B) 13-week-old female (n = 6–8) and (C) 10-week-old male (n = 5) mice. (D) Representative images of immunofluorescent staining of mouse pancreatic sections from 11-week-old WT and Lgr4cko male mice for TUNEL (green), insulin (red), and DAPI (blue). Percent TUNEL-positive β-cells in WT and Lgr4cko (E) 13-week-old female (n = 6–8) and (F) 11-week-old male (n = 5) mice. (G) Percent pHH3-positive β-cells and (H) percent TUNEL-positive β-cells in WT and Lgr4cko male mice fed SD or HFD (n = 6–7) for 14 weeks. (I) Percent TUNEL-positive β-cells in WT and Lgr4cko male mice (n = 5–6) at day 7 after 5 days of STZ treatment. #p < 0.05, ##p < 0.01 vs the WT group with the same treatment. White bar indicates the scale for the immunofluorescent images (50 μm). Individual symbols in the graphs represent individual mice, with blue square symbols representing male and pink square symbols representing female Lgr4ko mice, and black circles representing WT mice of the same corresponding sex. All data represent mean ± SEM. Statistical analysis was by t-test for comparison of two groups, and by ANOVA with Tukey's post-hoc analysis for comparison of more than two groups. (For interpretation of the references to color in this figure legend, the reader is referred to the Web version of this article).
Figure 6
Figure 6
Simultaneous deletion of Rank in Lgr4/Rank dko mice rescues the impaired β-cell phenotype of Lgr4cko mice. 11-13-week-old WT (black circles) and Lgr4/Rank dko (triangles, blue male and pink female) mice were analyzed for islet expression of Lgr4 in (A) male (n = 5–8) and (B) female (n = 4–5) mice; of Rank in (C) male (n = 5–8) and (D) female (n = 4–5) mice; for β-cell proliferation by assessing for percent pHH3-positive β-cells in (E) male (n = 5–6) and (F) female (n = 5) mice; for β-cell death by quantifying percent TUNEL-positive β-cells in (G) male (n = 5–6) and (H) female (n = 5) mice. #p < 0.05, vs the WT group. Individual symbols in the graphs represent individual mice, with WT mice of the same corresponding sex as the Lgr4/Rank dko mice. All data represent mean ± SEM. Statistical analysis was done by t-test for comparison of two groups. (For interpretation of the references to color in this figure legend, the reader is referred to the Web version of this article).
Figure 7
Figure 7
Aging impairs glucose homeostasis in female but not male Lgr4cko mice. Glucose clearance (A, C, E, G) and area under the curve (B, D, F, H) during IPGTT in aged WT (black circle symbols) and (A–D) Lgr4cko male (blue square symbols) mice at (A, B) 11–12 months (n = 6–8) and (C, D) 19–20 months (n = 5–10) of age, and (E–H) Lgr4cko female (pink square symbols) mice at (E, F) 11–12 months (n = 6–7) and (G, H) 19–20 months (n = 5–7) of age. (I, J) Plasma insulin in WT and Lgr4cko mice at 0- and 15-min time points of the IPGTT performed at 19–20 months of age in (I) male (n = 5–10) and (J) female (n = 3–6) mice. (K, L) Plasma insulin in WT and Lgr4cko mice at 23 months of age in (K) male (n = 4–9) and (L) female (n = 6–7) mice. #p < 0.05, ##p < 0.01 vs the WT group at the same time-point. ∗p < 0.05 vs 0 min in the same group. Individual symbols in the bar graphs represent individual mice, with WT mice of the same corresponding sex as the Lgr4cko mice. All data represent mean ± SEM. Statistical analysis was by t-test for comparison of two groups, and by ANOVA with Tukey's post-hoc analysis for comparison of more than two groups. (For interpretation of the references to color in this figure legend, the reader is referred to the Web version of this article).
Figure 8
Figure 8
Aged Lgr4cko male and female mice exhibit reduced β-cell proliferation, increased β-cell death, and reduced β-cell maturation. β-cell histomorphometry in 23-month-old WT (black circle symbols) and Lgr4cko (square symbols, blue for male, pink for female) mice assessing for percent pHH3-positive β-cells in (A) female (n = 4–5) and (B) male (n = 4–7) mice; percent TUNEL-positive β-cells in (C) female (n = 4–5) and (D) male (n = 4–7) mice; immunohistochemical staining for insulin in (E) female and (F) male mice (representative images); β-cell mass in (G) female (n = 4–5) and (H) male (n = 3–6) mice; (I) representative images of immunofluorescent staining for UCN3 (red) and insulin (green) in young (13-week-old) female mice; (J) quantification of MFI of UCN3 in islets of young and aged (23-month-old) female mice; (K) representative images of immunofluorescent staining for UCN3 (red) and insulin (green) in young (11-week-old) male mice; (L) quantification of mean fluorescent intensity (MFI) of UCN3 in islets of young and aged (23-month-old) male mice; mice. #p < 0.05, ##p < 0.01, ###p < 0.001, ####p < 0.0001, vs the WT group. Individual symbols in the A-D, G, H graphs represent individual mice, and in J, L graphs represent individual islets (10 islets/mouse, n = 3–5 mice/group were analyzed for J, L), with WT mice of the same corresponding sex as the Lgr4cko mice. All data represent mean ± SEM. Statistical analysis was done by t-test for comparison of two groups. (For interpretation of the references to color in this figure legend, the reader is referred to the Web version of this article).
figs1
figs1
figs2
figs2
figs3
figs3
figs4
figs4

Update of

References

    1. Eizirik D.L., Pasquali L., Cnop M. Pancreatic beta-cells in type 1 and type 2 diabetes mellitus: different pathways to failure. Nat Rev Endocrinol. 2020;16(7):349–362. - PubMed
    1. Atkinson M.A., Roep B.O., Posgai A., Wheeler D.C.S., Peakman M. The challenge of modulating beta-cell autoimmunity in type 1 diabetes. Lancet Diabetes Endocrinol. 2019;7(1):52–64. - PMC - PubMed
    1. Roep B.O., Thomaidou S., van Tienhoven R., Zaldumbide A. Type 1 diabetes mellitus as a disease of the beta-cell (do not blame the immune system?) Nat Rev Endocrinol. 2021;17(3):150–161. - PMC - PubMed
    1. Halim M., Halim A. The effects of inflammation, aging and oxidative stress on the pathogenesis of diabetes mellitus (type 2 diabetes) Diabetes Metabol Syndr. 2019;13(2):1165–1172. - PubMed
    1. Böni-Schnetzler M., Meier D.T. Islet inflammation in type 2 diabetes. Semin Immunopathol. 2019;41(4):501–513. - PMC - PubMed