. 2025 Jun 5;65(6):2400615.
doi: 10.1183/13993003.00615-2024. Print 2025 Jun.

Inhibition of AXL ameliorates pulmonary fibrosis via attenuation of M2 macrophage polarisation

Affiliations

Inhibition of AXL ameliorates pulmonary fibrosis via attenuation of M2 macrophage polarisation

Dong Ha Kim et al. Eur Respir J. .

Abstract

Rationale: Although a relationship between the growth arrest-specific 6 (GAS6)/anexelekto (AXL) pathway and pulmonary fibrosis has been suggested, the precise mechanisms and clinical implications of the AXL pathway in idiopathic pulmonary fibrosis are still unclear.

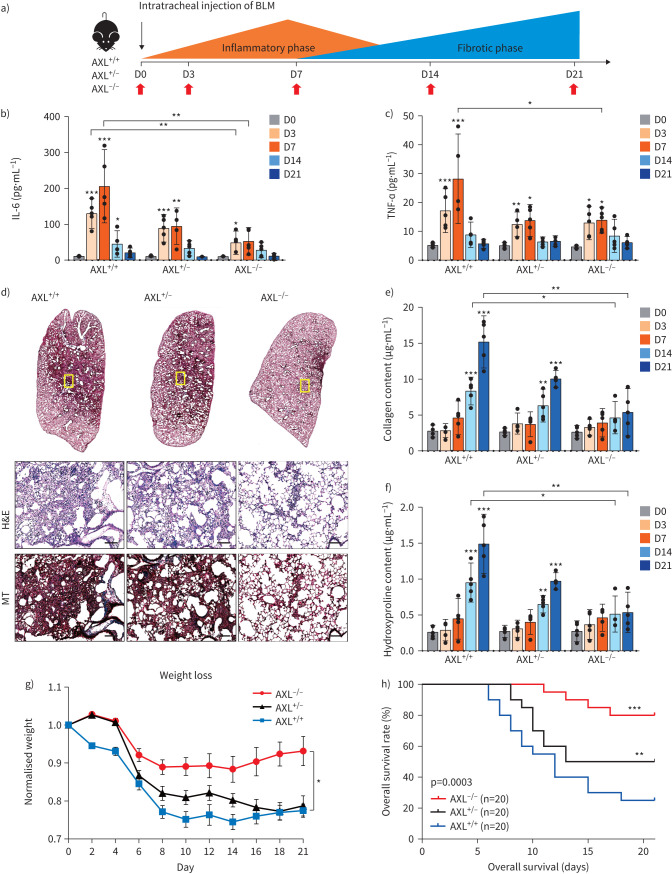
Methods: Constitutive and conditional AXL-knockout mice were generated and injected with bleomycin to induce pulmonary fibrosis. The expression of AXL and macrophage subtypes in bleomycin-injected mice and patients with idiopathic pulmonary fibrosis was analysed using flow cytometry. The therapeutic effects of the AXL inhibitors were examined.

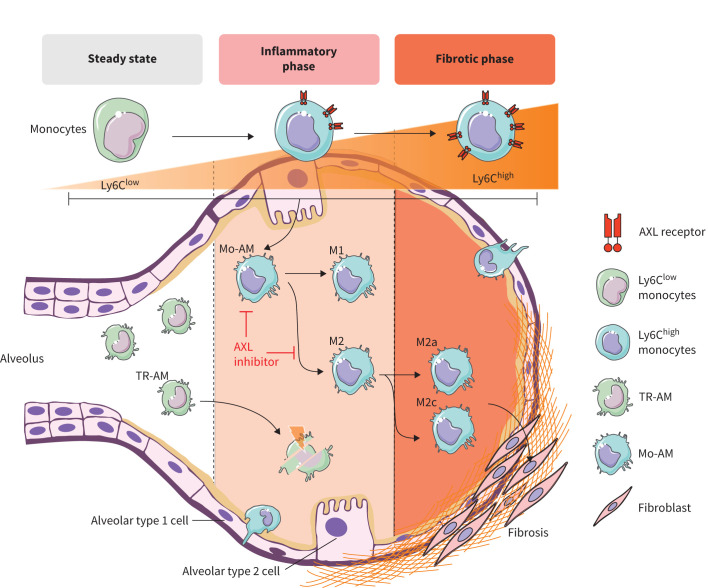
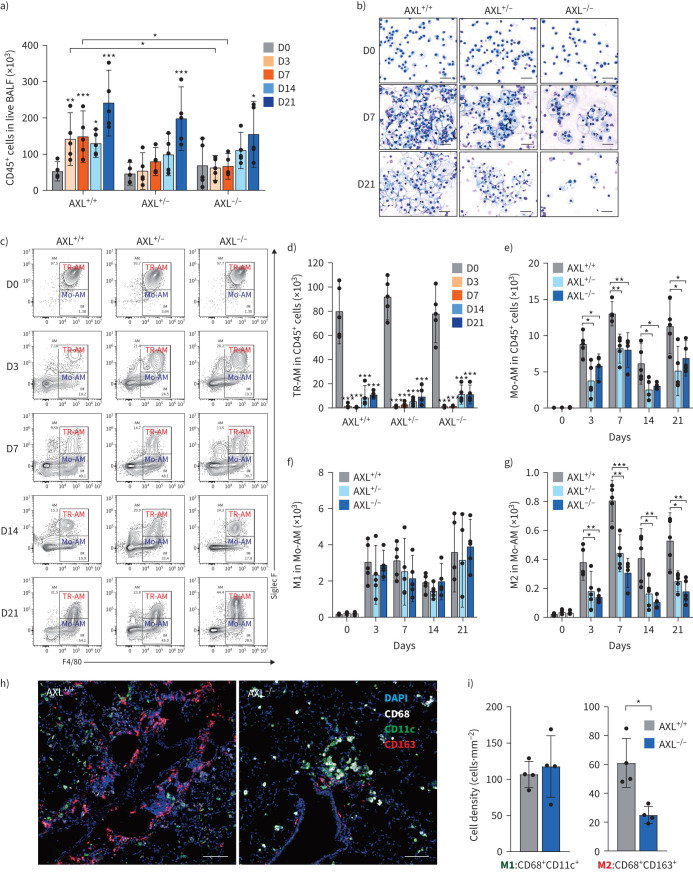
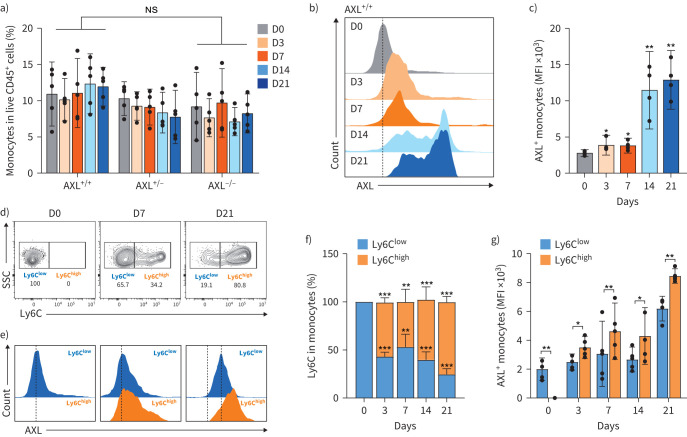
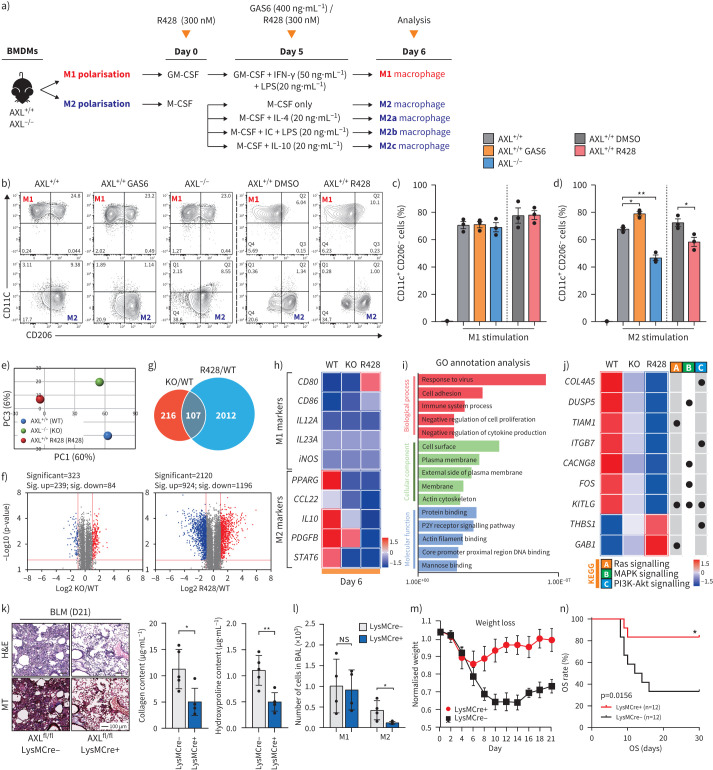
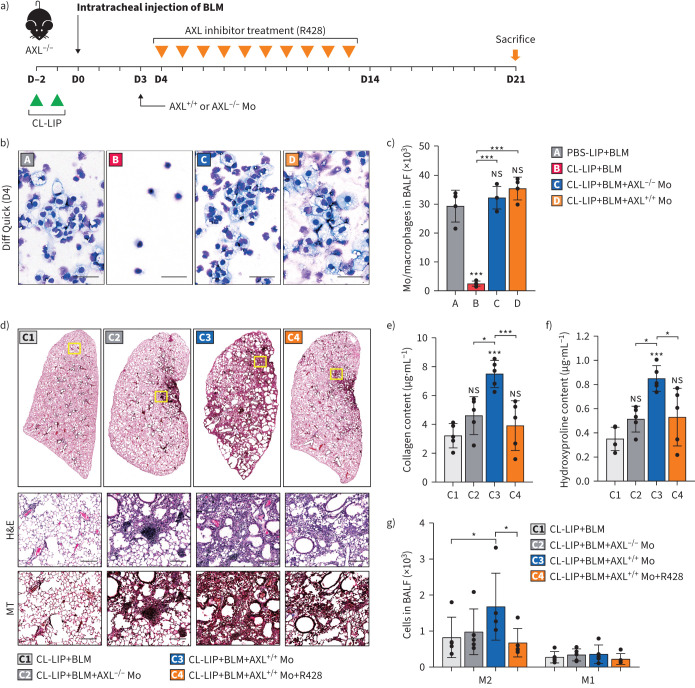
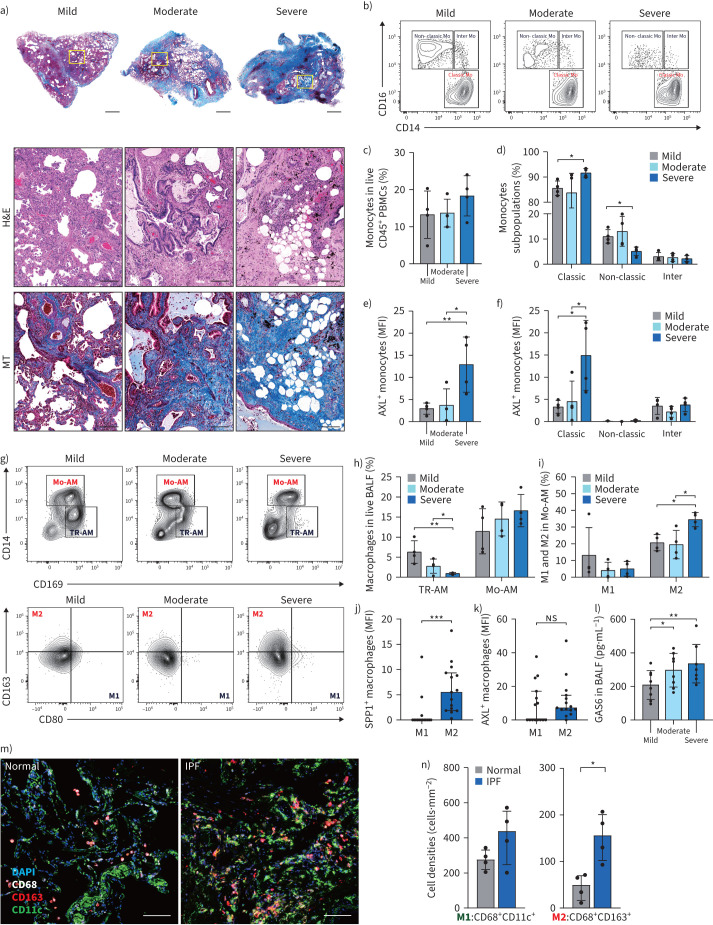
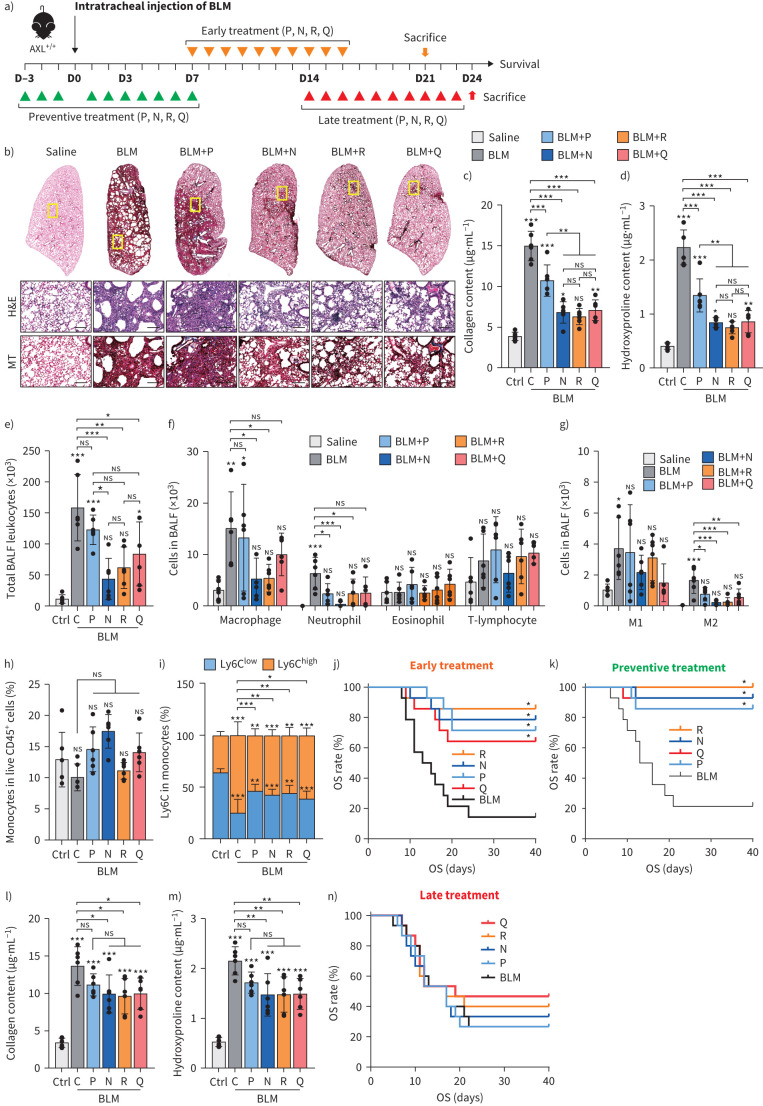
Results: AXL-deficient mice were resistant to bleomycin-induced pulmonary fibrosis and had a lower degree of M2-like macrophage differentiation than wild-type mice. Interestingly, AXL expression in monocytes was enhanced according to the progression of bleomycin-induced pulmonary fibrosis, and these results were especially prominent in lymphocyte antigen 6C (Ly6C)high monocytes. Gene silencing or inhibitor treatment with AXL inhibited the differentiation of M2-like macrophages during bone marrow-derived macrophage differentiation. These results were confirmed through experiments using AXLfl/flLysMCre+ mice and systems with depletion and reconstitution of macrophages. In line with these results, patients with severe idiopathic pulmonary fibrosis had high AXL expression in monocytes, high GAS6 levels and an enhanced population of M2-like macrophages compared to those with mild idiopathic pulmonary fibrosis. Lastly, treatment with AXL inhibitors ameliorated bleomycin-induced pulmonary fibrosis and improved survival rates.

Conclusions: The AXL pathway in classical monocytes contributes to pulmonary fibrosis progression through the induction of M2-like macrophage differentiation. Therefore, targeting AXL may be a promising therapeutic option for pulmonary fibrosis.


Conflict of interest statement

Conflict of interest: Y. Lee and Y. Yang are employees of Qurient, Seongnam, South Korea, which developed the QS0262 compound reported in this study. The remaining authors declare no potential conflicts of interest.

Figures

None
Overview of the study. AXL: anexelekto; Ly6C: lymphocyte antigen 6C; Mo-AM: monocyte-derived alveolar macrophage; TR-AM: tissue-resident alveolar macrophage.
FIGURE 1
FIGURE 1
Effects of bleomycin (BLM)-induced pulmonary fibrosis in anexelekto (AXL)-deficient mice. a) Schematic of experimental design. BLM was intratracheally injected into the mice at day (D) 0. For time-dependent experiments, AXL wild-type (AXL+/+), heterozygous (AXL+/−) and deficient (AXL−/−) mice (n=5 mice per group) were killed at day D0 (untreated control groups), D3, D7, D14 and D21. Lung tissues, bronchoalveolar lavage fluid (BALF) and blood samples were collected. b, c) The expression of inflammatory cytokines interleukin 6 (IL-6) and tumour necrosis factor α (TNF-α) in the lung tissues of BLM-injected mice was evaluated at the indicated time points using a sandwich ELISA analysis. d) Representative images of haematoxylin and eosin (H&E) and Masson's trichrome (MT) staining across the whole lungs and affected areas at D21 after BLM injection. Scale bars: 100 μm. e, f) Collagen content analysis using collagen and hydroxyproline assay. g) Weight loss and h) Kaplan–Meier survival curves in BLM-injected mice (n=20 mice per group). Data are presented as mean±sd. *: p<0.05; **: p<0.005; ***: p<0.0005.
FIGURE 2
FIGURE 2
Changes in alveolar macrophages in bleomycin (BLM)-induced pulmonary fibrosis. After intratracheal injection of BLM, bronchoalveolar lavage fluid (BALF) samples of anexelekto (AXL) wild-type (AXL+/+), heterozygous (AXL+/−) and deficient (AXL−/−) mice were collected at each time point. a) Quantitative analysis of live CD45+ cells in BALF samples. b) Representative images of Diff-Quick-stained BALF cells on day (D) 0, D7 and D21. Scale bars: 50 μm. c–g) Identification of macrophage subpopulations in BALF using flow cytometric analysis. c) Representative contour plot images showing tissue-resident alveolar macrophage (TR-AM) and monocyte-derived alveolar macrophage (Mo-AM) populations. d) Number of TR-AMs (CD11blowLy6GF4/80+siglecF+) relative to live CD45+ cells in BALF. e) Number of Mo-AMs (CD11bhighLy6GF4/80+SiglecF) among live CD45+ cells in BALF. f, g) Numbers of M1-like (CD11c+CD206) (f) and M2-like (CD11cCD206+) (g) macrophages among live Mo-AMs (n=5 mice per group at each time point). h) Representative images of multiplex immunohistochemistry depicting macrophage populations in formalin-fixed paraffin-embedded lung tissues of AXL wild-type (AXL+/+) and deficient (AXL−/−) mice at D21 after BLM injection. Scale bars: 100 μm. i) Comparison of cell density (positive cells per mm2) of M1-like macrophages (CD68+CD11c+) and M2-like macrophages (CD68+CD163+). Data are presented as mean±sd (n=4 mice per group). *: p<0.05; **: p<0.005; ***: p<0.0005.
FIGURE 3
FIGURE 3
Expression of anexelekto (AXL) and lymphocyte antigen 6C (Ly6C) in monocytes in bleomycin (BLM)-induced pulmonary fibrosis. After intratracheal injection of BLM, blood samples of AXL wild-type (AXL+/+), heterozygous (AXL+/−) and deficient (AXL−/−) mice were collected at each time point and blood monocytes were analysed using flow cytometry. a) Percentage of monocytes (CD3CD19siglecFLy6G) relative to live CD45+ cells in blood. b) Representative histogram and c) mean fluorescence intensity (MFI) of AXL surface expression in total monocytes in the blood. d) Representative contour plots depicting Ly6C expression. The gates indicate the ratio of Ly6Clow to Ly6Chigh cells in blood monocytes and f) this frequency expressed as a percentage. e) Representative histogram and g) MFI of AXL surface expression on Ly6Clow and Ly6Chigh monocytes in blood. Data are presented as mean±sd; n=5 mice per group at each time point. D: day; ns: nonsignificant; SSC: side scatter. *: p<0.05; **: p<0.005; ***: p<0.0005.
FIGURE 4
FIGURE 4
Macrophage polarisation through anexelekto (AXL) and validation through myeloid-specific deletion AXLfl/flLysMCre+ mice. a) Schematic diagram of the in vitro polarisation experiment. Bone marrow-derived macrophages (BMDMs) were isolated from AXL wild-type (AXL+/+) and deficient (AXL−/−) mice, differentiated in vitro into M1-like and M2-like macrophage subtypes, and characterised using flow cytometry. b) Representative contour plots depicting the frequency of M1-like (CD11b+Ly6GF4/80+siglecFCD11c+CD206) and M2-like (CD11b+Ly6GF4/80+SiglecFCD11cCD206+) macrophages derived from the BMDMs of AXL+/+, growth arrest-specific 6 (GAS6)-treated AXL+/+, AXL−/− and R428-treated AXL+/+ mice, and the frequencies of c) M1-like and d) M2-like macrophages expressed as percentages. e–j) The mRNA sequencing dataset used BMDMs from AXL+/+, AXL−/− and R428-treated AXL+/+ mice stimulated with M2 for 6 days under macrophage colony-stimulating factor (M-CSF) treatment. e) Principal component (PC) analysis plot of merged mRNA-sequencing datasets. f) Volcano plots illustrating the distribution of mRNAs significantly up- and down-regulated (p<0.05) by more than 2-fold. g) Venn diagram showing the number of commonly expressed mRNAs between groups. h) Heatmap analysis showing the expression level of each of the five M1 and M2 markers. i) A Gene Ontology (GO) term enrichment analysis was based on 107 genes that showed common significant increases and decreases in each group. j) Heatmap showing differentially expressed genes through Kyoto Encyclopedia of Genes and Genomes (KEGG) analysis. k) Representative images of haematoxylin and eosin (H&E) and Masson's trichrome (MT) staining and collagen content analysis of affected areas 21 days after BLM injection in AXLfl/flLysMCre+ (LysMCre+) mice compared with AXLfl/flLysMCre− (LysMCre−) littermate controls. Scale bars: 100 μm l) Numbers of M1-like (CD11c+CD206) and M2-like (CD11cCD206+) macrophage subpopulations in LysMCre+ and LysMCre− were identified using flow cytometric analysis. m) Weight loss and n) Kaplan–Meier survival curves in BLM-injected mice (n=12 mice per group). Data are presented as mean±sd. GM-CSF: granulocyte–macrophage colony-stimulating factor; IC: immune complex; IFN-γ: interferon γ; IL: interleukin; KO: knockout; LPS: lipopolysaccharide; MAPK: mitogen-activated protein kinase; ns: nonsignificant; OS: overall survival; PI3K-Akt: phosphatidylinositol 3-kinase-protein kinase B; WT: wild-type. *: p<0.05; **: p<0.005; ***: p<0.0005.
FIGURE 5
FIGURE 5
Effects of anexelekto (AXL)-expressing monocytes in macrophage-depleted bleomycin (BLM)-induced pulmonary fibrosis. a) Schematic diagram of experimental design. AXL wild-type (AXL+/+) or deficient (AXL−/−) mouse bone marrow-derived monocytes (Mo) were adoptively transferred into clodronate liposome-treated (CL-LIP) or PBS liposome-treated (PBS-LIP) AXL−/− mice through intravenous tail vein injection at day (D) 3 of BLM induction. AXL inhibitors (R428) were orally administered for 10 days from D4 to D13 after BLM injection. b) Representative images of Diff Quick-stained bronchoalveolar lavage fluid (BALF) cells on D4. Scale bars: 50 μm. c) Quantitative analysis of monocyte/macrophage (CD3CD19siglecFLy6G) relative to live CD45+ cells in the BALF. d) Representative images of haematoxylin and eosin (H&E) and Masson's trichrome (MT) staining across the whole lungs and affected areas at D21 after BLM injection. Scale bars: 100 μm. e, f) Collagen content analysis using collagen and hydroxyproline assay. g) Numbers of M1-like (CD11c+CD206) and M2-like (CD11cCD206+) macrophage subpopulations were identified using flow cytometric analysis. Data are presented as mean±sd, n=4 mice per group. ns: nonsignificant. *: p<0.05; **: p<0.005; ***: p<0.0005.
FIGURE 6
FIGURE 6
Clinical implication of monocytes and alveolar macrophages in patients with idiopathic pulmonary fibrosis (IPF). IPF patients were classified into mild, moderate and severe disease groups. Blood, bronchoalveolar lavage fluid (BALF) and tissues were collected and analysed from four patients in each group. a) Representative images of lung tissue according to the severity of IPF. Upper scale bars: 1 mm; lower scale bars: 200 μm. b) Representative contour plots depicting monocytes (Mo) and their subsets from whole blood. c, d) Percentage of monocytes (CD3CD19CD56) (c) and monocyte subsets (d) relative to live CD45+ cells in peripheral blood mononuclear cells (PBMCs). e, f) Mean fluorescence intensity (MFI) of anexelekto (AXL) surface expression in monocytes (e) and monocyte subsets (f) according to disease severity. g) Representative contour plot image showing alveolar macrophage populations in the BALF according to disease severity. The gate in the upper plot shows the ratio of tissue-resident alveolar macrophages (TR-AMs) to monocyte-derived alveolar macrophages (Mo-AMs), and the lower plot shows the expression of M1-like and M2-like Mo-AM cell subpopulations. h, i) The expression of each population and their frequencies expressed as percentages. j, k) MFI of secreted phosphoprotein 1 (SPP1) (j) and AXL (k) in Mo-AM subsets. l) Evaluation of growth arrest-specific 6 (GAS6) expression levels in BALF according to disease severity using ELISA. m) Representative images of multiplex immunohistochemistry depicting macrophage populations in formalin-fixed paraffin-embedded lung specimens from IPF and adjacent normal tissues. Scale bars: 100 μm. n) Comparison of cell density (positive cells per mm2) of M1-like macrophages (CD68+CD11c+) and M2-like macrophages (CD68+CD163+). Data are presented as mean±sd; n=4–8 IPF patients per group. Classic: classical; Inter: intermediate; ns: nonsignificant. *: p<0.05; **: p<0.005; ***: p<0.0005.
FIGURE 7
FIGURE 7
Effects of anexelekto (AXL) inhibitor on bleomycin (BLM)-induced pulmonary fibrosis. a) Schematic diagram of the experimental design. BLM was intratracheally injected into AXL wild-type (AXL+/+) mice at day (D) 0. For the preventive treatment group, pirfenidone (P), nintedanib (N) and the AXL inhibitors R428 (R) and QS0262 (Q) were orally administered for 10 days from D−3 to D7 after BLM injection except for D0, and the survival rate was assessed. Saline was used as a control (Ctrl). BLM alone was used as the BLM control (C). For the early treatment group, P, N and R and Q were orally administered for 10 days from D7 to D16 after BLM injection; on D21, the mice in the early treatment group were killed and the lung tissue, bronchoalveolar lavage fluid (BALF) and blood samples were collected and survival rate was assessed. For the late treatment group, each drug was administered orally for 10 days from D14 to D23 after BLM injection, and the mice were killed on D24. b) Early treatment group tissues were stained with haematoxylin and eosin (H&E) and Masson's trichrome (MT). Scale bars: 100 μm. c, d) Collagen content was estimated through an analysis of collagen (c) and hydroxyproline (d) to evaluate the degree of fibrosis. e–g) Live CD45+ total leukocytes (e) and macrophages, neutrophils, eosinophils and T-lymphocytes (f) in BALF and the numbers of M1-like (CD11c+CD206) and M2-like (CD11cCD206+) macrophage subpopulations (g) were identified using flow cytometric analysis. h) Monocytes (CD3CD19siglecFLy6G) relative to live CD45+ cells in blood. i) Frequency of lymphocyte antigen 6C (Ly6C)low and Ly6Chigh cells in blood monocytes expressed as percentage. Data are presented as mean±sd; n=6 mice per group. j, k) Kaplan–Meier survival curves of the early treatment and the preventive treatment groups (n=14 mice per group). l, m) Collagen and hydroxyproline analysis and n) Kaplan–Meier survival curves for the late treatment group (n=14 mice per group). ns: nonsignificant; OS: overall survival. *: p<0.05; **: p<0.005; ***: p<0.0005.

Comment in

Similar articles

Cited by

References

    1. Wijsenbeek M, Cottin V. Spectrum of fibrotic lung diseases. N Engl J Med 2020; 383: 958–968. doi:10.1056/NEJMra2005230 - DOI - PubMed
    1. Khor YH, Ng Y, Barnes H, et al. . Prognosis of idiopathic pulmonary fibrosis without anti-fibrotic therapy: a systematic review. Eur Respir Rev 2020; 29: 190158. doi:10.1183/16000617.0158-2019 - DOI - PMC - PubMed
    1. Ley B, Collard HR, King TE Jr. Clinical course and prediction of survival in idiopathic pulmonary fibrosis. Am J Respir Crit Care Med 2011; 183: 431–440. doi:10.1164/rccm.201006-0894CI - DOI - PubMed
    1. Sack C, Raghu G. Idiopathic pulmonary fibrosis: unmasking cryptogenic environmental factors. Eur Respir J 2019; 53: 1801699. doi:10.1183/13993003.01699-2018 - DOI - PubMed
    1. Grimminger F, Gunther A, Vancheri C. The role of tyrosine kinases in the pathogenesis of idiopathic pulmonary fibrosis. Eur Respir J 2015; 45: 1426–1433. doi:10.1183/09031936.00149614 - DOI - PubMed

MeSH terms

Substances