. 2025 Apr 7;74(5):825-839.
doi: 10.1136/gutjnl-2024-333492.

Induction of macrophage efferocytosis in pancreatic cancer via PI3Kγ inhibition and radiotherapy promotes tumour control

Affiliations

Induction of macrophage efferocytosis in pancreatic cancer via PI3Kγ inhibition and radiotherapy promotes tumour control

Shannon Nicole Russell et al. Gut. .

Abstract

Background: The immune suppression mechanisms in pancreatic ductal adenocarcinoma (PDAC) remain unknown, but preclinical studies have implicated macrophage-mediated immune tolerance. Hence, pathways that regulate macrophage phenotype are of strategic interest, with reprogramming strategies focusing on inhibitors of phosphoinositide 3-kinase-gamma (PI3Kγ) due to restricted immune cell expression. Inhibition of PI3Kγ alone is ineffective in PDAC, despite increased infiltration of CD8+ T cells.

Objective: We hypothesised that the immune stimulatory effects of radiation, and its ability to boost tumour antigen availability could synergise with PI3Kγ inhibition to augment antitumour immunity.

Design: We used orthoptic and genetically engineered mouse models of pancreatic cancer (LSL-KrasG12D/+;Trp53R172H/+;Pdx1-Cre). Stereotactic radiotherapy was delivered using contrast CT imaging, and PI3Kγ inhibitors by oral administration. Changes in the tumour microenvironment were quantified by flow cytometry, multiplex immunohistochemistry and RNA sequencing. Tumour-educated macrophages were used to investigate efferocytosis, antigen presentation and CD8+ T cell activation. Single-cell RNA sequencing data and fresh tumour samples with autologous macrophages to validate our findings.

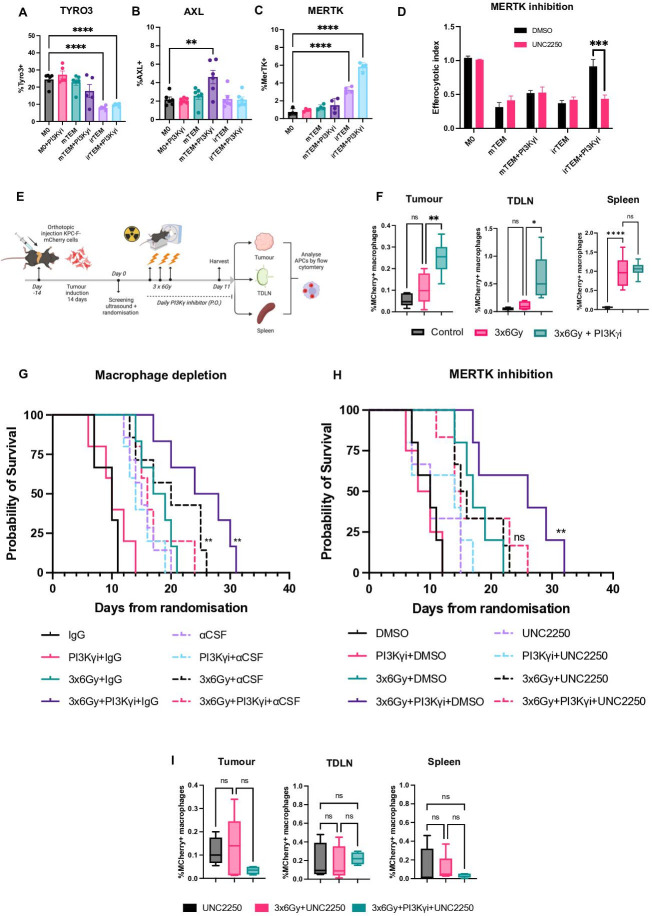
Results: Tumour-associated macrophages that employ efferocytosis to eradicate apoptotic cells can be redirected to present tumour antigens, stimulate CD8+ T cell responses and increase local tumour control. Specifically, we demonstrate how PI3Kγ signalling restricts inflammatory macrophages and that inhibition supports MERTK-dependent efferocytosis. We further find that the combination of PI3Kγ inhibition with targeted radiotherapy stimulates inflammatory macrophages to invoke a pathogen-induced like efferocytosis that switches from immune tolerant to antigen presenting.

Conclusions: Our data supports a new immunotherapeutic approach and a translational rationale to improve survival in PDAC.

Keywords: ANTIGEN PRESENTATION; CANCER; MACROPHAGES; PANCREATIC CANCER.


Conflict of interest statement

Competing interests: None declared.

Figures

Figure 1
Figure 1. IR combined with PI3Kγ inhibition constrains primary tumour growth but does not affect metastasis. (A,B) Single cell transcriptomic data from PDAC patients was used to determine UMAP plots of their (A) cellular identity and (B) corresponding PIK3CG expression. (C) Expression of selected PI3K isoforms across different cellular compartments. (D,E) UMAPs derived from scRNAseq analysis illustrating (D) macrophage phenotype and (E) their corresponding PI3KCG expression. (F) Forest plot displaying the results of a multivariate Cox regression analysis testing the effect macrophage clusters identified in patients on disease-free survival. Covariates include age, sex, tumour stage and prior radiation therapy. (G) Schematic outlining the experimental design for testing the effect of different treatments in orthotopically implanted tumours. (H) Kaplan-Meier survival plot of mice bearing orthotopic KPC tumours as treated in G; log-rank Mantel-Cox test, p<0.05). Representative example of n=3 independent experiments. (I) Tumour growth kinetics of mice bearing orthotopic KPC tumours as treated in (G). Analysed by one‐way analysis of variance (ANOVA) with Tukey’s post hoc adjustment (n=5–6 mice/group). Representative example of n=3 independent experiments. (J) Comparison of tumour volume 11 days following randomisation measured by 3D ultrasound. Representative ultrasound images are shown. Analysed by one‐way ANOVA with Tukey’s post hoc adjustment (n=4–7 mice/ treatment). (K) Cause of death of mice across the four treatment groups in mice with orthotopic tumours defined as either humane end-point (tumour >500 mm3) or disease progression. (L) Lungs were harvested 11 days following randomisation and metastases were quantified for each treatment group (n=5). Representative macroscopic images of isolated lungs stained with Bouin’s solution. Analysed by one‐way ANOVA with Tukey’s post hoc adjustment (n=4–7 mice/ treatment). *p<0.05, **p<0.01, ***p<0.001. Data presented as mean±SEM. PDAC, pancreatic ductal adenocarcinoma; PI3Kγ, phosphoinositide 3-kinase-gamma; TAM, tumour-associated macrophage.
Figure 2
Figure 2. IR combined with PI3Kγ inhibition reduces tumour epithelial cellularity and improves CD8+ T cell infiltration (A) Representative H&E-stained f orthotopic KPC-F tumour sections across each treatment group. (B) Mason’s trichrome staining of orthotopic KPC-F tumour sections from 3×6 Gy and 3×6Gy+PI3Kγ inhibitor treated animals. (C) E-cadherin was quantified in serial segments of tumour slices from the centre to the periphery (1–5) across each treatment group. Analysed by one‐way analysis of variance (ANOVA) with Tukey’s post hoc adjustment (n=3–5 mice/ group). (D) Immunofluorescent staining of KPC-F tumour sections across each treatment group. Purple=E-cadherin, blue=DAPI. (E) Representative spatial plots showing individual cell populations segmented using HALO machine-learning software. Data generated from multiplex immunofluorescent staining of KPC-F tumour sections across each treatment group. Cyan=E-cadherin, red=CD8, blue=CD4, green=CD68, yellow=NK1.1, orange=Gr-1. (F) Representative multiplex immunofluorescent images of treated tumour samples across treatment groups. Cyan=DAPI, purple=E-cadherin, green=CD8, blue=CD4, red=CD68, orange=NK1.1. Sections presented in panel A are identical to those in figure 3G but with all fluorescent channels and markers displayed. *p<0.05, **p<0.01, ***p<0.001. PI3Kγ, phosphoinositide 3-kinase-gamma.
Figure 3
Figure 3. Combined treatment alters innate and adaptive immune responses within the tumour-educated macrophage. (A) Flow cytometric analysis of tumour-associated macrophages (CD11b+F4/80+) KPC-F tumours receiving indicated treatments. Analysed by one‐way analysis of variance (ANOVA) with Tukey’s post hoc adjustment (n=5–9/group). Representative example of flow cytometry analysis of tumours from n=3 independent animal experiments. (B) Flow cytometric analysis of MDSCs (CD11b+F4/80- Gr-1+) in KPC-F tumours receiving indicated treatments. Analysed by one‐way ANOVA with Tukey’s post hoc adjustment (n=5–9/group). Representative example of flow cytometry analysis of tumours from n=3 independent animal experiments. (C) Flow cytometric analysis of CD8+ T cells (CD3+CD8+) in KPC-F tumours receiving indicated treatments. Analysed by one‐way ANOVA with Tukey’s post hoc adjustment (n=5–9/group). Representative example of flow cytometry analysis of tumours from n=3 independent animal experiments. (D) Representative immunofluorescent staining images of tumours sections from mice receiving treatments as indicated (purple=e-cadherin; blue=DAPI, green=CD8). (E) Bulk RNAseq analysis of tumours from each treatment group. A histogram of the log2fold change of these genes between each treatment group and the control group is shown (n=3). (F) Gene ontology analysis of top five upregulated and downregulated differentially expressed pathways between the IR versus IR+PI3Kγi. Pathways significant at p<0.05 are presented. (G) Immune deconvolution of each treatment group was performed on bulk tumour RNAseq data and subsequently plotted as a histogram. *p<0.05, **p<0.01, ***p<0.001. Data presented as mean±SEM. PI3Kγ, phosphoinositide 3-kinase-gamma.
Figure 4
Figure 4. Treatment with IR+PI3Kγ inhibition alters macrophage metabolism. (A) Schematic illustrating the workflow of producing tumour-educated macrophages (TEMs). (B+C) TEMs were generated as outlined in (A) in the (B) absence or (C) presence of PI3Kγ inhibitor, with expression of selected immune stimulatory and immunosuppressive genes analysed via RT-qPCR. Analysed by Mann-Whitney test. (D) Histogram of the log2fold change of these genes in irTEM±PI3Kγ inhibitor is shown (n=3 per condition). (E) Volcano plot comparing transcriptomic changes in irTEM±PI3Kγ inhibitor. Genes represented by blue (downregulated) and red dots (upregulated) are those with padj.<0.05. (F) Gene ontology analysis of top five upregulated and downregulated differentially expressed genes between irTEM±PI3Kγ inhibitor. Pathways significant at p<0.05 are presented. (G+H) The ability of (G) TEMs and (H) MDSCs to suppress CD8+ proliferation was quantified via flow cytometry. Primary murine macrophages and MDSCs were differentiated in vitro and exposed to LPS+IFNγ (M1), interleukin 4 (M2), tumour conditioned media (as indicated)±PI3Kγ inhibitor. Macrophages were then co-cultured with CFSE stained CD8+ T cells and proliferation assessed after 72 hours by flow cytometry. Data are presented as individual values with the horizontal bar representing the mean value. Statistical significance between PI3Kγ inhibitor and vehicle treated samples by two-tailed, one sample t-tests (n=3–4 per condition). Representative data from n=2 independent experiments. (I) RNAseq analysis of CD11b+ cells, with statistically significant differentially expressed genes identified and isolated. A histogram of the log2fold change of these genes in irTAM±PI3Kγ inhibitor is shown (n=4 per condition). (J) Volcano plot comparing transcriptomic changes in irTAM±PI3Kγ inhibitor. Genes represented by blue (downregulated) and red dots (upregulated) are those with padj.<0.05. (K) Gene ontology analysis of top five upregulated and downregulated differentially expressed genes between irTAM±PI3Kγ inhibitor. Pathways significant at p<0.05 are presented. *p<0.05, **p<0.01, ***p<0.001. PI3Kγ, phosphoinositide 3-kinase-gamma.
Figure 5
Figure 5. Treatment by irradiation and PI3Kγ inhibition increases the ability of macrophages to perform efferocytosis in both mice and humans. (A) Bioparticle phagocytosis in macrophages treated as indicated. Bone marrow-derived macrophages were exposed to LPS (M1), interleukin 4 (M2), tumour conditioned media±PI3Kγ inhibitor. Analysed by one‐way analysis of variance (ANOVA) with Tukey’s post hoc adjustment (n=5). Representative data from n=3 independent experiments. (B,C) Macrophages (B) and dendritic cells (C) were exposed to treatment conditions as indicated for 24 hours. Conditions were removed and OVALBUMIN coated beads were added and cells cultured for a further 4 hours. Beads were removed and cells co-cultured with B3Z T cells for 24 hours. B3Z T cell activation was quantified by measuring β-galactosidase activity colimetrically (optical density). Analysed by one‐way ANOVA with Tukey’s post hoc adjustment (n=4–5). Data representative of n=2 independent experiments. (D) Flow cytometric analysis of surface expression of calreticulin, phosphatidylserine and gas6 on untreated and IR treated KPC-F cells after 24 hours. Analysed by one‐way ANOVA with Tukey’s post hoc adjustment (n=4–5). (E) Schematic illustrating workflow of efferocytosis assay. KPC-F cells were irradiated (10 Gy) and stained with CFSE. Macrophages were exposed to indicated treatments including tumour cell conditioned media±PI3Kγ inhibitor. KPC-F tumour cells and macrophages were co-cultured for 4 hours at a ratio of 4:1 and subsequently analysed by flow cytometry. FITC+ macrophages were determined to be efferocytic. (F,G) Flow cytometric analysis of tumour-educated macrophages (TEMs) (F) and dendritic cells (G) co-cultured with irradiated KPC-F as per figure 5D. Representative flow cytometry plots are shown. Efferocytic cells were quantified by measuring total CFSE+ cells compared with CFSE− cells. Analysed by two-tailed, one sample t-tests (n=4–5). Representative of n=3 independent experiments. (H) Schematic illustrating the workflow for performing efferocytosis assay using samples obtained from human PDAC patients. Fresh tumour samples were embedded in agarose and precision cut using a vibratome. Slices were cultured treated with and without irradiation and conditioned media collected after 24 hours. Peripheral blood was collected from matched patients and CD14+ monocytes isolated by magnetic separation. Monocytes were cultured for 5 days in the presence of human M-CSF. Macrophages were exposed to tumour slice conditioned medium±PI3Kγ inhibitor for 24 hours. Pancreatic cancer PSN-1 cells were irradiated and stained with CFSE. Patient macrophages were co-cultured with matched macrophages for 4 hours at a ratio of 4:1 and subsequently analysed by flow cytometry. (I) Flow cytometric analysis of human TEMs co-cultured with irradiated CFSE labelled PSN-1 cells as per figure 5H. Analysed by one‐way ANOVA with Tukey’s post hoc adjustment (n=3). Data are representative of n=3 patient samples. (J) Quantification by flow cytometry of iNOS and Arginase expression in efferoyctic macrophages. Analysed by one‐way ANOVA with Tukey’s post hoc adjustment (n=3). (K) Culture media from macrophages receiving indicated treatments was collected and lactate concentration quantified by colorimetric assay. Data is presented as mean±SEM and analysed by two-tailed, one sample t-test (n=3). (L) Quantification of efferocytosis in macrophages receiving treatment as indicated. All groups received 2-DG to inhibit glycolysis. Efferocytic macrophages were quantified by measuring total CFSE+ macrophages compared with CFSE− macrophages (as per figure 5D). Data is presented as mean±SEM and analysed by one‐way ANOVA with Tukey’s post hoc adjustment (n=3). *p<0.05, **p<0.01, ***p<0.001. Data presented as mean±SEM. PI3Kγ, phosphoinositide 3-kinase-gamma.
Figure 6
Figure 6. Treatment by irradiation and PI3Kγ inhibition leads to MERTK-dependent efferocytosis. (A–C) Flow cytometric analysis of TYRO3, AXL and MERTK expression on macrophages. Analysed by one‐way analysis of variance (ANOVA) with Tukey’s post hoc adjustment (n=5). (D) Quantification of efferocytosis in mouse macrophages exposed to conditioned as indicated. MERTK was inhibited by adding UNC2250 60 min prior to the co-culture. Analysed by one‐way ANOVA with Tukey’s post hoc adjustment (n=5). (E) Schematic illustration of the experimental protocol for quantifying efferocytic macrophages and dendritic cells in vivo. Briefly, KPC-F-mCherry cells were grown orthotopically and mice treated with IR±PI3Kγ inhibition. Five days following the final fraction of IR, tumours, draining lymph nodes and spleens were collected and mCherry+ cells quantified by flow cytometry. (F) Flow cytometric analysis of mCherry+ macrophages (CD45+CD11b+F4/80+) in tumour, tumour-draining lymph nodes (TDLN) and spleen. Analysed by one‐way ANOVA with Tukey’s post hoc adjustment (n=5 mice/ condition). (G) Kaplan-Meier survival plot of mice bearing orthotopic KPC tumours as treated in figure 1G±anti CSF; log-rank Mantel-Cox test, p<0.05. Experiment conducted once. (H) Kaplan-Meier survival plot of mice bearing orthotopic KPC tumours as treated in figure 1G±UNC2250; log-rank Mantel-Cox test, p<0.05. Experiment conducted once. (I) Flow cytometric analysis of mCherry+ macrophages (CD45+CD11b+F4/80+) in tumour, tumour-draining lymph nodes (TDLN) and spleens from mice receiving indicated treatments. Analysed by one‐way ANOVA with Tukey’s post hoc adjustment (n=5 mice/ condition). Experiment conducted once. *p<0.05, **p<0.01, ***p<0.001. Data presented as mean±SEM. PI3Kγ, phosphoinositide 3-kinase-gamma.
Figure 7
Figure 7. Combined treatment increases antigen presentation locally and distally, increasing the number and potency of effector and memory CD8+ T cells and inducing immunity in vivo. (A) Schematic illustrating workflow for antigen presentation and CD8+ T cell activation assay. (B) Flow cytometric analysis of SIINFEKL expression on tumour-educated macrophages (TEMs) co-cultured for 4 hours with irradiated KPC-eGFP;OVA. Analysed by one‐way analysis of variance (ANOVA) with Tukey’s post hoc adjustment (n=3). (C) Flow cytometric analysis of memory (CD44hiCD62Lhi) CD8+ T cells after co-culture with macrophages (treated as per 7B). Data are presented as mean±SEM and analysed by analysed by one‐way ANOVA with Tukey’s post hoc adjustment (n5). (D) Flow cytometric analysis of IFNγ expression by memory CD8+ T cells. Analysed by one‐way ANOVA with Tukey’s post hoc adjustment (n5). (E) Immune deconvolution, with a focus on T cell phenotypes, of each treatment group performed on bulk tumour RNAseq data from mice obtained in figure 1G. (F) Tumour growth kinetics of orthotopic tumours in mice receiving treatments as indicated. Dashed lines correspond with groups receiving concurrent αCD8 antibody. Analysed by one‐way ANOVA with Tukey’s post hoc adjustment (n=5 mice/group). Data are shown from a single experiment. *p<0.05, **p<0.01, ***p<0.001. PI3Kγ, phosphoinositide 3-kinase-gamma.

References

    1. Kaneda MM, Messer KS, Ralainirina N, et al. PI3Kγ is a molecular switch that controls immune suppression. Nature New Biol. 2016;539:437–42. doi: 10.1038/nature19834. - DOI - PMC - PubMed
    1. De Henau O, Rausch M, Winkler D, et al. Overcoming resistance to checkpoint blockade therapy by targeting PI3Kγ in myeloid cells. Nature New Biol. 2016;539:443–7. doi: 10.1038/nature20554. - DOI - PMC - PubMed
    1. Xu H, Russell SN, Steiner K, et al. Targeting PI3K-gamma in myeloid driven tumour immune suppression: a systematic review and meta-analysis of the preclinical literature. Cancer Immunol Immunother. 2024;73:204. doi: 10.1007/s00262-024-03779-2. - DOI - PMC - PubMed
    1. Kaneda MM, Cappello P, Nguyen AV, et al. Macrophage PI3Kγ Drives Pancreatic Ductal Adenocarcinoma Progression. Cancer Discov. 2016;6:870–85. doi: 10.1158/2159-8290.CD-15-1346. - DOI - PMC - PubMed
    1. Büttner R, Longshore JW, López-Ríos F, et al. Implementing TMB measurement in clinical practice: considerations on assay requirements. ESMO Open. 2019;4:e000442. doi: 10.1136/esmoopen-2018-000442. - DOI - PMC - PubMed

MeSH terms

Substances