. 2025 Jun;246(6):2718-2737.
doi: 10.1111/nph.20364. Epub 2025 Jan 9.

Elevated CO2 alters soybean physiology and defense responses, and has disparate effects on susceptibility to diverse microbial pathogens

Affiliations

Elevated CO2 alters soybean physiology and defense responses, and has disparate effects on susceptibility to diverse microbial pathogens

Melissa Bredow et al. New Phytol. 2025 Jun.

Abstract

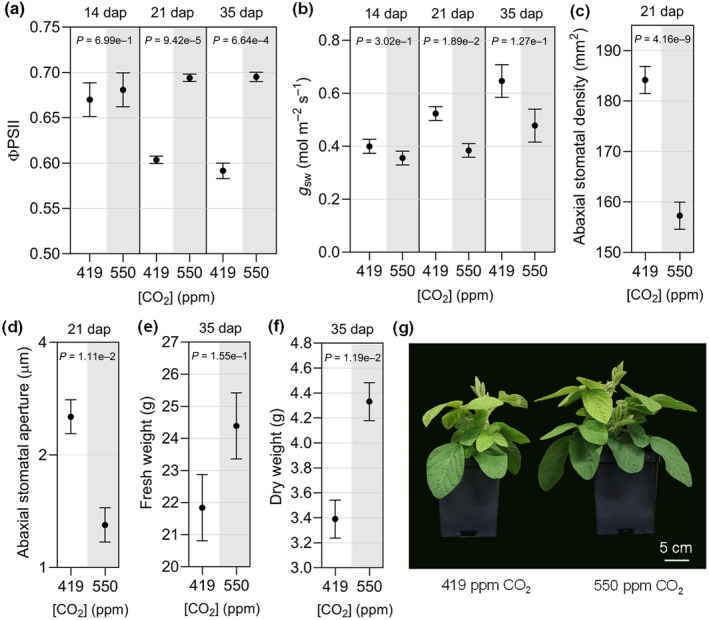
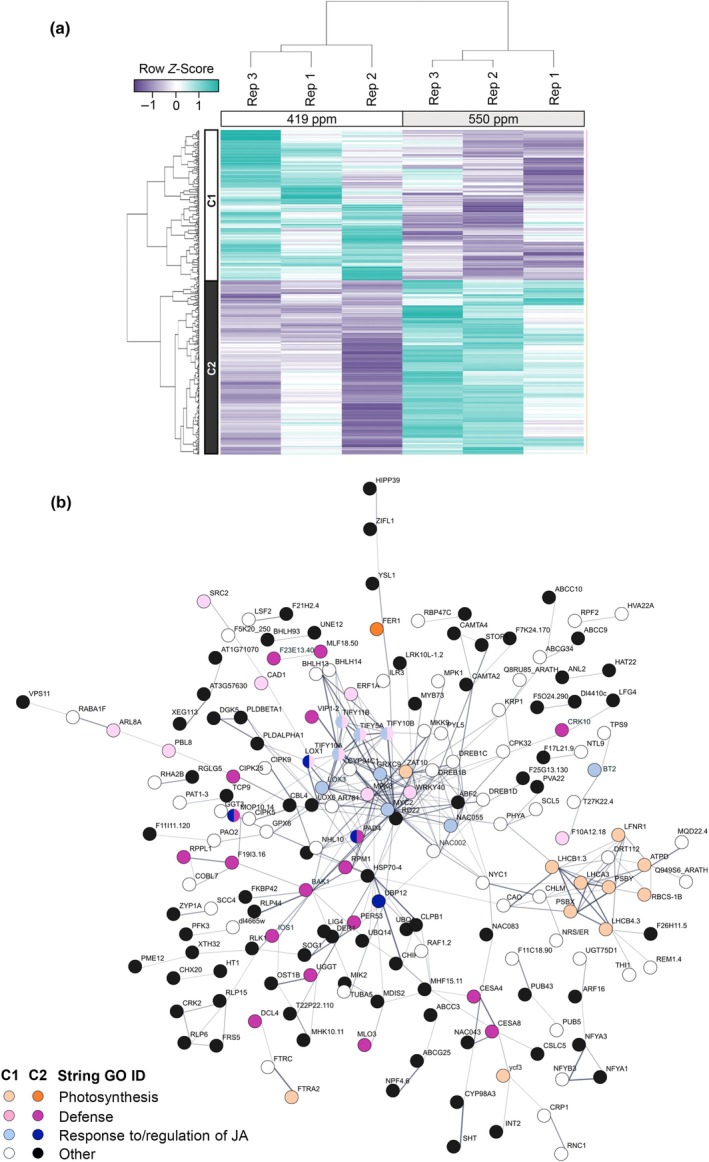
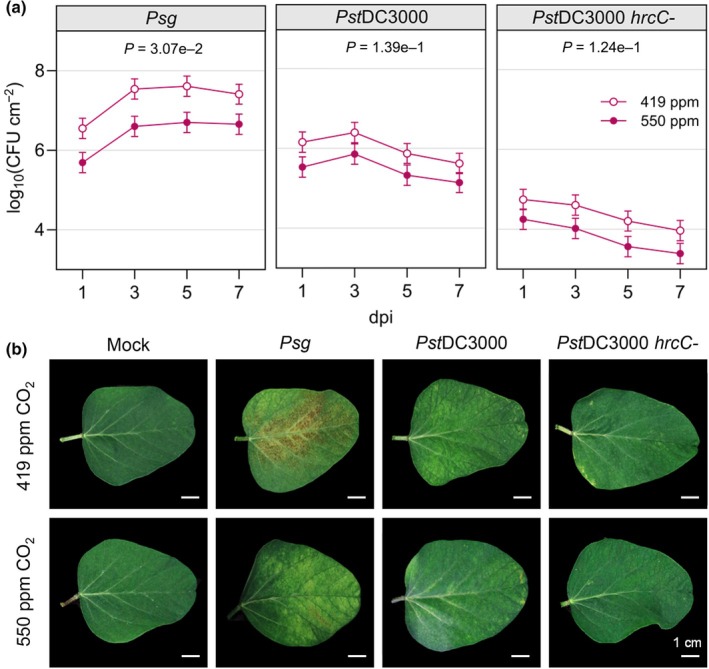
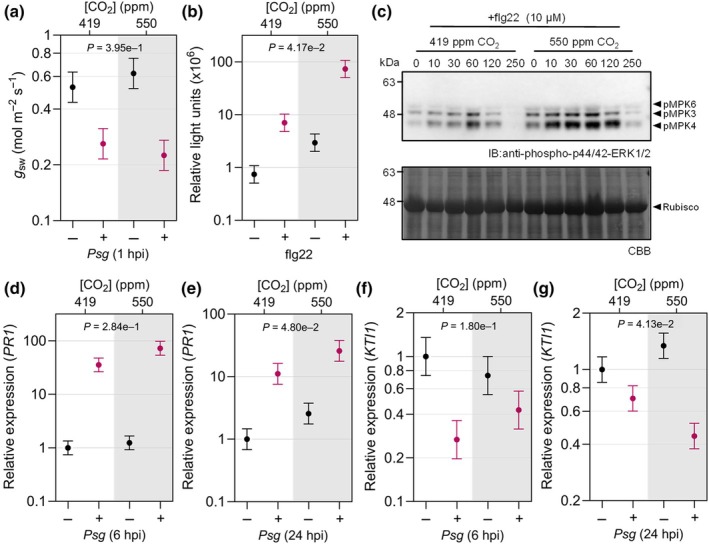
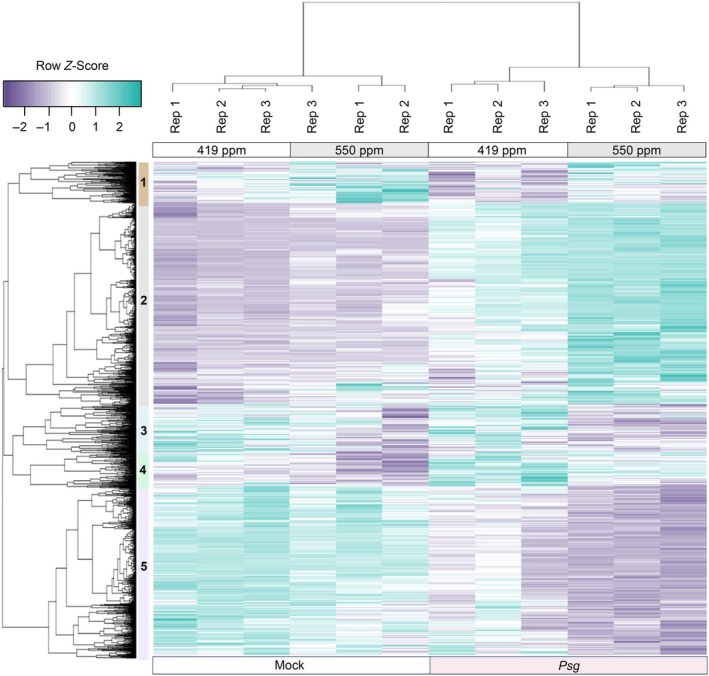
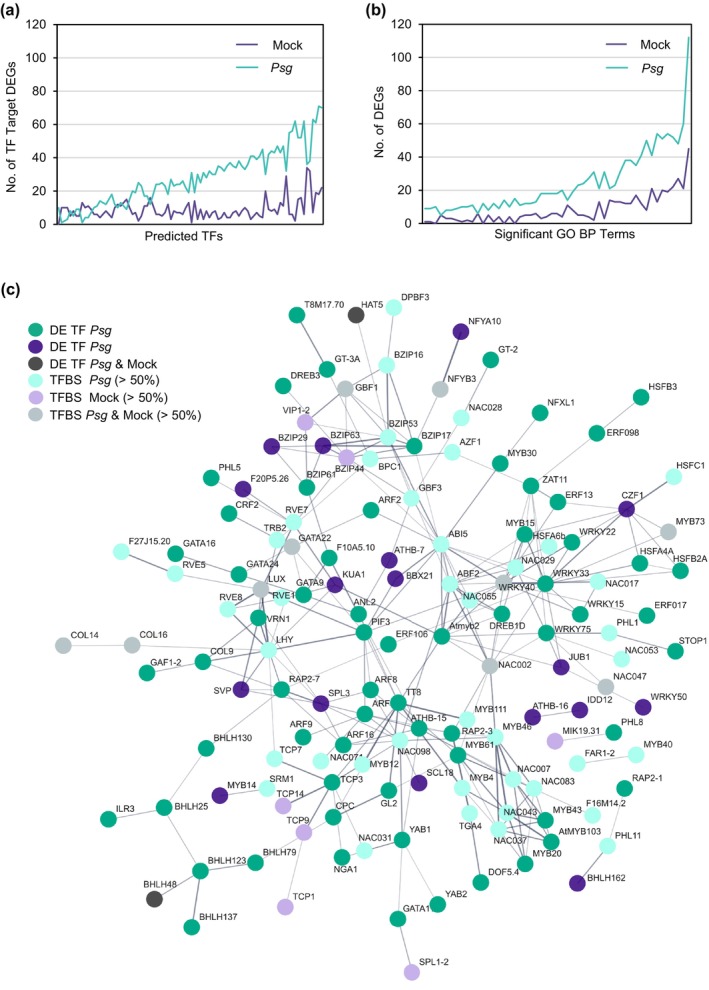
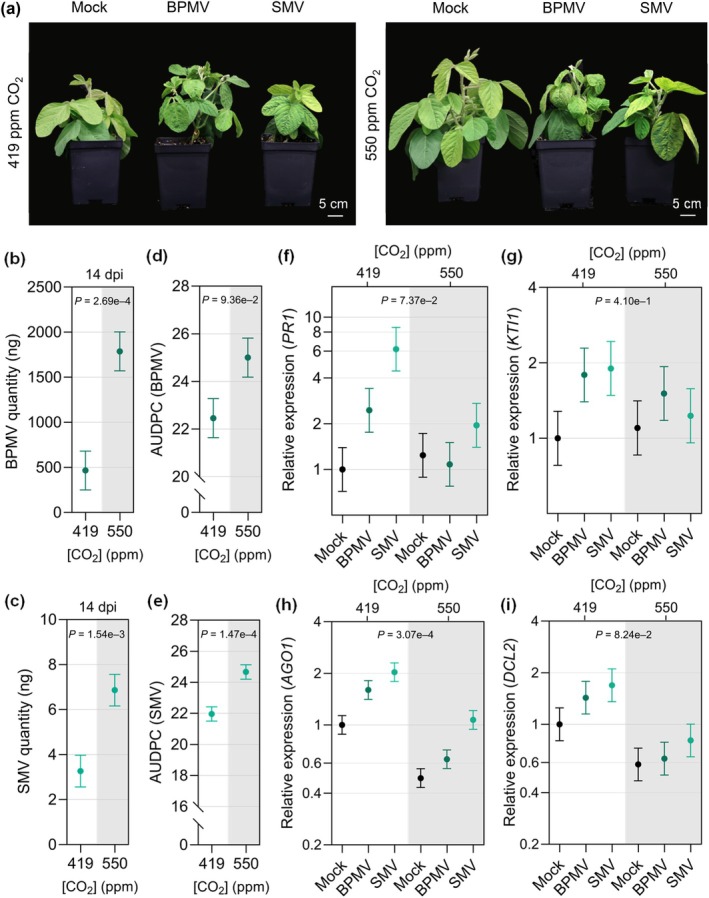
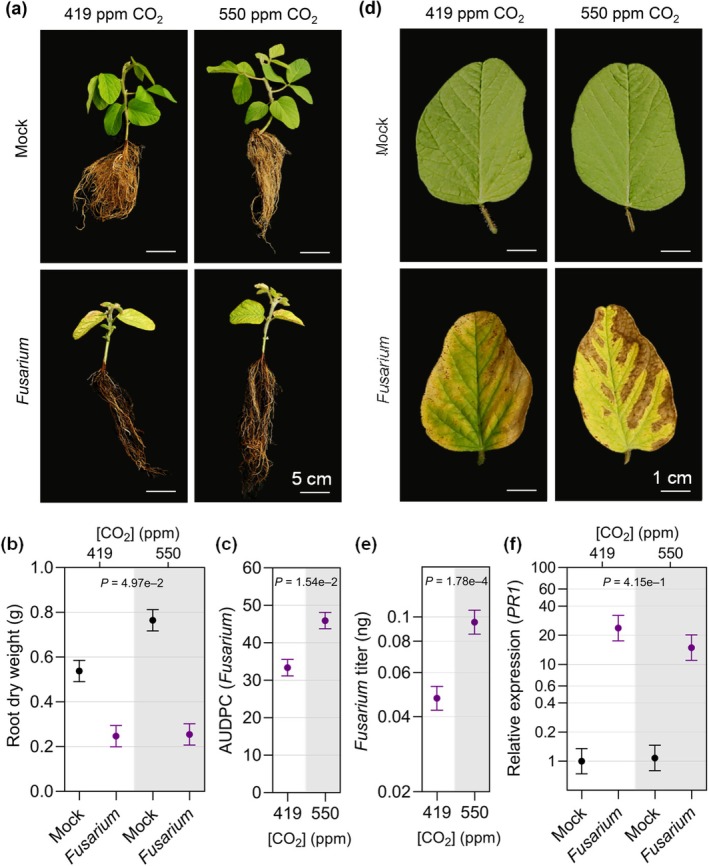
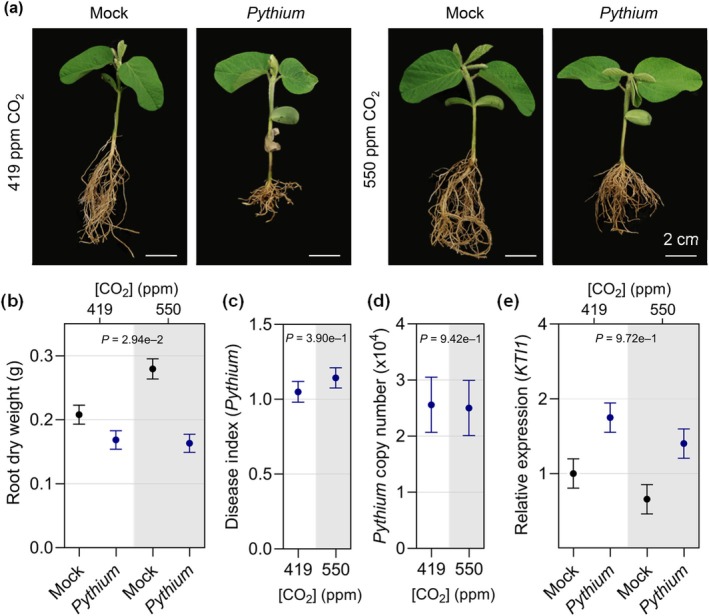
Increasing atmospheric CO2 levels have a variety of effects that can influence plant responses to microbial pathogens. However, these responses are varied, and it is challenging to predict how elevated CO2 (eCO2) will affect a particular plant-pathogen interaction. We investigated how eCO2 may influence disease development and responses to diverse pathogens in the major oilseed crop, soybean. Soybean plants grown in ambient CO2 (aCO2, 419 parts per million (ppm)) or in eCO2 (550 ppm) were challenged with bacterial, viral, fungal, and oomycete pathogens. Disease severity, pathogen growth, gene expression, and molecular plant defense responses were quantified. In eCO2, plants were less susceptible to Pseudomonas syringae pv. glycinea (Psg) but more susceptible to bean pod mottle virus, soybean mosaic virus, and Fusarium virguliforme. Susceptibility to Pythium sylvaticum was unchanged, although a greater loss in biomass occurred in eCO2. Reduced susceptibility to Psg was associated with enhanced defense responses. Increased susceptibility to the viruses was associated with reduced expression of antiviral defenses. This work provides a foundation for understanding how future eCO2 levels may impact molecular responses to pathogen challenges in soybean and demonstrates that microbes infecting both shoots and roots are of potential concern in future climatic conditions.

Keywords: Fusarium virguliforme; Glycine max; Pseudomonas syringae; Pythium sylvaticum; bean pod mottle virus; carbon dioxide; plant immunity; soybean mosaic virus.


Conflict of interest statement

None declared.

Figures

Fig. 1
Fig. 1
Effects of elevated CO2 on soybean physiology and growth. (a) Photosystem II (ΦPSII) activity and (b) stomatal conductance (g sw) were measured at the indicated days after planting (dap) using a LI‐600 portable system. (c) Stomatal density and (d) stomatal aperture measured at 21 dap using three randomly selected fields of view per leaf sample using a brightfield microscope. (e) Shoot fresh weight, (f) shoot dry weight, and (g) representative photos of soybean plants at 35 dap. Measurements and samples were taken from the unifoliate leaves at 14 dap or the newest fully expanded trifoliate leaves at 21 and 35 dap of 10 plants at each time point, except ΦPSII and g sw, which were measured in 15 plants per CO2 treatment. The three experimental replicates were conducted simultaneously in independent CO2 controlled chambers using a replicated completely randomized design. Data were graphed as the mean across the three replicates with SE bars. Linear mixed effect model (LMM) analysis was applied to the fourth power of ΦPSII 35 dap and log‐transformed stomatal aperture data due to unequal variance on the original scale. P‐values were computed based on F‐tests for the effect of CO2 at each time point from the LMM analysis. The letter e denotes an exponent to the power of 10 and ppm denotes parts per million.
Fig. 2
Fig. 2
Transcriptomic analysis of soybean gene expression in leaves of plants grown under ambient CO2 (aCO2) (419 parts per million (ppm)) or elevated CO2 (eCO2) (550 ppm). (a) Differentially expressed genes (DEG) responding to eCO2 were identified using a false discovery rate < 0.01 (Supporting Information Table S4). Samples for 3′ mRNA‐Seq analysis were taken from the newest fully expanded trifoliate leaves of soybean plants at 21 d after planting (dap). The three experimental replicates (Rep) were conducted simultaneously in independent CO2‐controlled chambers using eight plants per CO2 treatment. Row Z‐scores were used for hierarchical clustering of DEGs, based on expression across samples and replicates. Two expression clusters were identified. DEGs in Cluster 1 (C1) were expressed at higher levels in 419 ppm vs 550 ppm CO2 and DEGs in Cluster 2 (C2) were expressed at higher levels in 550 ppm vs 419 ppm CO2. (b) STRING network for DEGs identified between aCO2 and eCO2 in leaves at 21 dap. The 388 genes identified in soybean correspond to 321 genes in Arabidopsis thaliana that were used to assign functional annotations (String Gene Ontology Identifiers (GO ID)). Lightly shaded or white circles indicate DEGs from C1 and brightly shaded and black circles indicate DEGs from C2.
Fig. 3
Fig. 3
Soybean plants growing in elevated CO2 are less susceptible to Pseudomonas syringae. (a) Colony‐forming units (CFU) of P. syringae pv. glycinea race 4 (Psg), P. syringae pv. tomato (PstDC3000) and PstDC3000 hrcC‐ were quantified in the unifoliate leaves of plants at 1, 3, 5, and 7 d post inoculation (dpi). The unifoliate leaves of 24 plants were sampled for each treatment group, and three independent biological replicates were performed. Data points represent the mean CFU count of the three biological replicates with SE bars. P‐values were computed using t‐tests for the contrast between two CO2 levels of each pathogen averaged over dpi from the linear mixed effect model analysis. (b) Representative images of unifoliate leaves photographed at 7 dpi. Mock plants were treated with 10 mM MgCl2, 0.04% Silwet L‐77 solution with no bacteria. The letter e denotes an exponent to the power of 10.
Fig. 4
Fig. 4
Bacterially induced defense signaling is more strongly upregulated in soybean leaves grown under elevated CO2. (a) Stomatal conductance (g sw) at 1 h post inoculation (hpi) with Pseudomonas syringae pv. glycinea race 4 (Psg). (b) Reactive oxygen species (ROS) production in response to bacterial flagellin 22 (flg22) peptide was quantified using a chemiluminescence assay. Relative light units were determined using leaf disks from 12 plants per treatment, and (c) flg22‐induced MAPK activation using protein extracted from 12 plants per time point (0 to 250 min after treatment) and visualized by immunoblot analysis. Expression of PR1 (SA marker gene) (d) 6 hpi and (e) 24 hpi and expression of KTI1 (JA marker gene) (f) 6 hpi and (g) 24 hpi with Psg or mock treatment was assessed by reverse transcription quantitative polymerase chain reaction. RNA was extracted from six plants per treatment, and expression was measured relative to the Skp1 housekeeping gene. All experiments were conducted using leaves or leaf disks collected from 14‐d‐old plants grown under 419 parts per million (ppm) or 550 ppm CO2. Three independent replicates were conducted for each experiment. Data points represent average values across the three experimental replicates with SE bars. P‐values for ROS production and PR1 expression were computed using F‐tests for the main effect of CO2, and g sw and KTI1 expression using the interaction effect between CO2 and Psg, from the linear mixed effect model analysis based on log‐transformed data. The letter e denotes an exponent to the power of 10.
Fig. 5
Fig. 5
Identification of soybean differentially expressed genes (DEGs) responding to elevated CO2 (eCO2) (419 parts per million (ppm) vs 550 ppm) in either mock or Pseudomonas syringae pv. gylcinea (Psg)‐infected samples at 6 h post inoculation (hpi). Samples for 3′ mRNA‐Seq analysis were taken from the unifoliate leaves of 14‐d‐old plants at 6 hpi with mock treatment or Psg. The three independent biological replicates (Rep) were conducted using eight plants per CO2 treatment. Using a false discovery rate < 0.01, we identified 2419 differentially expressed genes (DEG) responding to eCO2 in Psg and/or mock‐treated samples. Row Z‐scores were used for hierarchical clustering of DEGs, based on expression across samples and replicates. Purple indicates expression values below the row mean for a given DEG and sample and teal indicates expression values above the row mean for a given DEG and sample. Rep indicates the independent biological replicate. The five major expression clusters of DEGs are indicated as 1 to 5, with Clusters 2 and 5 containing the most genes. Cluster 2 contains 986 genes that are primarily upregulated at 6 hpi with Psg but these genes are upregulated more in eCO2. Cluster 5 contains 828 genes that are downregulated at 6 hpi with Psg, but these genes are more downregulated in eCO2.
Fig. 6
Fig. 6
Significantly differentially expressed transcription factors (TF) and overrepresented TF binding sites (TFBS) are more robust in Pseudomonas syringae pv. glycinea (Psg)‐infected tissues responding to elevated CO2 (eCO2) than mock‐inoculated tissues. PlantRegMap/PlantTFDB v.5.0 (Tian et al., 2020) was used to identify significantly differentially expressed TFs and significantly overrepresented TFBS among the differentially expressed gene (DEG) clusters identified in Fig. 5 (Supporting Information Tables S9–S11). (a) Significant TFBS vs predicted number of DEG targets. Overrepresented TFBS and DEG targets are plotted for every cluster (cluster information not shown); therefore, if a TFBS was significant in multiple clusters, it was plotted multiple times but with different DEG targets. (b) Significantly overrepresented Gene Ontology (GO) terms (minimum of 10 DEGs per GO term) vs DEG number (Table S5). In both panels, DEG in teal were significant in Psg samples and/or DEG in purple were significant in mock‐treated samples. (c) Best Arabidopsis homologs of TFs and TFBS were input into STRING (Szklarczyk et al., 2023). TFs differentially expressed in response to eCO2 in Psg‐treated samples, mock‐treated samples or both are colored dark teal, dark purple or gray, respectively. TFBS are colored based on the origin of the target DEG.
Fig. 7
Fig. 7
Young soybean plants growing in elevated CO2 (eCO2) are more susceptible to bean pod mottle virus (BPMV) and soybean mosaic virus (SMV). (a) Representative photos of soybean growth in response to eCO2 during infection with BPMV or SMV compared with mock‐treated control plants. Plants were photographed at 21 d post‐inoculation (dpi). (b) BPMV and (c) SMV quantity at 14 dpi was assessed by reverse transcriptase‐quantitative polymerase chain reaction using Skp1 as a housekeeping gene. Disease progression of (d) BPMV and (e) SMV calculated as the area under the disease progress curve (AUDPC) over a 35‐d time course. Expression of (f) PR1 (SA marker gene) (g) KTI1 (JA marker gene), and RNA‐silencing‐related genes (h) AGO1 and (i) DCL2 in response to BPMV, SMV, or mock treatment was assessed by reverse transcription quantitative polymerase chain reaction analysis relative to the expression of Skp1. The newest fully expanded leaves of eight plants were sampled at the indicated time point for each treatment. The three experimental replicates were conducted simultaneously in independent CO2 controlled chambers using a replicated complete randomized design. Data were graphed as the mean across the three replicates with SE bars. P‐values were computed using F‐tests for the main effect of CO2 from the linear mixed effect model (LMM) analysis on the log‐transformed relative gene expression data. The following P‐values were associated with the log‐transformed relative PR1 expression of virus‐infected plants compared to mock‐treated plants at ambient CO2 condition: p(BPMVPR1,419) = 0.1282, p(SMVPR1,419) = 0.0178 and at eCO2 condition: p(BPMVPR1,550) = 0.7779, p(SMVPR1,550) = 0.3882. All was calculated based on t‐tests for the contrasts between each pathogen and mock at the corresponding CO2 conditions from the LMM analysis. The following P‐values were computed using t‐tests from the LMM analysis for the interaction effect between CO2 condition and pathogen treatment (virus or mock) on log‐transformed KTI1 gene expression: p(BPMVKTI1) = 0.6156 and p(SMVKTI1) = 0.3444. The letter e denotes an exponent to the power of 10.
Fig. 8
Fig. 8
Young soybean plants growing in elevated CO2 (eCO2) develop more sudden death syndrome (SDS) symptoms and are more susceptible to Fusarium virguliforme. (a) Representative photos of soybean plants at 35 d after planting (dap) that were mock‐treated or germinated in soil infested with F. virguliforme (Fusarium) and (b) associated root dry weight. (c) SDS disease progression, assessed as area under the disease progress curve (AUDPC), and (d) close‐up photographs of SDS disease symptoms on unifoliate leaves at 35 dap. (e) F. virguliforme titer was assessed by quantitative polymerase chain reaction and (f) expression of PR1 (SA marker gene) in soybean roots at 35 dap was assessed by reverse transcriptase‐quantitative polymerase chain reaction analysis relative to the Skp1 housekeeping gene. The three experimental replicates were conducted simultaneously in independent CO2 controlled chambers using a replicated complete randomized design. Data were graphed as the mean across the three replicates with SE bars. P‐values were computed using F‐tests for the main effect of CO2 on AUDPC and log‐transformed titers, and interaction effect between CO2 and Fusarium treatment on root dry weight and log‐transformed PR1 gene expression from the linear mixed effect model analysis. The letter e denotes an exponent to the power of 10.
Fig. 9
Fig. 9
Effects of elevated CO2 (eCO2) on Pythium sylvaticum infection in soybean. (a) Representative photos of soybean plants at 21 d after planting (dap) that were mock‐treated or germinated in soil infested with P. sylvaticum (Pythium) and (b) associated root dry weight. (c) P. sylvaticum disease index measured at 14 dap and (d) P. sylvaticum copy number in roots determined by quantitative polymerase chain reaction analysis at 14 dap. (e) KTI1 (JA marker gene) expression in response to mock treatment or P. sylvaticum infection assessed by reverse transcriptase‐quantitative polymerase chain reaction analysis. Gene expression was assessed relative to the Skp1 housekeeping gene. The three experimental replicates were conducted simultaneously in independent CO2‐controlled chambers using a replicated complete randomized design. Data were graphed as the mean across the three replicates with SE bars. P‐values were computed using F‐tests for the main effect of CO2 on area under disease progress curve and Pythium copy number, and interaction effect between CO2 and Pythium treatment on root dry weight and log‐transformed KTI1 expression from the linear mixed effect model analysis. The letter e denotes an exponent to the power of 10.

Similar articles

Cited by

References

    1. Aguilar E, Allende L, Del Toro FJ, Chung B‐N, Canto T, Tenllado F. 2015. Effects of elevated CO2 and temperature on pathogenicity determinants and virulence of potato virus X/potyvirus‐associated synergism. Molecular Plant–Microbe Interactions 28: 1364–1373. - PubMed
    1. Ahammed GJ, Li X. 2022. Elevated carbon dioxide‐induced regulation of ethylene in plants. Environmental and Experimental Botany 202: 105025.
    1. Ainsworth EA, Long SP. 2021. 30 years of free‐air carbon dioxide enrichment (FACE): what have we learned about future crop productivity and its potential for adaptation? Global Change Biology 27: 27–49. - PubMed
    1. Akbar S, Wei Y, Zhang M‐Q. 2022. RNA interference: promising approach to combat plant viruses. International Journal of Molecular Sciences 23: 5312. - PMC - PubMed
    1. Amari K, Huang C, Heinlein M. 2021. Potential impact of global warming on virus propagation in infected plants and agricultural productivity. Frontiers in Plant Science 12: 649768. - PMC - PubMed

MeSH terms

LinkOut - more resources