. 2025 Jan 9;16(1):541.
doi: 10.1038/s41467-024-55605-z.

CDK4 inactivation inhibits apoptosis via mitochondria-ER contact remodeling in triple-negative breast cancer

Affiliations

CDK4 inactivation inhibits apoptosis via mitochondria-ER contact remodeling in triple-negative breast cancer

Dorian V Ziegler et al. Nat Commun. .

Abstract

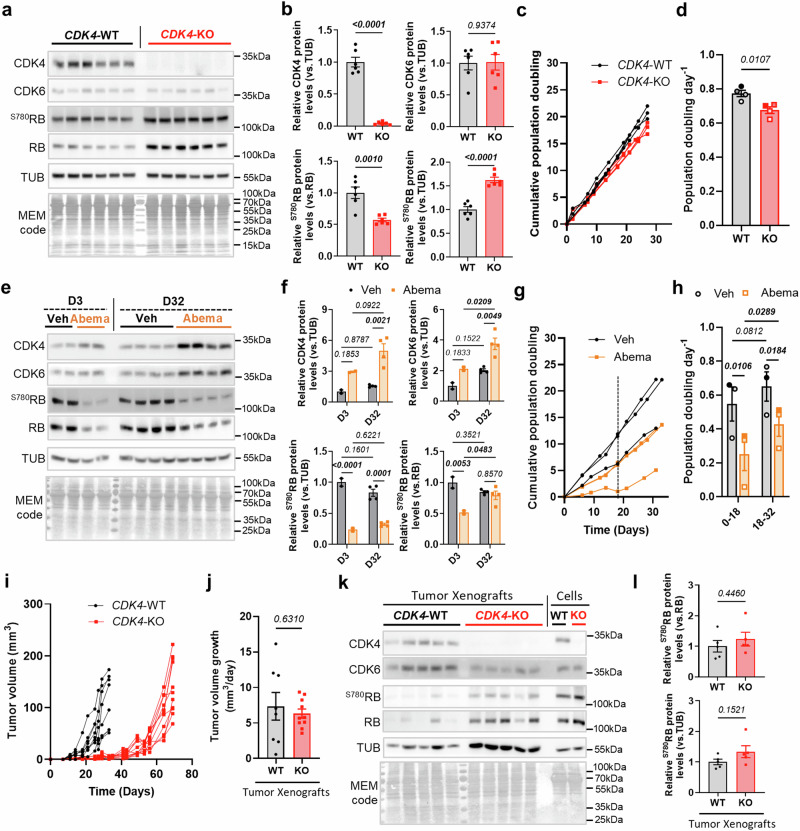
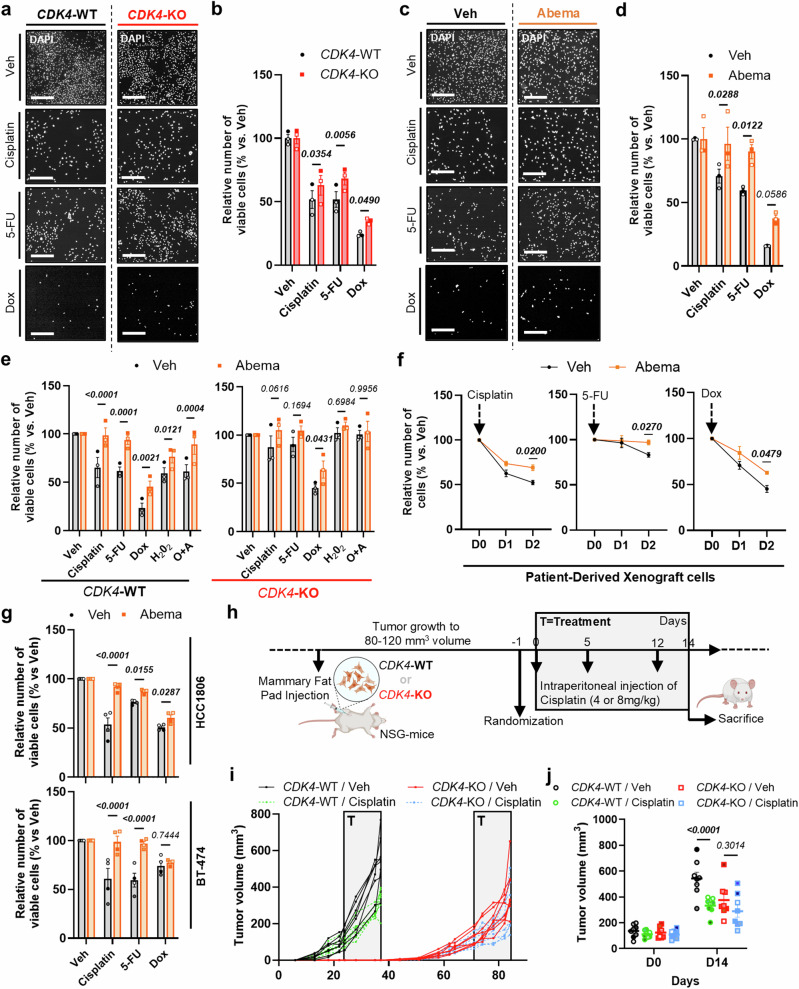
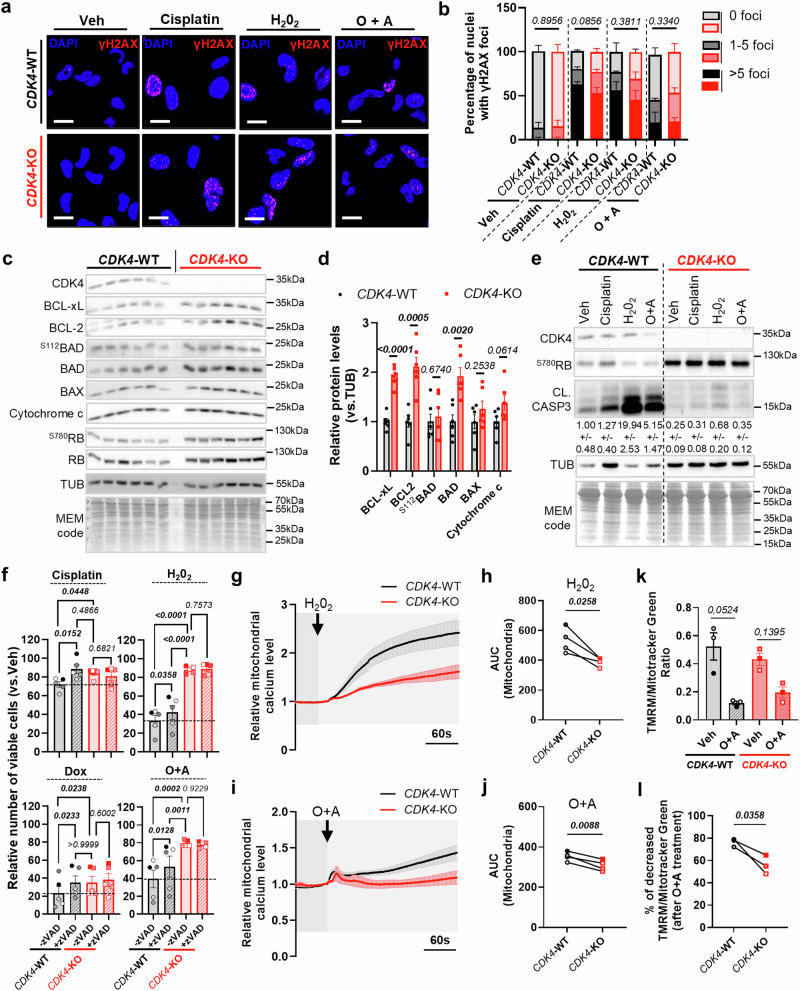
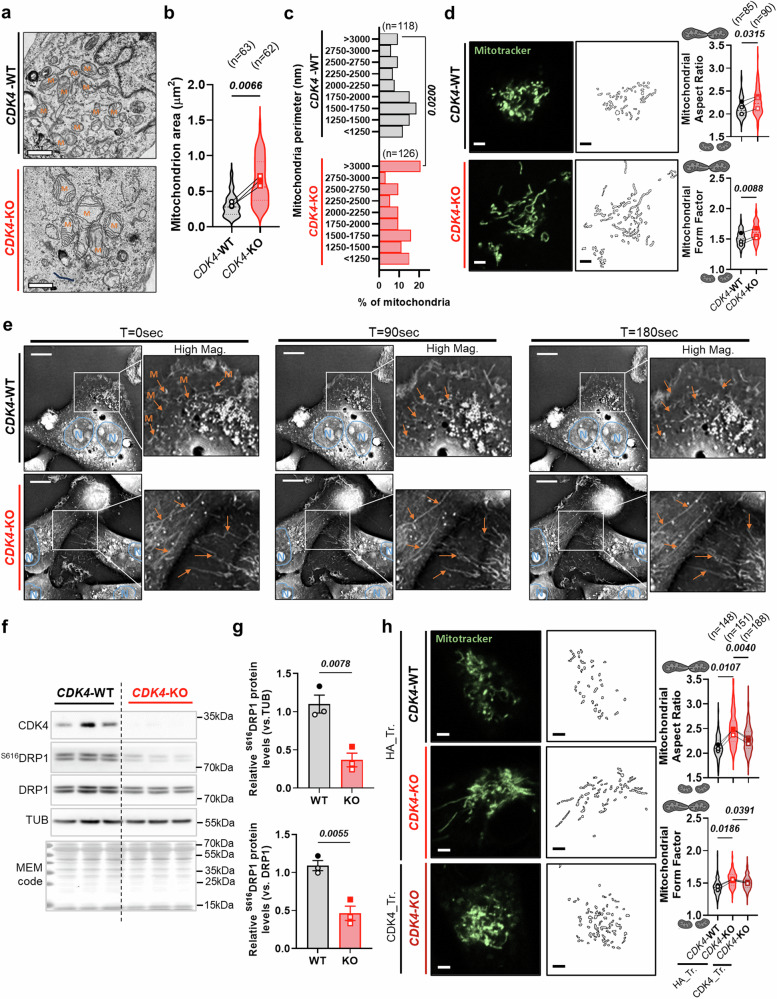
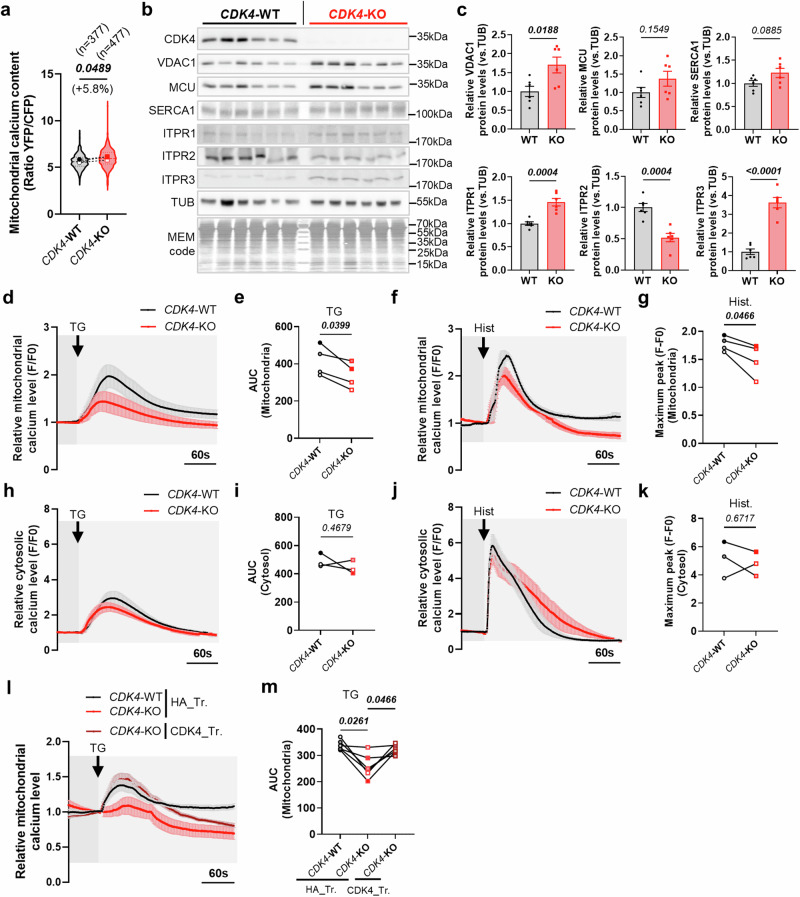
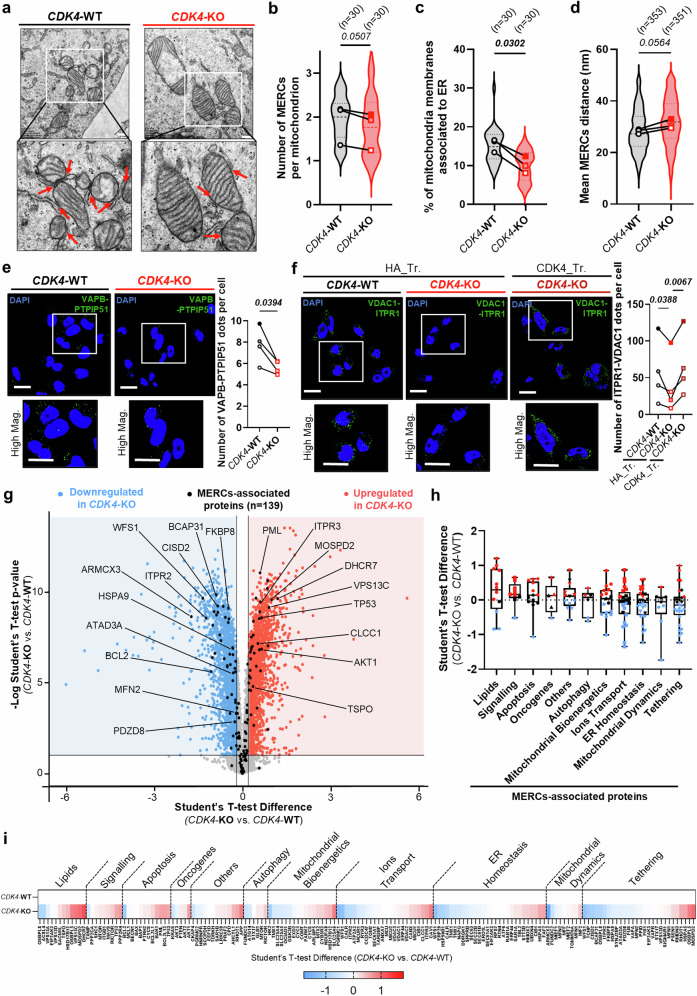
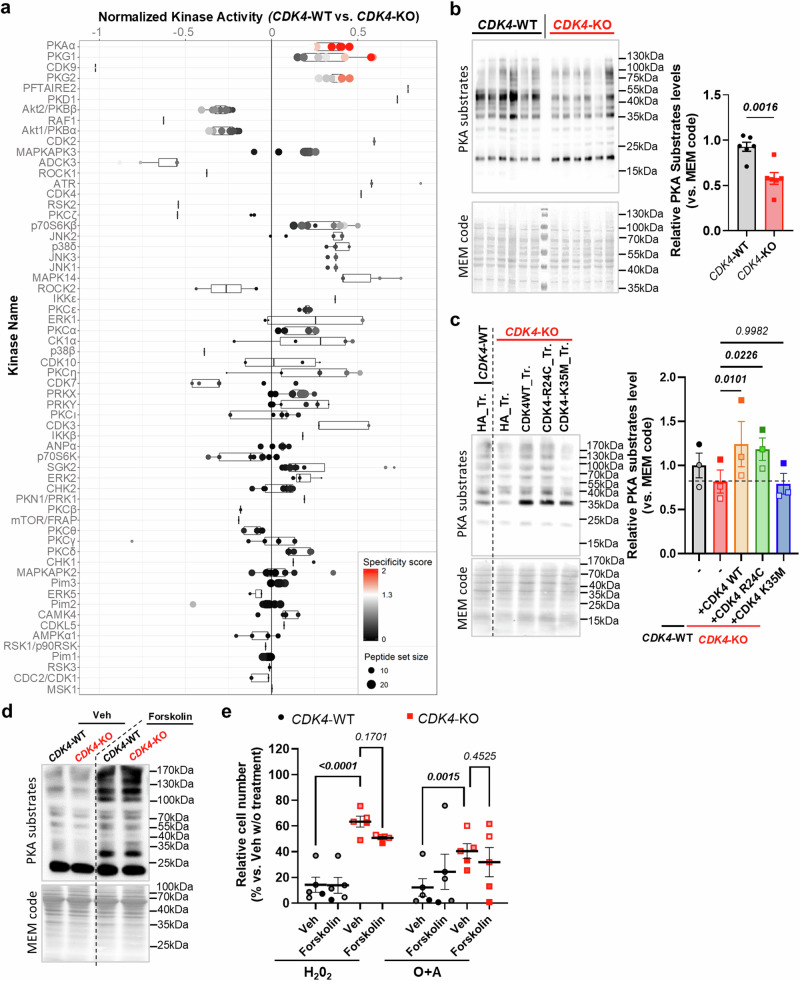
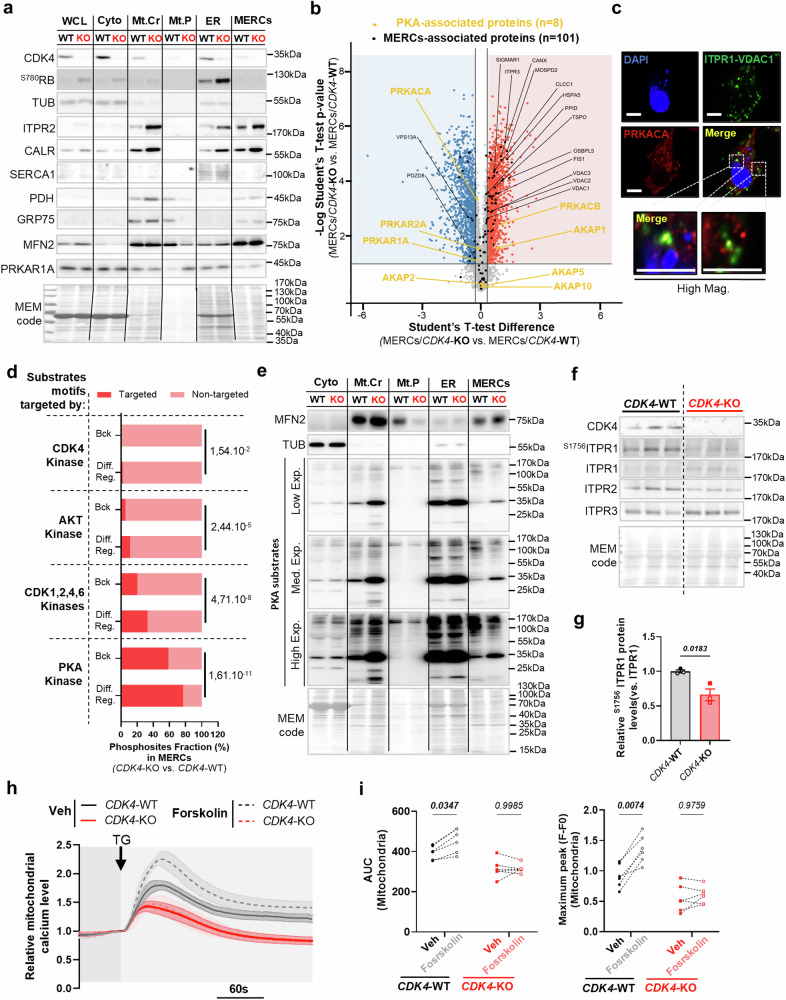
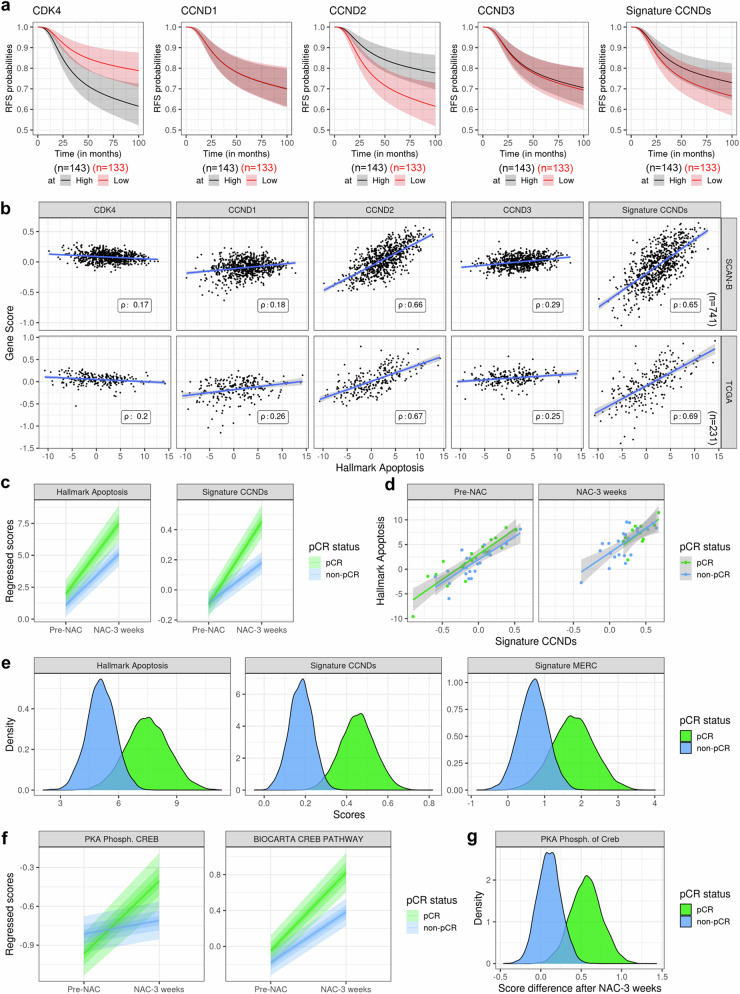
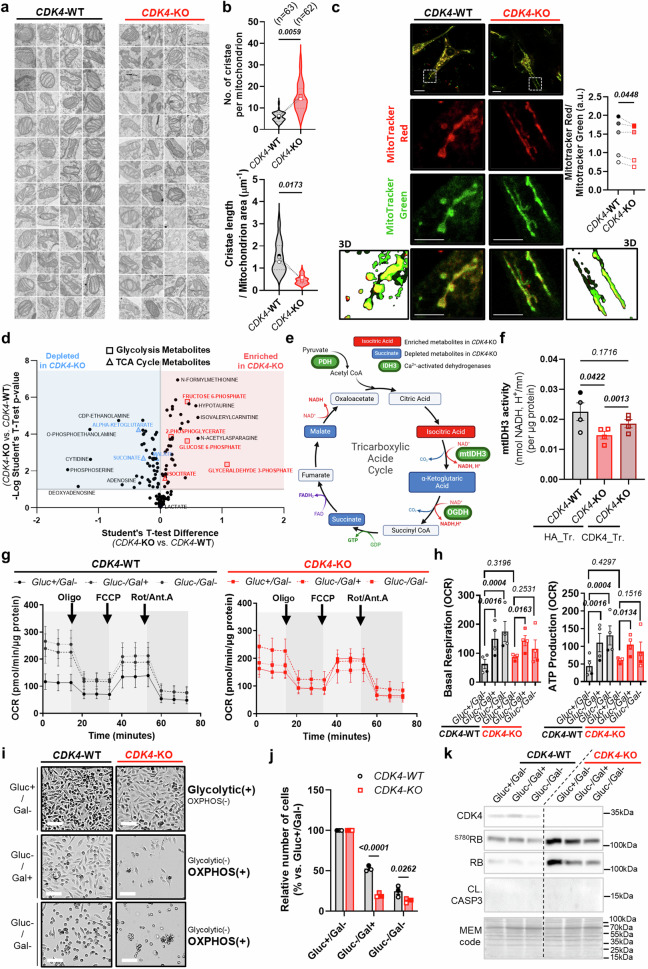
The energetic demands of proliferating cells during tumorigenesis require close coordination between the cell cycle and metabolism. While CDK4 is known for its role in cell proliferation, its metabolic function in cancer, particularly in triple-negative breast cancer (TNBC), remains unclear. Our study, using genetic and pharmacological approaches, reveals that CDK4 inactivation only modestly impacts TNBC cell proliferation and tumor formation. Notably, CDK4 depletion or long-term CDK4/6 inhibition confers resistance to apoptosis in TNBC cells. Mechanistically, CDK4 enhances mitochondria-endoplasmic reticulum contact (MERCs) formation, promoting mitochondrial fission and ER-mitochondrial calcium signaling, which are crucial for TNBC metabolic flexibility. Phosphoproteomic analysis identified CDK4's role in regulating PKA activity at MERCs. In this work, we highlight CDK4's role in mitochondrial apoptosis inhibition and suggest that targeting MERCs-associated metabolic shifts could enhance TNBC therapy.


Conflict of interest statement

Competing interests: The authors declare no competing interests.

Figures

Fig. 1
Fig. 1. CDK4 is dispensable for TNBC tumor growth in vitro and in vivo.
a, b Immunoblots and relative protein levels of CDK4, CDK6, S780RB, RB, Tubulin (TUB) and MEM code of CDK4-WT and -KO MDA-MB-231 TNBC cells. Mean +/- SEM of N = 6 independent biological replicates. Two-sided Unpaired T-tests. c, d Growth curves and proliferation rates of CDK4-WT and -KO TNBC cells. Mean +/- SEM of N = 4 independent biological replicates. Two-sided Unpaired T-test. e, f Immunoblots and relative protein levels of CDK4, CDK6, S780RB, RB, Tubulin (TUB) and MEM code of TNBC cells, upon treatment with Vehicle (Veh) or Abemaciclib (Abema) for 3 days (D3) or 32 days (D32). Mean +/- SEM of N = 2 (D3) and N = 4 (D32) independent biological replicates. 2-way ANOVA; Tukey’s multiple comparison tests. g, h Growth curves and proliferation rates of TNBC cells, upon treatment with Veh or Abema. Mean +/- SEM of N = 3 independent biological replicates. 2-way ANOVA; Tukey’s multiple comparison tests. i Tumor volume of CDK4-WT and -KO tumor xenografts. One curve represents one xenograft. N = 8 WT and N = 10 KO. j Tumor volume growth after tumors reached 20 mm3 of volume of CDK4-WT and -KO xenografts. Mean +/- SEM of N = 8 WT and N = 10 KO. Two-sided Welch’s T-test. k, l Immunoblots and relative protein levels of CDK4, CDK6, S780RB, RB, Tubulin (TUB) and MEM code of CDK4-WT and -KO tumor xenografts, and CDK4-WT and -KO TNBC cells. Mean +/- SEM of N = 5 WT and KO tumors. Two-sided Unpaired T-tests. Exact p-values are displayed in italic (bold italic if <0.05).
Fig. 2
Fig. 2. CDK4 inhibition confers to TNBC cells resistance to chemotherapy in vitro and in vivo.
a, b Representative pictures of DAPI staining and quantification of the number of viable CDK4-WT and -KO MDA-MB-231 TNBC cells, upon treatment with Vehicle, Cisplatin (10 μM), 5-FU (20 μM), or Doxorubicin (5 μM) (Dox). Scale bars: 400 μm. Mean +/- SEM of N = 3 independent biological replicates. 2-way ANOVA; Sidák’s multiple comparison tests. c, d Representative pictures of DAPI staining and quantification of the number of viable pretreated cells with Vehicle or Abemaciclib (Abema) for 2 days and after treatment with Vehicle, Cisplatin (10 μM), 5-FU (20 μM), or Dox (5 μM). Scale bars: 400 μm. Mean +/- SEM of N = 3 independent biological replicates. 2-way ANOVA; Sidák’s multiple comparison tests. e Number of viable CDK4-WT and -KO TNBC cells, pretreated with Vehicle or Abema for 2 days and after 2 days of treatment with Vehicle, Cisplatin (10 μM), 5-FU (20 μM), Dox (5 μM), H202 (250μM-2hours) or Oligomycin and Antimycin (O + A) (1 + 10μM-2hours). Mean +/- SEM of N = 3 independent biological replicates. 2-way ANOVA; Sidák’s multiple comparison tests. f Relative number of triple-negative NST breast cancer patient-derived cells pretreated cells with Vehicle or Abema for 2 days. Cisplatin (12 μM), 5-FU (40 μM) or Dox (10 μM) treatments were performed at D0. Mean +/- SEM of N = 4 independent biological replicates. 2-way ANOVA; Sidák’s multiple comparison tests. g Number of viable HCC1806 and BT-474 TNBC cells, pretreated with Vehicle or Abema for 2 days and after treatment with Vehicle, Cisplatin (20 μM), 5-FU (40 μM), or Dox (5 μM). Mean +/- SEM of N = 4 independent biological replicates. 2-way ANOVA; Sidák’s multiple comparison tests. h CDK4-WT and -KO MDA-MB-231 TNBC cells were injected in fat pad of the mammary gland of female NSG mice. Randomization was performed when tumor volume reached 80-120mm3 and Cisplatin IP (4-8 m/kg) was performed at D0, D5 and D12, before sacrifice at D14. i Tumor volume of CDK4-WT and -KO tumor xenografts, treated with vehicle (Veh) or Cisplatin (4 mg/kg). T=Treatment. N = 8 mice per group. j Tumor volume of CDK4-WT and -KO tumor xenografts at the end of the sacrifice. 2-way ANOVA; Sidák’s multiple comparison tests. Mean +/- SEM of N = 8 mice. Exact p-values are displayed in italic (bold italic if <0.05).
Fig. 3
Fig. 3. CDK4 regulates cell death modulating mitochondrial effectors of apoptosis in TNBC.
a Representative pictures of DAPI (blue) and γH2AX (red) staining in CDK4-WT and -KO MDA-MB−231 TNBC cells 24 hours after treatment with Vehicle, Cisplatin (10 μM), H202 (250μM-2hours), or Oligomycin and Antimycin (O + A) (1 + 10μM-2hours). Scale bars: 10 μm. b Relative proportions of nuclei displaying 0, 1-5 or more than 5 γH2AX foci. Mean +/- SEM of N = 3 independent biological replicates. Two-sided Freeman-Halton extension of Fisher’s exact test. c, d Immunoblots and relative protein levels of CDK4, BCL-XL, BCL-2, S112BAD, BAD, BAX, Cytochrome C, S780RB, RB, Tubulin (TUB) and MEM code of CDK4-WT and -KO TNBC cells. Multiple two-sided Unpaired T-tests. e Immunoblots of CDK4, S780RB, Cleaved Caspase-3 (CL.CASP3), Tubulin (TUB) and MEM code of CDK4-WT and -KO TNBC cells, upon treatment with Vehicle, Cisplatin, H202 or O + A. Quantification of relative cleaved Caspase-3 protein levels (normalized to tubulin level). Mean +/- SEM of N = 3 independent biological replicates. f Number of viable CDK4-WT and -KO TNBC cells pretreated during 3 hours with or without zVAD (20 μM) and then exposed to Cisplatin, Doxorubicin, H202, or O + A. Mean +/- SEM of N = 5 independent biological replicates. 2-way ANOVA; Tukey’s multiple comparison tests. g-j Relative mitochondrial calcium levels of CDK4-WT and -KO TNBC cells upon H202 (2.5 mM) or O + A (100 μM, 10 μM) injections. Curves based on Rhod-2AM probe fluorescence intensity. Arrows indicate the time of injection. Associated quantification of the area under the curves (AUC). Mean +/- SEM of N = 4 independent biological replicates representing a total of n = 135 cells for 10 independent injections (WT-H202), n = 123 cells for 9 independent injections (KO-H202), n = 128 cells for 9 independent injections (WT-O + A) and n = 128 cells for 9 independent injections (KO-O + A). Two-sided Paired-T-tests. k Quantification of the ratio between TMRM and Mitotracker Green fluorescence intensities in CDK4-WT and -KO TNBC cells 2 hours after vehicle (Veh) or O + A (1 + 10 μM) treatments. Mean +/- SEM of N = 3 independent biological replicates. 2-way ANOVA; Tukey’s multiple comparison tests. l Percentage of decreased of TMRM/Mitotracker Green ratio after O + A treatment in CDK4-WT and -KO TNBC cells. N = 3 independent biological replicates. Two-sided Paired-T-test. Exact p-values are displayed in italic (bold italic if <0.05).
Fig. 4
Fig. 4. CDK4 participates in mitochondrial fission of TNBC.
a Representative electron micrographs of CDK4-WT and -KO MDA-MB-231 TNBC cells. Scale bars: 1 μm. M=Mitochondria. b Quantification of mitochondria area of CDK4-WT and -KO TNBC cells. Means of N = 3 independent biological replicates from n=mitochondria represented with violon plot. Two-sided Paired T-test. c Distribution histogram of mitochondria perimeter of CDK4-WT and -KO TNBC cells. n=mitochondria number representative from N = 3 independent biological replicates. Two-sided Fisher’s exact test. d Representative pictures of mitochondria staining using Mitotracker of CDK4-WT and -KO TNBC cells. Scale bars: 4 μm. Associated quantification of mitochondrial aspect ratio (major axis/minor axis) and form factor (1/circularity) in CDK4-WT and -KO TNBC cells. Means of N = 3 independent biological replicates from n=cells represented with violin plot. e Time-live tracking of mitochondria of CDK4-WT and -KO TNBC cells at T = 0 sec, T = 90 sec and T = 180 sec. N delineation indicates nuclei (Blue) and M arrows indicate mitochondria (Orange). Scale bars: 4 μm. Representative of N = 3 independent biological replicates. f, g Immunoblots and relative protein levels of CDK4, S616DRP1, DRP1, Tubulin (TUB) and MEM code of CDK4-WT and -KO TNBC cells. Mean +/- SEM of N = 3 independent biological replicates. Two-sided Unpaired T-tests. h Representative pictures of mitochondria staining using Mitotracker Green of CDK4-WT, CDK4-KO TNBC cells transfected with empty plasmid HA (HA_Tr.) and CDK4-KO TNBC cells expressing endogenous CDK4 (CDK4_Tr.). Scale bars: 4 μm. Associated quantification of mitochondrial aspect ratio and form factor. Means of N = 3 independent biological replicates from n = cells represented with violin plot. RM 1 way ANOVA; Tukey’s multiple comparisons test. Exact p-values are displayed in italic (bold italic if <0.05).
Fig. 5
Fig. 5. CDK4 regulates ER-mitochondrial calcium signaling.
a Basal mitochondrial calcium content of CDK4-WT and -KO MDA-MB-231 TNBC cells. Medians of N = 3 independent biological replicates from n = 377 (CDK4-WT) and n = 477 (CDK4-KO) cells represented with violin plot. Two-sided Paired t-test. b, c Immunoblots and relative protein levels of CDK4, SERCA1, ITPR1, ITPR2, ITPR3, VDAC1, MCU, Tubulin (TUB) and MEM code of CDK4-WT and -KO TNBC cells. Parallel gels were loaded for TUB, with subsequent same antibodies/exposure conditions. Mean +/- SEM of N = 6 independent biological replicates. Two-sided Unpaired T-tests. dg Relative mitochondrial calcium levels of CDK4-WT and CDK4-KO TNBC cells upon Thapsigargin (TG) (2 μM) or Histamine (Hist) (50 μM) injections. Curves based on Rhod-2AM fluorescence intensity. Arrows indicate the time of injection. Associated quantification of the area under the curves (AUC) or maximum amplitude/peak. Mean +/- SEM of N = 4 independent biological replicates from n = 148 cells for 13 independent injections (WT-TG), n = 142 cells for 13 independent injections (KO-TG), n = 133 cells for 10 independent injections (WT-Hist.) and n = 141 cells for 12 independent injections (KO-Hist.). Two-sided Paired T-tests. hk Relative cytosolic calcium levels of CDK4-WT and CDK4-KO TNBC cells upon Thapsigargin (TG) (2 μM) or Histamine (Hist) (50 μM) injections. Curves based on Fluo-4 fluorescence intensity. Arrows indicate the time of injection. Associated quantification of the area under the curves (AUC) or maximum amplitude/peak. Mean +/- SEM of N = 3 independent biological replicates from n = 107 cells for 9 independent injections (WT-TG), n = 123 cells for 9 independent injections (KO-TG), n = 121 cells for 9 independent injections (WT-Hist.) and n = 118 cells for 9 independent injections (KO-Hist.). Two-sided Paired T-tests. l, m Relative mitochondrial calcium levels of CDK4-WT, CDK4-KO TNBC cells transfected with empty plasmid HA (HA_Tr.) and CDK4-KO TNBC cells expressing endogenous CDK4 (CDK4_Tr.) upon Thapsigargin (TG) (2 μM) injection. Arrows indicate the time of injection. Associated quantification of the area under the curves (AUC). Mean +/- SEM of N = 6 independent injections from 2 biological replicates and n = 75 cells (WT/HA_Tr.), n = 55 cells (KO/HA_Tr.) and n = 75 cells (KO/CDK4_Tr.). RM 1 way ANOVA; Tukey’s multiple comparisons test. Exact p-values are displayed in italic (bold italic if <0.05).
Fig. 6
Fig. 6. CDK4 enhances Mitochondria-ER Contacts in TNBC.
a Representative electron micrographs of CDK4-WT and CDK4-KO MDA-MB-231 TNBC cells. Scale bars: 500 nm. Red arrows indicate Mitochondria-ER Contacts (MERCs). b Quantification of the number of MERCs per mitochondrion of CDK4-WT and -KO TNBC cells. Medians of N = 3 independent biological replicates from n=cells, represented as violin plot. Two-sided Paired T-test. c Percentage of mitochondrial membranes associated to ER. Means of N = 3 independent biological replicates from n=cells, represented as violin plot. Two-sided Paired T-test. d Mean ER-mitochondrion distance in analyzed MERCs. Means of N = 3 independent biological replicates representing n = 353 MERCs from 55 cells (WT) and n = 351 MERCs from 49 cells (KO), represented as violin plot. Two-sided Mann-Whitney test. e Proximity Ligation Assay (PLA) using VAPB and PTPIP51 antibodies in CDK4-WT and -KO TNBC cells. Representative pictures and associated quantification of VAPB-PTPIP51 dots per cell. Scale bar: 10 μm. N = 4 independent biological replicates. Two-sided Paired T-test. f Proximity Ligation Assay (PLA) using VDAC1 and ITPR1 antibodies in CDK4-WT, CDK4-KO TNBC cells transfected with empty plasmid HA (HA_Tr.) and CDK4-KO TNBC cells expressing endogenous CDK4 (CDK4_Tr.). Representative pictures and associated quantification of ITPR1-VDAC1 dots per cell. Scale bar: 10 μm. N = 4 independent biological replicates. RM 1 way ANOVA; Tukey’s multiple comparisons test. g Volcano plots of proteins differentially regulated in CDK4-WT and -KO TNBC cells, highlighting proteins significantly down-regulated (blue) and up-regulated (red) in CDK4-KO compared to CDK4-WT TNBC cells. N = 5 biological replicates. In black are indicated 139 MERCs-associated proteins found in the proteomic analysis. h Box plots of the subclustered classes of the 139 MERCs-associated proteins, from the top up-regulated to the top down-regulated according to the median of Student’s T-test difference. Box spans from the first to the third quartile, marking the median with a distinct line. The whiskers reach out to the extreme maximum and minimum data point. i Heatmap of the 139 MERCs-associated proteins according to the median of Student’s T-test difference. Exact p-values are displayed in italic (bold italic if <0.05).
Fig. 7
Fig. 7. PKA activity is regulated by CDK4 but is not sufficient to mediate apoptosis.
a Boxplot of kinome profiling/PAMgene analysis CDK4-WT and CDK4-KO TNBC cells. Comparison CDK4-KO vs. CDK4-WT TNBC cells. N = 4 independent biological replicates. Box spans from the first to the third quartile, marking the median with a distinct line. The whiskers reach out to the extreme maximum and minimum data point. b Immunoblots of Phospho-PKA substrates and MEM code in CDK4-WT and -KO TNBC cells. Relative quantity of Phospho-PKA substrates normalized to MEM code. Mean +/- SEM of N = 6 independent biological replicates. Two-sided Unpaired T-test. c Immunoblots of Phospho-PKA substrates and MEM code of CDK4-WT and -KO TNBC cells. Relative quantity of Phospho-PKA substrates relative to MEM code. Mean +/- SEM of N = 3 independent biological replicates. d Immunoblots of Phospho-PKA substrates and MEM code of CDK4-WT and -KO TNBC cells treated for 24 hours pretreatment with Forskolin (20 μM). e Relative cell number compared to control (no treatments) in CDK4-WT and -KO TNBC cells, upon 24 hours pretreatment and 3 consecutive days of Forskolin (20 μM). Cell death was induced in parallel with H202 (250μM-2hours) or Oligomycin and Antimycin (O + A) (1 + 10μM-2hours). Mean +/- SEM of N = 5 independent biological replicates. 2-way ANOVA; Tukey’s multiple comparison tests. Exact p-values are displayed in italic (bold italic if <0.05).
Fig. 8
Fig. 8. MERCs-PKA activity is regulated by CDK4 and drives ER-MT calcium signaling.
a Immunoblots of CDK4, S780RB, Tubulin (TUB), ITPR2, CALR, SERCA1, PDH, GRP75, MFN2, PRKAR1A and MEM code in subcellular fractions of CDK4-WT and CDK4-KO TNBC cells. WCL=Whole cell lysate. Cyto=Cytosolic fraction. Mt.Cr=Crude mitochondria fractions. Mt.P=Pure mitochondria fractions. ER=Endoplasmic reticulum fraction. MERCs=Mitochondria-ER contacts fractions. Representative of N = 3 biological replicates. b Volcano plot of proteomics data from the MERCs fraction of CDK4-WT and -KO TNBC cells. MERCs- and PKA-associated proteins are represented respectively in dark and orange. c Immunofluorescence of MDA-MB-231 TNBC cells stained with DAPI (blue), PRKACA (red), ITPR1-VDAC1 puncta (green). Scale bars: 10 μm. Representative of N = 3 biological replicates. d Enrichment analysis on phospho-peptides found in MERCs fraction of CDK4-WT and -KO TNBC cells. Phosphosites displaying CDK4 kinase motifs, AKT kinase motifs, CDK1,2,4,6-kinase motifs or PKA kinase motifs are represented. Bck=Background represents the total number of phosphosites found in the phosphoproteomics while Diff.Ref.=Differentially regulated represents the number of phosphosites found significantly down- or up-regulated in MERC fraction of CDK4-KO TNBC cells. N = 3 independent biological replicates. Benj. Hoch. FDR value is displaying for each substrate motif category. e Immunoblots of MFN2, Tubulin (TUB), Phospho-PKA substrates and MEM code of CDK4-WT and -KO TNBC cells on different subcellular fractions: whole cell lysate, cytosolic, crude mitochondria, pure mitochondria, ER and mitochondria-ER contacts. Representative of N = 3 biological replicates. f, g Immunoblots and relative protein levels of CDK4, S1756ITPR1, ITPR1, ITPR2, ITPR3 and MEM code of CDK4-WT and -KO TNBC cells. Mean +/- SEM of N = 3 independent biological replicates. Two-sided Unpaired T-test. h, i Relative mitochondrial calcium levels of CDK4-WT and -KO TNBC cells pretreated with or without Forskolin (20 μM) upon Thapsigargin (TG) (2 μM) injection. Arrow indicates the time of injection. Associated quantification of the area under the curves (AUC) and maximum amplitude/peak. Mean +/- SEM of N = 6 independent injections accounting 3 biological replicates representing a total of n = 89 cells (Veh/CDK4-WT), n = 88 cells (Veh/CDK4-KO), n = 82 cells (Forskolin/CDK4-WT) and n = 86 cells (Forskolin/CDK4-KO). RM 1 way ANOVA; Tukey’s multiple comparisons test. Exact p-values are displayed in italic (bold italic if <0.05).
Fig. 9
Fig. 9. CDK4 activity is positively correlated with apoptosis signature and better response to neoadjuvant chemotherapy (NAC) in TNBC patients.
a Dichotomized standardized survival curves showing recurrence-free survival (RFS) probabilities in two subsets of patients according to their gene score expression based on median of CDK4, CCND1, CCND2, CCND3 and signature of CCNDs. 95% confidence intervals are displayed. SCAN-B TNBC patients treated with chemotherapy only. n = 143 (High) and n = 133 (Low) patients. b Correlation of gene score enrichment between Hallmark Apoptosis and CDK4, CCND1, CCND2, CCND3 or a signature of CCNDs expression for SCAN-B and TCGA datasets,. Rho values correspond to the Spearman’s rank correlation between both signatures in each dataset. n = 741 (SCAN-B) and n = 231 (TCGA) patients. c Regressed scores of Hallmark Apoptosis and signature of CCNDs in TNBC patients preceding (pre-NAC) or three weeks after neoadjuvant chemotherapy (NAC-3 weeks) and according to their pathological complete response (pCR) status. n = 26 (pCR) and n = 18 (non-pCR) patients pre-NAC. n = 24 (pCR) and n = 11 (non-pCR) patients NAC-3 weeks. 95% credible intervals are displayed. d Correlation between hallmark apoptosis and the CCNDs signature in TNBC patients preceding (pre-NAC) or three weeks after neoadjuvant chemotherapy (NAC-3 weeks) and according to their pathological complete response (pCR) status. n = 26 (pCR) and n = 18 (non-pCR) patients pre-NAC. n = 24 (pCR) and n = 11 (non-pCR) patients NAC-3 weeks. 95% credible intervals are displayed. e Density differences in Hallmark Apoptosis, signature CCNDs and signature Mitochondria-ER contact (MERC) three weeks after neoadjuvant chemotherapy (NAC-3 weeks), stratified by pCR status. n = 24 (pCR) and n = 11 (non-pCR) patients. f Regressed scores of PKA Phosph. CREB and BIOCARTA CREB PATHWAY in TNBC patients preceding (pre-NAC) or three weeks after neoadjuvant chemotherapy (NAC-3 weeks) and according to their pathological complete response (pCR) status. n = 26 (pCR) and n = 18 (non-pCR) patients pre-NAC. n = 24 (pCR) and n = 11 (non-pCR) patients NAC-3 weeks. 95% credible intervals are displayed. g Density scores differences of PKA Phosph. CREB three weeks after neoadjuvant chemotherapy (NAC-3 weeks). n = 24 (pCR) and n = 11 (non-pCR) patients.
Fig. 10
Fig. 10. CDK4 promotes mitochondrial fitness and metabolic flexibility through balanced calcium signaling.
a Representative electron micrographs of mitochondria cristae from CDK4-WT and -KO TNBC cells. N = 3 independent biological replicates. b Quantification of the number of cristae per mitochondria and cristae length/mitochondria area from CDK4-WT and -KO TNBC cells. Means of N = 3 independent biological replicates from a total of n mitochondria, represented with violin plot. Two-sided Paired T-tests. c Representative micrographs of CDK4-WT and -KO TNBC cells stained with MitoTracker Red and Green. Scale bars: 10 μm. Quantification of MitoTracker Red/Green fluorescence intensities in CDK4-WT and -KO TNBC cells. N = 5 independent biological replicates representing a total of n = 145 cells (CDK4-WT) or 157 cells (CDK4-KO). Two-sided Paired T-tests. d Metabolomics analysis from multi-pathway analysis from CDK4-WT and -KO TNBC cells. N = 5 biological replicates. e TCA cycle scheme with annotated metabolites. Depleted and enriched (blue and red) TCA metabolites in CDK4-KO cells (p-value < 0.05), and calcium-dependent enzymes (green), are displayed. N = 5 biological replicates. Multiple Student’s t-test. f Mitochondrial isocitrate-dehydrogenase 3 (mtIDH3) activity normalized by protein quantity and measured in CDK4-WT, CDK4-KO TNBC cells transfected with empty plasmid HA (HA_Tr.) and CDK4-KO TNBC cells expressing endogenous CDK4 (CDK4_Tr.). Mean +/-SEM of N = 4 biological replicates. RM 1 way ANOVA; Tukey’s multiple comparisons test. g Seahorse curves of oxygen consumption rates (OCR) from CDK4-WT and -KO TNBC cells, in media containing Glucose (10 mM)/No galactose (Gluc + /Gal-), No glucose/Galactose (10 mM) (Gluc-/Gal + ), or No glucose/No galactose (Gluc-/Gal-). Mean +/-SEM of N = 4 independent biological replicates. h Seahorse quantitative analysis of oxygen consumption rate (OCR). Basal OCR (resting conditions) and ATP-linked production OCR (upon Oligomycin treatment). Mean +/-SEM of N = 4 independent biological replicates. 2-way ANOVA; Tukey’s multiple comparison tests. i, j Representative pictures and relative number of CDK4-WT and -KO TNBC cells 72 h after continuous with Gluc + /Gal, Gluc-/Gal + , Gluc-/Gal- media. Scale bars: 10 μm. 2-way ANOVA; Sidák’s multiple comparison tests. Mean +/-SEM of N = 3 independent biological replicates. k Immunoblots of CDK4, S780RB, RB, Cleaved Caspase 3 (CL.CASP 3), and MEM code of CDK4-WT and -KO TNBC cells cultured for 48 h with Gluc+ /Gal, Gluc-/Gal + , Gluc-/Gal- media. Representative of N = 2 biological replicates. Exact p-values are displayed in italic (bold italic if <0.05).

References

    1. Malumbres, M. et al. Cyclin-dependent kinases: a family portrait. Nat. Cell Biol.11, 1275–1276 (2009). - PMC - PubMed
    1. Aguilar, V. & Fajas, L. Cycling through metabolism. EMBO Mol. Med2, 338–348 (2010). - PMC - PubMed
    1. Fassl, A., Geng, Y. & Sicinski, P. CDK4 and CDK6 kinases: From basic science to cancer therapy. Science375, eabc1495 (2022). - PMC - PubMed
    1. Goel, S., Bergholz, J. S. & Zhao, J. J. Targeting CDK4 and CDK6 in cancer. Nat. Rev. Cancer22, 356–372 (2022). - PMC - PubMed
    1. Hu, Y., Gao, J., Wang, M. & Li, M. Potential prospect of CDK4/6 inhibitors in triple-negative breast cancer. Cancer Manag Res13, 5223–5237 (2021). - PMC - PubMed

MeSH terms

Substances