. 2025 Jan 9;16(1):432.
doi: 10.1038/s41467-024-55193-y.

Influenza A Virus H7 nanobody recognizes a conserved immunodominant epitope on hemagglutinin head and confers heterosubtypic protection

Affiliations

Influenza A Virus H7 nanobody recognizes a conserved immunodominant epitope on hemagglutinin head and confers heterosubtypic protection

Zhao-Shan Chen et al. Nat Commun. .

Abstract

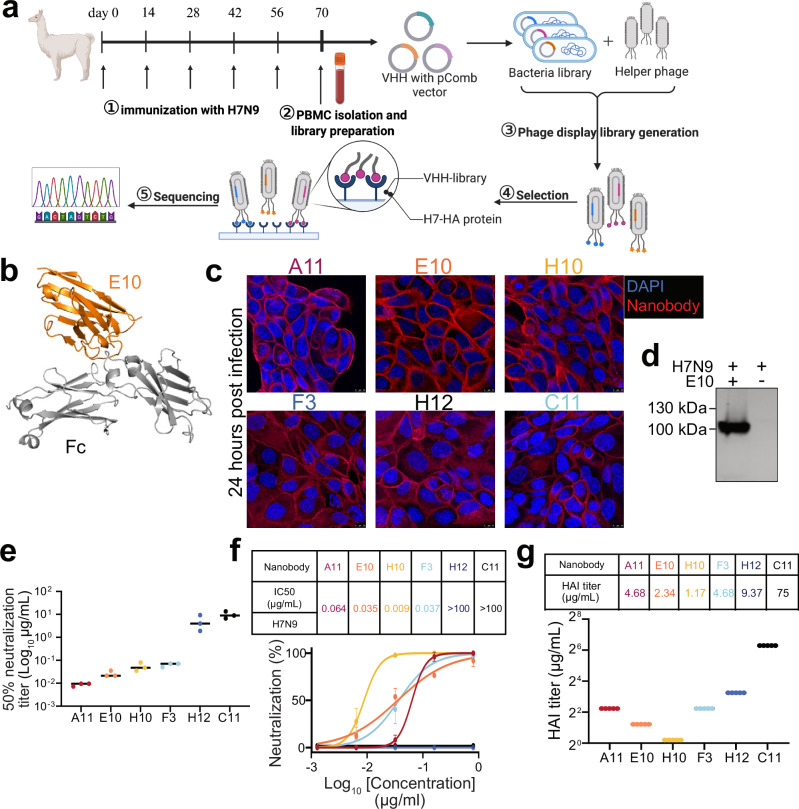
Influenza remains a persistent global health challenge, largely due to the virus' continuous antigenic drift and occasional shift, which impede the development of a universal vaccine. To address this, the identification of broadly neutralizing antibodies and their epitopes is crucial. Nanobodies, with their unique characteristics and binding capacity, offer a promising avenue to identify such epitopes. Here, we isolate and purify a hemagglutinin (HA)-specific nanobody that recognizes an H7 subtype of influenza A virus. The nanobody, named E10, exhibits broad-spectrum binding, cross-group neutralization and in vivo protection across various influenza A subtypes. Through phage display and in vitro characterization, we demonstrate that E10 specifically targets an epitope on HA head which is part of the conserved lateral patch and is highly immunodominant upon H7 infection. Importantly, immunization with a peptide including the E10 epitope elicits cross-reactive antibodies and mediates partial protection from lethal viral challenge. Our data highlights the potential of E10 and its associated epitope as a candidate for future influenza prevention strategies.


Conflict of interest statement

Competing interests: The authors declare no competing interests.

Figures

Fig. 1
Fig. 1. Generation and characterization of H7-specific nanobodies.
a Schematic illustration of alpaca immunization process and subsequent nanobody selection. Alpacas were immunized with the H7N9 virus, and after four boosts, peripheral blood mononuclear cells (PBMCs) were collected to generate a phage display library. Created with BioRender.com. b Structural model of a nanobody-Fc created using ImmuneBuilder and AlphaFold 2. (Nanobody: orange. Fc tags: gray). c Immunofluorescence assay (IFA) showing the recognition of SZ19 H7N9 virus by different nanobodies. A549 cells were infected with SZ19 (MOI = 0.1) for 24 h and stained with primary nanobodies, followed by secondary goat anti-human IgG Fc Alexa Fluor™ 488 (A11: red, E10: orange, H10: yellow, F3: blue, H12: dark blue, C11: black.). Scale bar, 10 μm. d Western blot (WB) analysis of A549 cells infected with SZ19 H7N9 (MOI = 1) for 24 h. Cell lysate was probed with respective nanobodies and detected using goat anti-human IgG-Fc HRP. Data are representative of at least two independent experiments. e Graph showing 50% neutralization endpoint (NC50) of different nanobodies against the SZ19 H7N9 virus. Virus was incubated with serially diluted nanobodies before cell infection. After 72 h, viral replication was measured by the ability of supernatant to hemagglutinate red blood cells (RBCs). Data are representative of at least two independent experiments. Shown are the mean values of three replicates. f Neutralization assay results for the nanobodies on SZ19 H7N9 virus using a cell-based ELISA. Half-maximal inhibitory concentrations (IC50) are shown for each nanobody. Data represent the mean values ± SD from four technical replicates of three independent experiments. g Hemagglutination inhibition assay (HAI) with the nanobodies against SZ19 H7N9 virus (A11: red, E10: orange, H10: yellow, F3: blue, H12: dark blue, C11: black.). HI titer shown as µg/mL. Data are the average of three independent experiments.
Fig. 2
Fig. 2. Nanobody E10 exhibits cross-group binding breadth and neutralization capacity.
af ELISA binding curves showing the interaction of six nanobodies with HA protein from various influenza strains (H7, H1, and H3) and UV-inactivated influenza viruses (H7N1, H1N1, and H3N2). Each curve represents a different nanobody, color-coded for clarity. Data are presented as mean ± SD. Experiment was performed three times. g Neutralization efficacy of nanobody E10 against different subtypes of influenza A virus (H1N1 and H3N2). Neutralization of SZ19 H7N9 from Fig. 1e is shown for comparison. Data are representative of at least two independent experiments. Shown are the mean values of three technical replicates. hk Evaluation of E10’s effect on different stages of the viral infection process using SZ19 H7N9 virus (MOI = 10) at various time points. Bars represent the mean HA gene expression levels measured by qPCR ± SD. Data from three technical replicates. Statistical significance was determined using two-sided unpaired t-test: *p = 0.025; **p = 0.0035; ***p = 0.0005; ns not significant.
Fig. 3
Fig. 3. E10 treatment protects mice against homo- and heterosubtypic IAV challenge.
a, b Schematic representation of the experimental design for in vivo studies. Mice were treated with either E10-Fc or PBS intraperitoneally (i.p.), followed by influenza virus infection (H1N1, H3N2 or H7N9), as outlined. Created with BioRender.com. ce Kaplan–Meier survival curve and body weight monitoring of influenza-infected mice. Mice were treated with E10-Fc or PBS as prophylaxis or therapy i.p and weight monitored for 14 days after infection with H1N1 (3 × 103 TCID50, lethal dose)/H3N2 (107 TCID50, lethal dose)/or H7N9 (106 EID50, lethal dose). Statistical significance of the Kaplan–Meier survival curves was calculated by log rank Mantel–Cox test. (H7N9 ***p = 0.0002; H3N2 ***p = 0.0001; H1N1 ***p = 0.0001). Weight change data are represented as mean ± SEM from three independent experiments (n = 15 per group). Statistical analysis was performed using two-way ANOVA: ***p = 0.0009; ****p < 0.0001, ns not significant. f Viral titer, measured by EID50, in six organs (lungs, nasal tissue, liver, spleen, kidney, brain) on day 3 post-SZ19 H7N9 infection, with or without E10 treatment, as described in (a, b). Data are representative of three independent experiments and shown as mean values from three technical replicates. Statistical analysis was performed using two-sided unpaired t-test. *p < 0.05; **p < 0.01; ***p < 0.01; ****p < 0.0001; ns not significant. g Representative histopathological analysis of lungs from mice on day 3 after H7N9 infection with or without E10, or MOCK treatment, as outlined in (a, b). Scale bar, 500 μm (left), 200 μm (middle), 20 μm (right).
Fig. 4
Fig. 4. E10 recognizes a conserved epitope located on HA-head lateral patch.
a E10 escape mutations in the H7N9 virus were identified using SPF eggs and MDCK cells. Variations at key residues involved in nanobody escape are highlighted, showing the sites where resistance developed. b Phage display selection of E10 nanobody identified specific peptides. The red region depicts the overlapping area among recognized peptides. The bolded region corresponds to the epitope identified through escape mutations, which overlap with key binding residues. c Epitope mapping of the nanobodies on SZ19 H7N9 HA protein showing the binding sites of six different nanobodies, each labeled with distinct colors (A11: red, E10: orange, H10: yellow, F3: blue, H12: dark blue, C11: black). The head domain of SZ19 H7 HA was modeled using Swiss-Model. Images were generated using Open-Source PyMOL version 2.5.0. d Quantitative analysis of amino acid substitutions at positions 166 and 167 across all H7N9 strains in the GISAID database. e Amino acid sequences flanking the E10 epitope are compared across various IAV strains, including A/Environment/Suzhou/SZ19/2014 (H7N9), A/California/07/2009 (H1N1 Pandemic), A/Puerto Rico/8/1934 (PR8, H1N1), and A/Hong Kong/1968 (X31, H3N2). Putative E10 epitope is highlighted in red, with the mutations selected by E10, at positions 166 and 167, underlined. f Three-dimensional (3D) model analysis of intramolecular interactions between E10-Fc and H7N9-HA obtained using ClusPro 2.0,. On the left, the HA trimer with two subunits in white and one in green; on the right, the modeled E10-Fc in light blue. The red area on HA is the interaction area, according to the model, while in dark blue is the interaction area on the nanobody. The black box indicates the area that is enlarged on the left side.
Fig. 5
Fig. 5. H7-HAK166T, S167L double mutant escapes E10 recognition but has lower viral fitness.
a IFA of A549 infected with wild-type (WT) or mutant (MUT) H7N9 virus (MOI = 0.1) at 24 h post-infection. Cell was stained with E10 as the primary antibody, followed by secondary goat anti-human IgG Fc Alexa Fluor™ 488. Nuclei were counterstained with DAPI (blue), and NP nanobody detection is shown in green. Data are representative of at least two independent experiments. b WB analysis of A549 cells infected with WT or MUT H7N9 viruses, with or without E10 pre-incubation, showing detection of NP and E10. Data are representative of at least two independent experiments. c Graph showing the 50% neutralization endpoint of E10 against WT and MUT viruses, measured by the ability of virus progeny to hemagglutinate red blood cells (RBCs). Data are representative of at least two independent experiments. Shown are the mean values of three technical replicates. d ELISA detection of WT-HA and MUT-HA hemagglutinin (HA) by E10 and F3 nanobodies. Bars represent mean ± SD. Data are representative of at least two independent experiments. Shown are the mean values of three technical replicates. e Experimental setup for the studies shown in (f, g). Created with BioRender.com. f Kaplan–Meier survival curve and body weight analysis of influenza-infected animals. Mice were treated intraperitoneally (i.p.) with either E10-Fc or PBS, as depicted in (e), and their weight was monitored for 14 days following infection with WT (106 EID50, lethal dose) or MUT virus (106 EID50). The statistical significance was calculated by log rank Mantel–Cox test for survival curve, p = 0.04. Weight change was monitored, and each graph is three experiments; n = 15; symbols represent means ± SEM. g Representative histopathological analysis of mouse lungs at day 3 post-infection with MUT virus, with or without E10 administration as outlined in (e). Scale bar, 500 μm in the left row, 200 μm in the middle row, 20 μm in the right row. h Growth kinetics of WT and MUT viruses in MDCK cells. Supernatants were collected at 6-, 12-, 24-, and 36-h post-infection (MOI = 0.001) and titrated by TCID50. Virus titers are presented as mean ± SD from three independent experiments. ***p = 0.001, ****p < 0.0001 (two-way ANOVA followed by Sidak test).
Fig. 6
Fig. 6. E10-epitope is immunodominant upon H7-IAV infection.
a, c Schematic illustration of epitope identification by flow cytometry. Created with BioRender.com. b Representative flow cytometry gating of GC and MBC for epitope identification in mln of WT-infected mice 14 days post-infection. GC B cells were gated as live CD3 B220+ IgD IgM GL7+ CD38, MBC as live CD3 B220+ IgD IgM GL7 CD38+. d Same as in (b) but for MUT-infected mice. e Quantification of epitope-specific MBC and GC B cells in mln of WT- and MUT-infected mice at 14 days post-infection. Two independent experiments with 5 mice each. Bars represent SEM; statistical analysis was performed using two-sided unpaired t-test. **p = 0.0016, ****p < 0.0001. f Quantification of ASC by ELISPOT, plates were coated with WT-HA and MUT-HA, and ASC were quantified in mln of WT vs. MUT infected mice. Spot-forming cells were normalized to 106 cells. Data from five mice per group. Bars represent SEM, statistical analysis was performed using two-sided unpaired t-test. *p = 0.034, **p = 0.0017. g Serum reactivity to WT-HA and MUT-HA in WT- and MUT-infected mice at 14 days post infection. Area under the curve (AUC) quantification is depicted. Data represent four independent experiments with five mice each (n = 20). Bars represent mean ± SEM; statistical analysis was performed using a two-sided unpaired t-test. ****p < 0.0001.
Fig. 7
Fig. 7. H7HA166-186 peptide immunization confers partial protection from lethal H7N9 infection.
a Schematic illustration of H7-HA166-186 peptide localization (shown in red) within the HA protein timer (gray). b Schematic timeline of peptide immunization protocol. Created with BioRender.com. c Serum binding analysis to H1, H3 and H7 HA proteins from mice immunized with H7HA166-186 peptide, OVA peptide and PBS. Data are shown as area under the curve (AUC) quantification of the ELISA curves. Representative of two independent experiments with 4–5 mice per group. Bars represent mean ± SEM, statistical analysis was performed using a one-way ANOVA followed by Tukey’s multiple comparison test; shown is only the difference between H7HA166-186 peptide vs. OVA groups. *p = 0.014, **p = 0.0012, ***p = 0.0005. d WB analysis of HA protein recognition from MDCK cells infected with H1N1, H3N2, or H7N9 viruses, using serum from H7-HA166-186 peptide-immunized mice. First antibody: serum from H7HA166-186 peptide-immunized mice, second antibody: anti-mouse IgG. e Graph showing Hemagglutination inhibition assay (HAI) titer of immunized serum against H1N1/H3N2/H7N9 viruses. Representative of two independent experiments with 4–5 mice per group. Bars represent mean ± SEM, statistical analysis was performed using a one-way ANOVA followed by Tukey’s multiple comparison test; shown is only the difference between H7HA166-186 peptide vs. OVA groups. ****p < 0.0001; H1N1 and H3N2: **p = 0.003. f Weight loss and survival curves of mice immunized with H7HA166-186 peptide. Mice (n = 10 per group, two independent experiments) were infected with H7N1 (1 TCID50, lethal dose) at day 42, after being immunized three times with H7HA166-186 peptide (see b). ****p < 0.0001.

Similar articles

Cited by

References

    1. Barry, J. M. The Great Influenza: The Story of the Deadliest Pandemic in History (Penguin UK, 2020).
    1. Iuliano, A. D. et al. Estimates of global seasonal influenza-associated respiratory mortality: a modelling study. Lancet391, 1285–1300 (2018). - PMC - PubMed
    1. Organization W. H. Global Influenza Strategy 2019-2030 (World Health Organization, 2019).
    1. Caserta, L. C. et al. Spillover of highly pathogenic avian influenza H5N1 virus to dairy cattle. Nature634, 669–676 (2024). - PMC - PubMed
    1. Jia, M. et al. Human neutralizing antibodies target a conserved lateral patch on H7N9 hemagglutinin head. Nat. Commun.15, 4505 (2024). - PMC - PubMed

MeSH terms

Substances

LinkOut - more resources