. 2025 Jan 9;16(1):8.
doi: 10.1038/s41419-024-07263-8.

Enhancing immunotherapy efficacy in colorectal cancer: targeting the FGR-AKT-SP1-DKK1 axis with DCC-2036 (Rebastinib)

Affiliations

Enhancing immunotherapy efficacy in colorectal cancer: targeting the FGR-AKT-SP1-DKK1 axis with DCC-2036 (Rebastinib)

Xiguang Chen et al. Cell Death Dis. .

Abstract

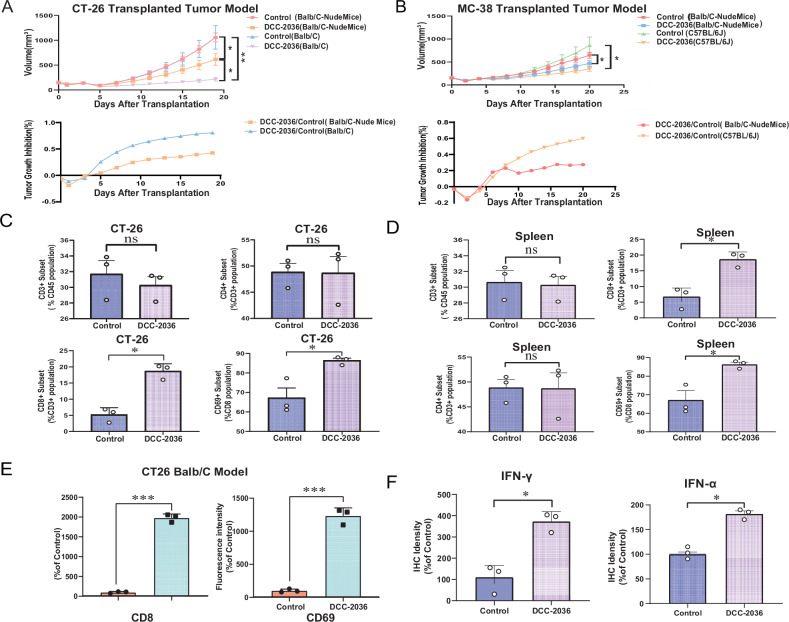
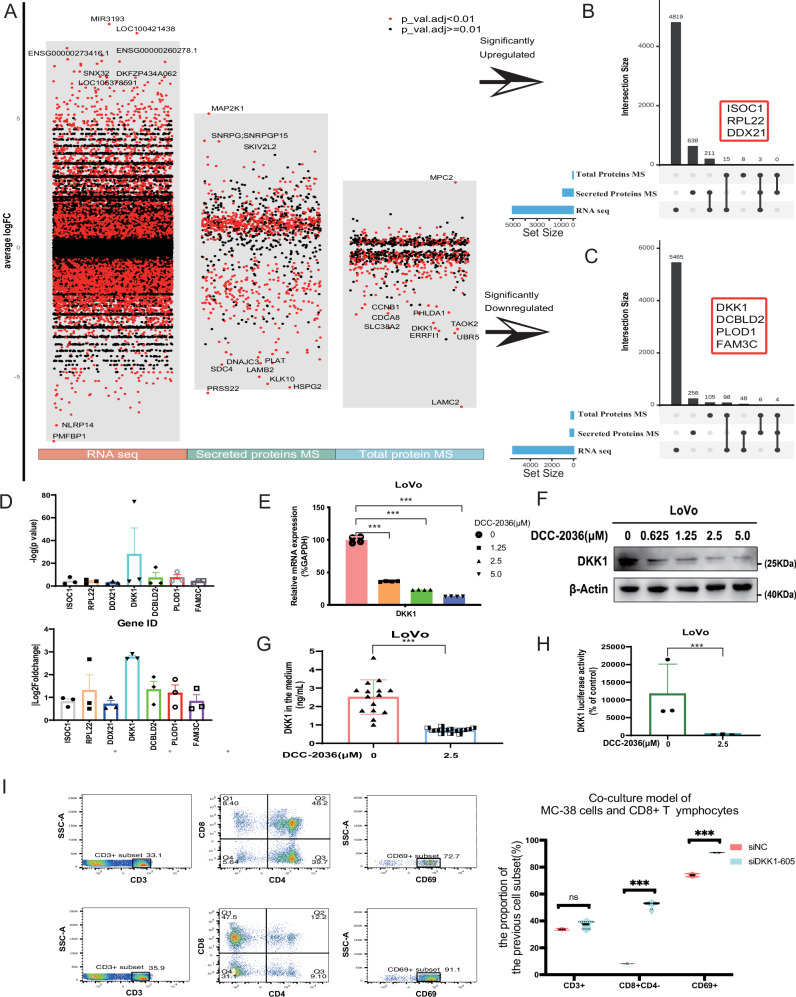
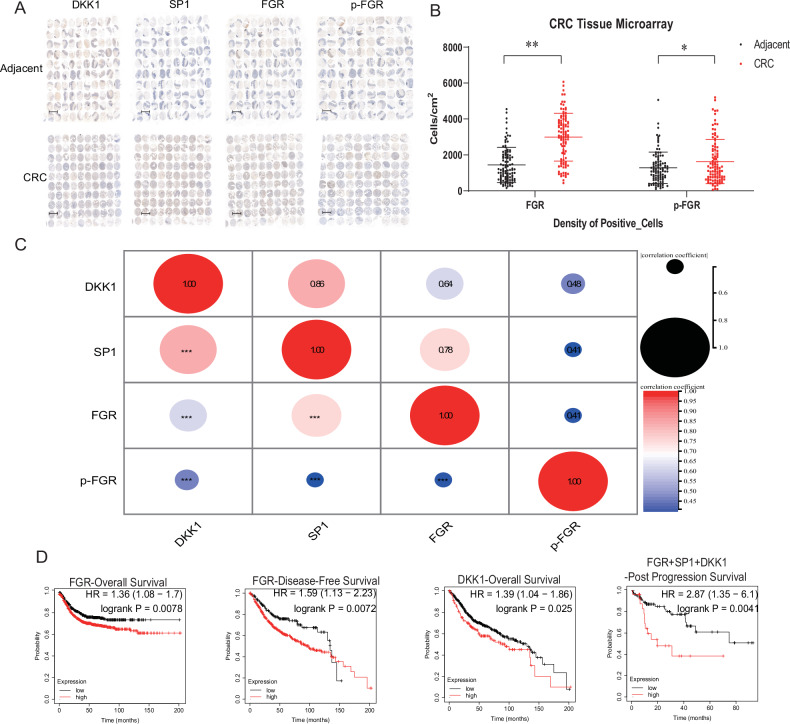
This research demonstrates that DCC-2036 (Rebastinib), a potent third-generation tyrosine kinase inhibitor (TKI), effectively suppresses tumor growth in colorectal cancer (CRC) models with functional immune systems. The findings underscore the capacity of DCC-2036 to enhance both the activation and cytotoxic functionality of CD8+ T cells, which are crucial for facilitating anti-tumor immune responses. Through comprehensive multi-omics investigations, significant shifts in both gene and protein expression profiles were detected, notably a marked decrease in DKK1 levels. This reduction in DKK1 was linked to diminished CD8+ T cell effectiveness, correlating with decreased FGR expression. Moreover, our findings identify FGR as a pivotal modulator that influences DKK1 expression via the PI3K-AKT-SP1 signaling cascade. Correlative analysis of clinical specimens supports the experimental data, showing that increased levels of FGR and DKK1 in CRC tissues are associated with inferior clinical outcomes and reduced efficacy of immunotherapeutic interventions. Consequently, targeting the FGR-AKT-SP1-DKK1 pathway with DCC-2036 could potentiate immunotherapy by enhancing CD8+ T cell functionality and their tumor infiltration. This strategy may contribute significantly to the refinement of therapeutic approaches for CRC, potentially improving patient prognoses.


Conflict of interest statement

Competing interests: No conflict of interest exists in the submission of this manuscript, and the manuscript is approved by all authors for publication. Ethics approval: The National Institutes of Health (NIH)‘s Guide for the Care and Use of Laboratory Animals served as the basis for this study. All efforts were made to minimize animal suffering during anesthesia with sodium pentobarbital (3.5% [w/v], 1 ml/kg). The experiments adhered to institutional guidelines and were approved by the ethics committee of the University of South China(# USC202209XS02). Consent for publication: Written informed consent for publication was obtained from all participants.

Figures

Fig. 1
Fig. 1. Analyzing the impact of DCC-2036 on CRC transplanted tumor: tumor growth inhibition, lymphocyte variation in CRC transplanted tumor.
A Growth analysis in CT-26 transplanted tumor models. Quantitative growth and inhibitory curves in Balb/C and Balb/C Nude mice treated with DCC-2036 (50 mg/kg) or vehicle control. Treatments were administered via oral gavage every other day. B Growth analysis in MC-38 transplanted tumor models. Quantitative growth and inhibitory curves in C57BL/6 J and Balb/C Nude mice treated with DCC-2036 (50 mg/kg) or vehicle control. Treatments were administered via oral gavage every other day. C Bar chart showing the distribution of CD8+ (%CD3+), CD4+(% CD3+), and CD69+(% CD8+) T cells in CT-26 xenografts across different treatment groups. Data expressed as mean ± SD, analyzed using Student’s t-test (*P < 0.05, ns: not significant). D Statistical Analysis of T Cell Subtypes: Bar chart depicting the percentage of various T cell subtypes within tumor-bearing mice spleens. Data expressed as mean ± SD, analyzed using Student’s t-test (*P < 0.05, ns: not significant). E Immunofluorescence Microscopy for CD8 and CD69, bar graphs quantifying fluorescence intensity, indicating expression levels of CD8 and CD69, analyzed using Student’s t-test (***P < 0.001). F Immunohistochemistry Staining of IFN-α and IFN-γ: bar graphs quantifying fluorescence intensity, indicating expression levels of IFN-α and IFN-γ, analyzed using Student’s t-test (***P < 0.001).
Fig. 2
Fig. 2. Comprehensive analysis of DCC-2036’s impact on gene and protein expression in LoVo cells.
A Volcano Plots of Molecular Changes in LoVo Cells: Illustrating alterations in RNA sequencing, total protein, and secreted protein profiles post DCC-2036 exposure (2.5 μM, 24 h). BC Upset diagram displaying the intersection of the up- or down-regulated genes/proteins. D Scatter Histogram of Gene/Protein Changes: Displaying |log2(Fold Change)| and -log10 (P value) for selected genes/proteins. EH Analysis of DKK1 in LoVo Cells: Evaluating mRNA levels (q-RT-PCR, E), secreted protein (ELISA, F), total protein (Western Blotting, G) and promoter activity (Dual-Luciferase Reporter Assay, H) post DCC-2036 administration. Data expressed as mean ± SD, analyzed using Student’s t-test (***P < 0.001). I Flow cytometric analysis of T cell subsets in the co-culture model of MC-38 cells and CD8+ T lymphocytes. The left panels show the gating strategy for CD3+, CD4+, CD8+, and CD69+ T cells. The top row represents the siNC (negative control) group, while the bottom row represents the siDKK1-605 group, where DKK1 expression was silenced(left). Quantification of T cell populations including CD3+, CD8+CD4-, and CD69+ subsets. The proportion of CD3+ cells showed no significant difference between the siNC and siDKK1-605 groups, while CD8+CD4- and CD69+ populations were significantly increased in the siDKK1-605 group compared to siNC. Data are presented as mean ± standard deviation. Statistical significance was determined using Student’s t-test (**P < 0.001, ns: not significant)(right).
Fig. 3
Fig. 3. Delineating the role of FGR as a direct target in the efficacy of DCC-2036 in colorectal cancer.
A Heatmap of Phosphorylated-Tyrosine Protein Kinases in DCC-2036 Treated LoVo Cells: Highlighting significant differences in kinase activity after 24 h exposure to 2.5 μM DCC-2036, as assessed by the PathScan® RTK Signaling Antibody Array Kit (Chemiluminescent Readout). B Pull-Down Assay Identifying Direct Targets of DCC-2036: Biotin-tagged DCC-2036 was used to capture interacting proteins in CRC cells, with non-immunoprecipitated LoVo lysates as positive control. C Western blot analysis showing the impact of different concentrations of DCC-2036 (0, 0.625, 1.25, and 2.5 μM) on FGR and phosphorylated FGR expression levels in LoVo cells, with β-Actin serving as a loading control. D Immunohistochemical analysis of p-FGR and FGR in a CT26 tumor model transplanted into Balb/C mice, comparing treated versus control groups at both 40× and 100× magnification.
Fig. 4
Fig. 4. Delineating the role of FGR as a critical target in the efficacy of DCC-2036 in colorectal cancer.
A Correlation Analysis Between FGR and Major Immune Cells in CRC TME: Illustrates the correlation between FGR expression and seven major immune cells in the TME of CRC. Positive correlations are shown in blue shade, while negative correlations are in red. The size of each node reflects the magnitude of the correlation. Analysis performed using Pearson’s correlation, two-sided, (***P < 0.001). B Boxplot Graph of Cell Infiltrates in CRC Samples with Varied FGR Expression: Demonstrates differences in cell infiltrates between three paired CRC samples, categorized by low and overexpressed FGR levels. Data sourced from Single Cell Expression Atlas-EBI (E-MTAB-8410) titled “Single-cell sequencing of colorectal tumors and adjacent non-malignant colon tissue”. Statistical significance was assessed using Student’s t-test (*, P <0.05). C Analysis of CT-26 Homografts: Depicts growth and inhibitory curves of CT-26 homografts generated via intratumor injection of shFGR/shNC lentiviruses. CT-26 cells were subcutaneously administered to 6-week-old Balb/C nude mice and Balb/C mice, with each group consisting of n = 8 mice, data expressed as mean ± SD, analyzed using Student’s t-test (*P < 0.05,***P < 0.001). D Lymphocyte Subpopulation Percentages: Shows the percentage of CD3, CD4, CD8, and CD69 lymphocyte subpopulations from three independent experiments, the data was reported as the mean ± standard deviation and subjected to statistical analysis using Student’s t-test (*P < 0.05, ns = not significant). E Immunofluorescent Staining in Implanted Tumors of Balb/C mice: The percentage of fluorescence intensity of CD8 and CD69 from three independent experiments. The data was presented as the mean ± standard deviation and analyzed utilizing Student’s t-test, with statistical significance denoted by ***P < 0.001. F CT-26 shFGR/shNC Homograft Mouse Models Treated with DCC-2036: The left panel shows changes in tumor volume over time. Right panel depicts the tumor growth inhibition index at harvest, represented by curves. G MC-38 shFGR/shNC Homograft Mouse Models Treated with DCC-2036: the left panel illustrating the changes in tumor volume over time, and the right panel presenting the tumor growth inhibition index at harvest. CT-26/MC-38 cells, either shFGR or shNC, were subcutaneously injected into mice. These mice were then orally treated with DCC-2036 (50 mg/kg) once every two days. Group size: n = 8. Statistical analysis was performed using Student’s t-test for individual comparisons (*p < 0.05, **p < 0.01). Data represent mean ± SD from experiments conducted in triplicate.
Fig. 5
Fig. 5. DCC-2036 mediated regulation of DKK1 through targeting FGR in colorectal cancer.
A Volcano Plots of Molecular Changes in LoVo Cells: Illustrating alterations in RNA sequencing, total protein, and secreted protein profiles post DCC-2036 exposure (2.5 μM) and FGR silencing(siFGR). B A comparative analysis was conducted to examine the expression of DKK1 in CRC tumors from the TCGA database, with a focus on the levels of FGR expression. The tumor samples were categorized into two groups based on FGR expression levels: ≤25% indicating low expression and ≥25% indicating overexpression. A scatterplot was used to compare the levels of DKK1 expression in samples falling within the highest (top 25%) and lowest (bottom 25%) quartiles of FGR expression. Error bars represent standard deviation (SD). Statistical significance between groups was determined using Student’s t-test (*P < 0.05). C–F The present study employed Spearman’s correlation analysis to evaluate the association between FGR and DKK1 gene expression levels, utilizing data sourced from the GEO database (www.ncbi.nlm.nih.gov/geo). G FGR knockdown resulted in a marked decrease in DKK1 expression, as evidenced in secretome profiles ELISA assays. Statistical analysis was performed using Student’s t-test for individual comparisons (**P < 0.01,***P < 0.001). Data represent mean ± SD from experiments conducted in triplicate. H The expression of DKK1 in LoVo cells treated with the combinations of FGR silenced and DCC-2036 (0 and 2.5 μM) was determined through Western blotting. I The expression of DKK1 in LoVo cells treated with the combinations of overexpression FGR and DCC-2036 (0 and 2.5 μM) was determined through Western blotting. ( DKK1 mRNA level was measured by q RT‐PCR after shFGR treatment. Statistical analysis was performed using Student’s t-test for individual comparisons (***P < 0.001). Data represent mean ± SD from experiments conducted in triplicate.
Fig. 6
Fig. 6. FGR regulates DKK1 through PI3K-AKT-mediated binding of SP1 to the DKK1 promoter in colorectal cancer.
A Immunoprecipitation (IP) and immunoblotting (IB) analysis demonstrating that FGR protein is pulled down using an anti-FGR antibody in LoVo cells. FGR was effectively immunoprecipitated, confirmed by immunoblotting for FGR. B Co-immunoprecipitation of DKK1 with FGR. The IP of FGR was performed, followed by IB for DKK1, indicating an interaction between FGR and DKK1. C Co-immunoprecipitation of SP1 with FGR in LoVo cells. After FGR was immunoprecipitated, the presence of SP1 was detected by immunoblotting. D The expression of SP1 in LoVo cells treated with the combinations of FGR silenced and DCC-2036 (0 and 2.5 μM) was determined through Western blotting. E FGR was knockdown via shFGR lentivirus in LoVo cells, and the protein levels of SP1 and DKK1 were determined by WB. F The expression of DKK1 and SP1 in LoVo cells treated with the combinations of SP1 overexpression and DCC-2036 (0 and 2.5 μM) was determined through Western blotting. G The left image is transfected with either the control vector alone or with the vector containing promoter fragments (mut1, mut2, mut3) in LoVo cells. Luciferase reporter activity was measured 48 hours post-transfection using a dual-luciferase assay. The right image is the effect of shFGR on the DKK1 promoter activity, which measured by luciferase reporter assay. The data was reported in terms of the mean ± standard deviation and subjected to analysis using Student’s t-test, with statistical significance indicated by ns = not significant, *P < 0.05, **P < 0.01, and ***P < 0.001. Scale bar = 2.0 cm. H ChIP assays were employed to show the direct binding of SP1 to DKK1 promoter regions (−167bp to −159bp and −118bp to −108bp) after shFGR treatment. The data was presented as mean ± standard deviation and analyzed using Student’s t-test, with statistical significance indicated by **P < 0.01. I The P-AKT and AKT protein levels were determined by WB after shFGR treatment. J the SP1 and DKK1 protein levels were determined by WB after AKT inhibitor treatment (MK-2206-2HCL) and overexpression of FGR (right).
Fig. 7
Fig. 7. Correlation of SP1, DKK1, FGR, p-FGR expression with clinical outcomes in CRC.
A TMA Staining Interpretation: Immunohistochemical staining of DKK1, SP1, FGR, and phosphorylated FGR (p-FGR) in adjacent and cancerous CRC tissues. The staining was interpreted by the pathology department of the first affiliated hospital of the University of South China. Scale bars = 50 μm. B Boxplot Analysis of Protein Expression: The density of positive cells for FGR and p-FGR in adjacent and cancerous CRC tissues is shown. Statistical significance was assessed using Student’s t-test (*P < 0.05, **P < 0.01). C Protein Expression Correlation Matrix and Scatter Plot: This section displays the correlations among the protein expressions of DKK1, SP1, FGR, and p-FGR in CRC. The matrix diagram and dotplot/correlation are provided to illustrate these relationships. Statistical significance was assessed using Student’s t-test (***P < 0.001). D Kaplan-Meier Survival Analysis: The Kaplan-Meier survival curves for FGR, DKK1, and the mean of FGR, DKK1, and SP1 are presented. The curves were generated using the Kaplan Meier plotter to assess the association between protein expression levels and patient survival.
Fig. 8
Fig. 8. Modulation of Immune Checkpoint Inhibitor Sensitivity by FGR in Colorectal Cancer.
A TIDE Prediction Score Analysis. This scatterplot summarizes the differences in TIDE prediction scores between samples with high (top 25%) and low (bottom 25%) expressions of FGR/DKK1. Error bars represent the standard deviation (SD). Statistical significance was assessed using Student’s t-test (*** P < 0.001). B Transcriptomic and Genomic Analyses of FGR/DKK1: These analyses were conducted on pre-treated neoplastic biopsies from patients responsive and resistant to immunotherapy (such as anti-PD-L1 and anti-PD1 therapies), utilizing the TISIDB database. C Growth curves for MC-38 homografts stably transfected with overexpression FGR lentivirus or control lentivirus, treated with Atezolizumab. MC-38/oeFGR and MC-38/Control cells were subcutaneously injected into congenic mice, which were then orally treated with DCC-2036 as previously described. Group size: n = 4. D Growth curves of implanted CT-26 subcutaneous tumors in Mice models treated with combinations of DCC-2036 and Atezolizumab or separated in 6–8 week old Balb/C mice. E Similar to part, growth curves of implanted MC-38 subcutaneous tumors in Mice models treated with combinations of DCC-2036 and Atezolizumab or separated in 6–8 week old C57BL/6 J mice. Oral administration of DCC-2036 was at 50 mg/kg every other day, and Atezolizumab was injected at 5.0 mg/kg twice a week. Data are from three biological replicates, analyzed using Student’s unpaired t-test (*P < 0.05, **P < 0.01, ***P < 0.001).

Similar articles

References

    1. Siegel RL, Wagle NS, Cercek A, Smith RA, Jemal A. Colorectal cancer statistics, 2023. CA Cancer J Clin. 2023;73:233–54. - PubMed
    1. Sung H, Ferlay J, Siegel RL, Laversanne M, Soerjomataram I, Jemal A, et al. Global Cancer Statistics 2020: GLOBOCAN Estimates of Incidence and Mortality Worldwide for 36 Cancers in 185 Countries. CA Cancer J Clin. 2021;71:209–49. - PubMed
    1. Siegel RL, Miller KD, Goding Sauer A, Fedewa SA, Butterly LF, Anderson JC, et al. Colorectal cancer statistics, 2020. CA Cancer J Clin. 2020;70:145–64. - PubMed
    1. Le DT, Uram JN, Wang H, Bartlett BR, Kemberling H, Eyring AD, et al. PD-1 Blockade in Tumors with Mismatch-Repair Deficiency. N Engl J Med. 2015;372:2509–20. - PMC - PubMed
    1. Le DT, Durham JN, Smith KN, Wang H, Bartlett BR, Aulakh LK, et al. Mismatch repair deficiency predicts response of solid tumors to PD-1 blockade. Science. 2017;357:409–13. - PMC - PubMed

MeSH terms

Substances