. 2025 Jan 9;16(1):545.
doi: 10.1038/s41467-024-55693-x.

The NE/AAT/CBG axis regulates adipose tissue glucocorticoid exposure

Affiliations

The NE/AAT/CBG axis regulates adipose tissue glucocorticoid exposure

Luke D Boyle et al. Nat Commun. .

Abstract

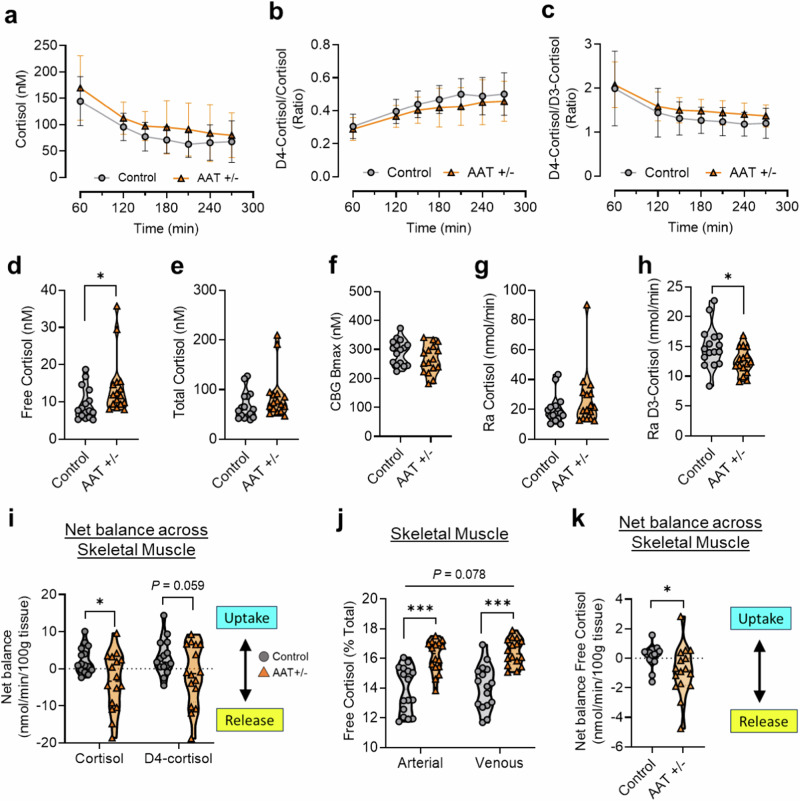
Corticosteroid binding globulin (CBG; SERPINA6) binds >85% of circulating glucocorticoids but its influence on their metabolic actions is unproven. Targeted proteolytic cleavage of CBG by neutrophil elastase (NE; ELANE) significantly reduces CBG binding affinity, potentially increasing 'free' glucocorticoid levels at sites of inflammation. NE is inhibited by alpha-1-antitrypsin (AAT; SERPINA1). Using complementary approaches in mice and humans to manipulate NE or AAT, we show high-fat diet (HFD) increases the NE:AAT ratio specifically in murine visceral adipose tissue, an effect only observed in males. Notably, HFD-fed male mice lacking NE have reduced glucocorticoid levels and action specifically in visceral adipose tissue, with improved glucose tolerance and insulin sensitivity, independent of systemic changes in free glucocorticoids. The protective effect of NE deficiency is lost when the adrenals are removed. Moreover, human asymptomatic heterozygous carriers of deleterious mutations in SERPINA1 resulting in lower AAT levels have increased adipose tissue glucocorticoid levels and action. However, in contrast to mice, humans present with systemic increases in free circulating glucocorticoid levels, an effect independent of HPA axis activation. These findings show that NE and AAT regulate local tissue glucocorticoid bioavailability in vivo, providing crucial evidence of a mechanism linking inflammation and metabolism.


Conflict of interest statement

Competing interests: The authors declare no competing interests.

Figures

Fig. 1
Fig. 1. The NE/AAT/CBG axis regulates glucocorticoid action in vitro.
a NE activity is inhibited with indicated concentrations of AAT. Data are presented as mean −/+ SD. (A.U.; arbitrary units). b, c Treatment of 1:50 diluted mouse serum (b) and human serum (c) with either NE alone (4 U; green circle) or NE + AAT (100 µM; orange circle) for 10 min at 37 °C. Data are presented as individual points for n = 4 biological replicates. d, e Free glucocorticoid in diluted mouse serum (d) and human serum (e) treated with either NE alone (4 U; green circle) or NE + AAT (100 µM; orange circle). f Glucocorticoid-responsive luciferase reporter activity in human embryonic kidney (HEK293) cells -/+ transfection with human glucocorticoid receptor (GR). Cells were treated for 24 h with 1:50 diluted human serum -/+ NE (4 U, 10 min, 37 °C). Data are presented as individual points for n = 4 biological replicates. Data are presented as individual points for n = 4 biological replicates. Data analysed by RM one-way ANOVA with Tukey’s post-hoc tests (ae), or two-tailed paired t-test (f). *P < 0.05, ***P < 0.001.
Fig. 2
Fig. 2. Neutrophil elastase deficiency improves HFD-induced glucose intolerance and insulin resistance in male, but not female mice.
ad Body weight of male and female neutrophil elastase deficient (Elane−/−; purple circle for male, blue triangle for female) mice or wild-type (WT; green circle for male, ivory triangle for female) littermates fed a high-fat diet for 8 weeks. Corresponding weight gains are depicted. eh Blood glucose levels during an IPGTT in mice with the indicated genotypes and sex. Corresponding areas under the curve (AUCs) are depicted. in Plasma insulin levels during 0 min and 15 min time points of IPGTT in mice with the indicated genotypes and sex. Corresponding changes in plasma insulin post-glucose are depicted. HOMA-IR measure of insulin sensitivity are depicted. o–r Blood glucose levels during insulin tolerance test (ITT) in mice with the indicated genotypes and sex. Glucose decay rate during the ITT (kITTs) are depicted. Data are presented as mean (dashed line) -/+ SD (dotted line). Male WT n = 7, male Elane−/− n = 7, female WT n = 5, female Elane−/− n = 9. Data analysed by RM two-way ANOVA with Sidak post-hoc tests (a, c, e, g, i, l, o, q), or two-tailed unpaired t-tests (b, d, f, h, j, k, m, n, p, r). *P < 0.05, **P < 0.01.
Fig. 3
Fig. 3. HFD-fed male Elane−/− mice display reduced glucocorticoid action in visceral adipose tissue.
a–d, Serum glucocorticoid parameters in male Elane−/− (purple circle) and WT (green circle) mice after 8 weeks of HFD, including total corticosterone (a), free corticosterone (b), percent free corticosterone (c), and CBG binding capacity (d). e Tissue weights as % body weight for the indicated genotypes. f, Serum triglyceride levels (WT n = 7, Elane−/− n = 5). g Representative H& E images of gonadal adipose (gWAT), scale bar = 100 µm. h quantification of adipocyte size for the indicated genotypes. i, j gWAT corticosterone levels and transcript expression for the indicated genotypes. k, l Representative H&E images of liver (scale bar = 100 µm) and quantification of lipid accumulation for the indicated genotypes. m, n Liver corticosterone levels and transcript expression for the indicated genotypes. Data are presented as mean (dashed line) -/+ SD (dotted line). Male WT n = 7, male Elane−/− n = 7 unless otherwise stated. Data analysed by two-tailed unpaired t-tests. *P < 0.05, **P < 0.01, ***P < 0.001.
Fig. 4
Fig. 4. The improved metabolic phenotype of male Elane−/− mice is adrenal-dependent.
a, b Body weight of male neutrophil elastase deficient (Elane−/−; purple symbols) mice or wild-type (WT; green symbols) littermates who underwent bilateral adrenalectomy (ADX; white-filled symbols) or sham-surgery (Sham; colour-filled symbols) prior to 8-week HFD. Corresponding weight gains are depicted. c, d Blood glucose levels during an IPGTT in mice with the indicated genotypes and surgery. Corresponding areas under the curve (AUCs) are depicted. e Plasma insulin levels during 0 min and 15 min time points of IPGTT in mice with the indicated genotypes and surgery. f HOMA-IR measure of insulin sensitivity with the indicated genotypes and surgery. Data are presented as mean (dashed line) -/+ SD (dotted line). WT: Sham n = 7, Elane−/−: Sham n = 7, WT: ADX n = 7, Elane−/−: ADX n = 6. Data analysed by RM two-way ANOVA (a, c, e) or two-way ANOVA with Sidak’s post-hoc tests (b, d, f). ANOVA results are indicated beside graphs. *P < 0.05, **P < 0.01, ***P < 0.001. ns = not significant.
Fig. 5
Fig. 5. Arterio-venous sampling across tissue reveals increased local glucocorticoid exposure in AAT heterozygotes.
Arterio-venous sampling in subjects with heterozygous mutations in SERPINA1 (AAT +/-; orange triangles) and matched controls (Control; grey circles) with steady-state 9,11,12,12-[2H]4-cortisol (D4-cortisol) tracer infusion. ac Plasma profile during D4-cortisol infusion, including endogenous cortisol levels (a), D4-cortisol/cortisol ratio (b), and D4-cortisol/D3-cortisol ratio (c). df Plasma glucocorticoid profile during steady state (180 – 270 min), including free cortisol (d), total cortisol (e), and CBG binding capacity (f). gh Whole body rate of appearance (Ra) of cortisol (g) and D3-cortisol (h) during steady state. i Net balance of cortisol and D4-cortisol across skeletal muscle. j Percent free cortisol across skeletal muscle. k Net balance of free cortisol across skeletal muscle. Data are presented as mean (dashed line) -/+ SD (dotted line). Control n = 16, AAT + /- n = 16. Data analysed by Mixed-effects model (ae), two-tailed unpaired t-tests (dh, k), or RM two-way ANOVA with Sidak’s post-hoc tests (i, j). *P < 0.05, ***P < 0.001.
Fig. 6
Fig. 6. Humans with reduced AAT levels have an increased free cortisol fraction in parallel with increased adipose cortisol exposure.
ac Circulating glucocorticoid profile in subjects with heterozygous mutations in SERPINA1 (AAT +/-; orange symbols) and matched controls (Control; grey symbols), as part of a randomised, double-blind crossover study, using either a combination of RU486 and spironolactone (CRASH; white-filled symbols) or placebo (colour-filled symbols), including percent free cortisol (a), total cortisol (b), and CBG (c). d Cortisol levels in subcutaneous abdominal adipose from subjects with the indicated genotype and treatment. e Transcript expression in subcutaneous abdominal adipose from subjects with the indicated genotype in the placebo group. Data are presented as mean (dashed line) -/+ SD (dotted line). Control: Placebo n = 16, AAT + /-: Placebo n = 16, Control: CRASH n = 16, AAT + /-: CRASH n = 16. Data are analysed by Mixed-effects model (effects and corresponding P-values indicated on graph) (ac), RM two-way ANOVA with Sidak’s post-hoc tests (d), or two-tailed unpaired t-tests (e). *P < 0.05.
Fig. 7
Fig. 7. Overview of proposed NE/AAT/CBG control of local and systemic glucocorticoid action in mice and humans.
Illustration of proposed NE/AAT/CBG mechanism of action in murine obesity and in humans with alterations in AAT levels. Created in BioRender (https://BioRender.com/b20b142).

References

    1. Kershaw, E. E. et al. Adipocyte-specific glucocorticoid inactivation protects against diet-induced obesity. Diabetes54, 1023–1031 (2005). - PMC - PubMed
    1. Gathercole, L. L. et al. Glucocorticoid modulation of insulin signaling in human subcutaneous adipose tissue. J. Clin. Endocrinol. Metab.92, 4332–4339 (2007). - PMC - PubMed
    1. Tomlinson, J. W. et al. Reduced glucocorticoid production rate, decreased 5alpha-reductase activity, and adipose tissue insulin sensitization after weight loss. Diabetes57, 1536–1543 (2008). - PMC - PubMed
    1. Ragnarsson, O. et al. Overall and disease-specific mortality in patients with cushing disease: a swedish nationwide study. J. Clin. Endocrinol. Metab.104, 2375–2384 (2019). - PubMed
    1. Crawford, A. A. et al. Variation in the SERPINA6/SERPINA1 locus alters morning plasma cortisol, hepatic corticosteroid binding globulin expression, gene expression in peripheral tissues, and risk of cardiovascular disease. J. Hum. Genet.66, 625–636 (2021). - PMC - PubMed