. 2025 Jan 9;16(1):557.
doi: 10.1038/s41467-025-55851-9.

DCAF13-mediated K63-linked ubiquitination of RNA polymerase I promotes uncontrolled proliferation in Breast Cancer

Affiliations

DCAF13-mediated K63-linked ubiquitination of RNA polymerase I promotes uncontrolled proliferation in Breast Cancer

Zhi-Zhi Yang et al. Nat Commun. .

Abstract

Hyperactivation of ribosome biogenesis (RiBi) drives cancer progression, yet the role of RiBi-associated proteins (RiBPs) in breast cancer (BC) is underexplored. In this study, we perform a comprehensive multi-omics analysis and reveal that assembly and maturation factors (AMFs), a subclass of RiBPs, are upregulated at both RNA and protein levels in BC, correlating with poor patient outcomes. In contrast, ribosomal proteins (RPs) do not show systematic upregulation across various cancers, including BC. We further demonstrate that the oncogenic activation of a top AMF candidate in BC, DCAF13, enhances Pol I transcription and promotes proliferation in BC cells both in vitro and in vivo. Mechanistically, DCAF13 promotes Pol I transcription activity by facilitating the K63-linked ubiquitination of RPA194. This process stimulates global protein synthesis and cell growth. Our findings uncover a modification of RPA194 that regulates Pol I activity; this modification is dysregulated in BC, contributing to cancer progression.


Conflict of interest statement

Competing interests: The authors declare no competing interests.

Figures

Fig. 1
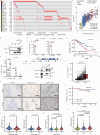
Fig. 1. AMFs are associated with BC.
a Patterns of RiBP dysregulation across 15 different cancer types. Variations in color intensity correspond to the log2-fold change (log2FC) in expression levels. The upper bar plot illustrates the frequency with which each RiBP is dysregulated across the cancer types examined. A mutation heatmap reveals the proportion of BC patients with RiBP mutations. b Bar graphs depicting the percentage of significantly up-regulated AMFs (blue) and RPs (red) across 15 cancer types. c Heatmap of RiBPs proteome profiles in BC patients (Tumor n = 133, Normal n = 18, from CPTAC project). d Stacked bar chart showing the counts of up-regulated, unchanged and down-regulated RPs and AMFs as inferred from differential proteomic analysis. e The mutation frequency of core-AMFs (n = 94), known oncogenes (n = 206), tumor suppressor genes (TSGs, n = 220), and transcription factors (TFs, n = 1353) in BC patients. fg Boxplots illustrating the log2FC in the mRNA expression level of core-AMFs across different tumor grades (Grade 1, n = 183; Grade 2, n = 632; Grade 3, n = 253) (f) and clinical subtypes (HR, n = 657; HER2, n = 153; TN, n = 170) (g) compared to normal in BC patients. h Kaplan3-Meier survival analysis of TCGA-BC dataset (high n = 546, low n = 540) based on predictive survival using 113 core-AMFs gene signatures as determined by gene expression levels. i Gene silencing effects of 113 core-AMFs using open-source shRNA data in 16 BC cell lines and 200 other cancer cell lines. Distribution of log2 ratios between final cell populations and initial DNA pool for core-AMFs, known oncogenes, known TSGs, and non-cancer genes. eg, i, Box plots show the distribution of data across groups. The central line within the box represents the median value. The upper and lower edges of the box represent the 75th and 25th percentiles, respectively (Interquartile Range, IQR). The whiskers extend from the box to the maximum and minimum values within 1.5 times the interquartile range (IQR), with any data points beyond this range considered as outliers. Data shown as mean ± SEM. Statistical analysis between all groups was conducted by two-sided Wilcoxon rank-sum test (eg, i) or two-sided Log-rank (Mantel-Cox) test (h).
Fig. 2
Fig. 2. AMFs enhance growth in BC cell lines.
a The top 10 BC prognosis-associated RiBPs from the TCGA-BC and Chia-Ho cohorts. The upper bar chart displaying the -log10 p-value for these RiBPs, derived from Kaplan-Meier overall survival analysis. The middle and lower heatmap showing the p-value and associated log2FC for these RiBPs, respectively. b Violin plots illuminating the differential mRNA expression levels of DCAF13, DKC1, and RPP40 between BC and normal tissue samples. c Kaplan-Meier overall survival curves elucidating the prognostic significance of DCAF13, DKC1, and RPP40 mRNA expression levels in BC patients. d A SUnSET assay executed on MDA-MB-231 cells following the knockdown of each of the three aforementioned AMFs. On the right is the corresponding statistical graph (n = 3 biological replicates). e, f CCK8 assay (e) and colony formation assay (n = 3 biological replicates) (f) administered to MDA-MB-231 cells after knockdown of DCAF13, DKC1, and RPP40, respectively. g Colony formation assay performed on MCF10A cells following the knockdown of DCAF13, DKC1, and RPP40, respectively. The corresponding statistical graph is shown on the right (n = 3 biological replicates). b Box plots show the distribution of data across groups. The central line within the box represents the median value. The upper and lower edges of the box represent the 75th and 25th percentiles, respectively (Interquartile Range, IQR). The whiskers extend from the box to the maximum and minimum values within 1.5 times the interquartile range (IQR), with any data points beyond this range considered as outliers. ad, f, g Data shown as mean ± SEM. P-values of survival analysis were calculated using the two-sided Log-rank (Mantel-Cox) test, p-value of differential expression analysis were calculated using the Likelihood Ratio Test, and subsequently adjusted using the Benjamini-Hochberg (BH) method to obtain False Discovery Rate (FDR) value (a). Statistical significance was calculated by two-sided Wilcoxon rank-sum test (b), two-sided Log-rank (Mantel-Cox) test (c), two-tailed unpaired Student’s t-test (d, f, g). Source data are provided as a Source Data file.
Fig. 3
Fig. 3. Elevated DCAF13 levels correlate with poor clinical outcomes in BC patients.
a Heatmap depicting the amplification frequency for three core-AMFs, CUL4-DDB1-DCAF13 complex genes, and other DCAF family members. b Western blot analysis of DCAF13 levels to validate efficiency of DCAF13 capture in RIP samples. c qRT-PCR assays confirming enrichment of U3 and pre-rRNA, but not ACTIN mRNA in DCAF13 RIP products (n = 3 biological replicates). d qRT-PCR assays in the upper panel demonstrating enrichment of U3 and pre-rRNA (n = 3 biological replicates). The lower panel displaying localization of ChIRP probes in on pre-rRNA. e ChIRP assays indicating successful capture of DCAF13 and DDX21 by both pre-rRNA and U3 probes, but not GAPDH. f Scatter plot illustrating correlation between DCAF13 mRNA expression level and CNV. X-axis denotes CNV segment value, y-axis denotes DCAF13 mRNA expression level, dot colors indicate CNV type. g Kaplan-Meier overall survival analysis for CNV in BC. h IHC staining of DCAF13 in tumor and normal tissues. i Paired box plot showing the H-score among paired normal and tumor patient tissues (n = 140 per group). j Kaplan–Meier overall survival analysis of IHC rating scores in BC. k-n Association between DCAF13 mRNA expression and clinicopathological factors: age (Age <= 40 years, n = 116; Age > 40 years, n = 1788) (k), tumor size (Size <10 cm, n = 37; Size >= 10 cm, n = 1847) (l), tumor grade (Grade 1, n = 165; Grade 2, n = 740; Grade 3, n = 927) (m), and molecular subtypes (HR, n = 1369; HER2, n = 236; TN, n = 299) (n). i, kn Box plots show the distribution of data across groups. The central line within the box represents the median value. The upper and lower edges of the box represent the 75th and 25th percentiles, respectively (Interquartile Range, IQR). The whiskers extend from the box to the maximum and minimum values within 1.5 times the interquartile range (IQR), with any data points beyond this range considered as outliers. Scale bars,100μm (h). c, d, f, g, in Data shown as mean ± SEM. Statistical tests: two-tailed unpaired Student’s t-test (c, d, i), two-sided Pearson and Spearman correlation coefficient (f), two-sided Log-rank (Mantel-Cox) test (g, j), two-sided Wilcoxon rank-sum test (kn). Source data are provided as a Source Data file.
Fig. 4
Fig. 4. DCAF13 promotes global translation by interacting with Pol I.
a Overexpression of DCAF13 promotes the synthesis rate of nascent proteins in MDA-MB-231 and MDA-MB-468 cells. b Silver staining assay identifying proteins interacting with DCAF13 following Immunoprecipitation with anti-DCAF13 antibody. c Complex enrichment analysis of DCAF13-interacting proteins, with log10 p-value calculated using Benjamini linear step-up correction method. d IF assays detecting the localization of DCAF13 and RPA194 in MDA-MB-231 cells treated with DMSO, ActD, or transfected with siRNA targeting to DCAF13. e IF assays of full-length DCAF13 or truncated DCAF13 using anti-HA antibody to visualize its localization. f 5-Ethynyl uridine (EU) assays of MDA-MB-231 cells transfected with either a scramble or siDCAF13. g, h qRT-PCR assay detecting the RNA levels of DCAF13 and nascent pre-rRNA after knocking down (siD13) (g) or overexpressing (oeD13) (h) DCAF13 in MDA-MB-231 cells (n = 3 biological replicates). i IF assays in MDA-MB-231 cells treated with DMSO, ActD, or transfected with siDCAF13, siDDB1, and siCUL4A, with simultaneously stained for UBF and NPM. j RNA-fluorescence in situ hybridization (RNA FISH) assay of MDA-MB-231 cells treated with DMSO or ActD using a Cy3-U3 DNA probe, co-staining with NPM and UBF antibodies, to label U3 and nucleolar markers concurrently. k-l Co-IP assay of MDA-MB-231 cells using either anti-IgG, anti-DCAF13 (k), or anti-RPA194 antibody (l), and analyzed by Western blotting with indicated antibodies. Scale bars, 5μm (df, i, j). g, h Data shown as mean ± SEM. Statistical significance was calculated by two-tailed unpaired Student’s t-test. Source data are provided as a Source Data file.
Fig. 5
Fig. 5. DCAF13-mediated K63-linked polyubiquitination of RPA194 promotes rDNA transcription.
a, b Western blot analysis of the ubiquitination levels of RPA194 in MDA-MB-231 cells subjected to DCAF13 knockdown (a) or overexpression (b), followed by HA-Ub transfection for 48 hours. c Western blot analysis of the ubiquitination levels of RPA194 in HeLa cells co-transfected with full-length DCAF13 or domain-depleted DCAF13, along with HA-Ub. d Western blot analysis of the ubiquitination levels of RPA194 in MDA-MB-231 cells transfected with either scramble or siDCAF13 for 24 hours, followed by a subsequent 24-hour transfection with HA-ubiquitin (Lys48 or Lys63-specific). e Western blot analysis of K63-linked ubiquitination levels of RPA194 in HeLa cells subjected to serum starvation and subsequent serum activation. f Western blot analysis of ubiquitination levels of RPA194 in HeLa cells transfected with either scramble or siUSP36 for 24 hours, followed by an additional 24-hour transfection with HA-K48 or HA-K63. g Co-IP assays on HeLa cells transfected with pKO-SFB-USP36 to explore interactions between RPA194 and USP36. h IF assays detecting the localization of USP36 and RPA194 in HeLa cells treated with DMSO, ActD, or transfected with siUSP36. Scale bars, 5μm (h). Source data are provided as a Source Data file.
Fig. 6
Fig. 6. DCAF13 mediates K63-linked ubiquitination at K1180 and K1184 sites on RPA194.
a GST pull-down assay using purified GST, GST-RPA194-N, GST-RPA194-M, GST-RPA194-C and DCAF13 protein in MDA-MB-231 cell lysates, and employing anti-GST beads as the bait, demonstrated direct binding region. b After transfection with FN-RPA194-WT, FN-RPA194-Nmut and FN-RPA194-Cmut plasmid respectively, the Hela cells were directly subjected to IF experiments. The subcellular localization and morphology of the different forms of RPA194 were then observed under confocal microscopy. c After transfecting the RPA194 single point mutant plasmid and HA-K63 in Hela cells, the ubiquitination levels of different mutant form of RPA194 were analyzed by western blot. d The spatial structure of the Pol I complex mapped by ChimeraX, where K1101, K1180, K1184 and K1574 are located on the periphery of the complex. e Western blot analysis of the effect about over-expression of DCAF13 on K63-linked ubiquitination of RPA194 wild type and mutant. f IF assay of EGFP-FBL knock-in Hela cells after transfected with Ruby3-RPA194-WT or Ruby3-RPA194-K1180/1184 R. Scale bars, 5 μm (b, f). Source data are provided as a Source Data file.
Fig. 7
Fig. 7. DCAF13-mediated K63-linked ubiquitination of RPA194 promotes the transcriptional activity of Pol I. a.
Western blot analysis of RPA194 levels in MDA-MB-231 cells transfected with either scramble control or siDCAF13 and subsequently treated with 10 μg/mL cycloheximide (CHX) for specified durations. b Western blot analyses detecting POLR1B, POLR1C, POLR1D, and POLR1E levels in MDA-MB-231 cells transfected with either scramble control or siDCAF13, following immunoprecipitation with an anti-POLR1A antibody. c Chromatin immunoprecipitation sequencing (ChIP-Seq) assay identifying RPA194 enrichment on rDNA in MDA-MB-231 cells transfected with either scramble control or siDCAF13. Read normalization was accomplished using Counts Per Million (CPM) via deepTools; the structure of 18S, 5.8S, and 28S rRNA genes is depicted below the profile. d ChIP-qPCR analysis detecting the binding of TAF1C to rDNA in MDA-MB-231 cells transfected with scramble control or siDCAF13 (n = 3 biological replicates). e ChIP-qPCR analysis detecting the binding of Pol I to rDNA in Hela cells transfected with EV, FN-RPA194-WT or FN-RPA194-K1180/1184 R (n = 3 biological replicates). f Western blot analysis of the levels of K63-linked ubiquitination of RPA194 in HeLa cells transfected with either scramble control or siCK2. g qRT-PCR assays measuring RNA levels of CK2 and pre-rRNA in HeLa cells transfected with siCK2 (n = 3 biological replicates). h Western blot analysis of the levels of K63-linked ubiquitination of RPA194 in HeLa cells transfected with an oe-DCAF13 plasmid and/or siCK2. d, e, g Data shown as mean ± SEM. Statistical significance was calculated by two-tailed unpaired Student’s t-test. Source data are provided as a Source Data file.
Fig. 8
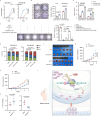
Fig. 8. DCAF13 promotes tumor growth via global activation of translation.
a, b CCK8 assay (a) and colony formation assay (b) conducted on MDA-MB-231 and MDA-MB-468 cells following the overexpression of DCAF13 (n = 3 biological replicates). c Colony formation assay of MDA-MB-231 cells transfected with either siNC or siRPA194 alone, and included cells transfected with the EV, FN-RPA194-WT, or FN-RPA194-K1180/1184 R plasmid respectively in combination with siRPA194 (n = 3 biological replicates). d, e Flow cytometry analyses assessing cell cycle alterations (d) and apoptotic events (e) in MDA-MB-231 and MDA-MB-468 cells after knocking down DCAF13 (n = 3 biological replicates). f Representative images depicting resected tumors harvested from BALB/c nude mice, which were inoculated with MDA-MB-231 cells stably expressing either the Empty Vector (control), WT DCAF13, shNC (control), or shDCAF13 plasmids. g, h Longitudinal measurements of tumor volumes collected at predetermined intervals (n = 8/group for EV/oe-DCAF13, n = 9/group for shNC/shDCAF13). i The weights of the excised tumors recorded at the designated end point of the study (n = 6/group for EV/oe-DCAF13, n = 7/group for shNC/shDCAF13). j Schematic model of this study drawn by eBioart of Guangzhou Guorenqidian Shengwukeji Co., Ltd. DCAF13 facilitates K63-linked ubiquitination of RPA194, which can be removed by USP36. The elevated expression of DCAF13 in BC leads to hyper-ubiquitination of RPA194 and boosts the transcription activity of Pol I, promoting BC progression through increasing protein synthesis rates. ae, gi, Data shown as mean ± SEM. Statistical significance was calculated by two-tailed unpaired Student’s t-test. Source data are provided as a Source Data file.

Similar articles

References

    1. Domostegui, A. et al. Impaired ribosome biogenesis checkpoint activation induces p53-dependent MCL-1 degradation and MYC-driven lymphoma death. Blood137, 3351–3364 (2021). - PMC - PubMed
    1. Sulima, S. O., Hofman, I. J. F., De Keersmaecker, K. & Dinman, J. D. How ribosomes translate cancer. Cancer Discov.7, 1069–1087 (2017). - PMC - PubMed
    1. Izumikawa, K. et al. LYAR potentiates rRNA synthesis by recruiting BRD2/4 and the MYST-type acetyltransferase KAT7 to rDNA. Nucleic Acids Res47, 10357–10372 (2019). - PMC - PubMed
    1. Yang, X. M. et al. Nucleolar HEAT repeat containing 1 up-regulated by the mechanistic target of rapamycin complex 1 signaling promotes hepatocellular carcinoma growth by dominating ribosome biogenesis and proteome homeostasis. Gastroenterology165, 629–646 (2023). - PubMed
    1. Bohnsack, K. E. & Bohnsack, M. T. Uncovering the assembly pathway of human ribosomes and its emerging links to disease. EMBO J.38, e100278 (2019). - PMC - PubMed

LinkOut - more resources