. 2025 Jan 9;16(1):551.
doi: 10.1038/s41467-024-55800-y.

Klebsiella oxytoca facilitates microbiome recovery via antibiotic degradation and restores colonization resistance in a diet-dependent manner

Affiliations

Klebsiella oxytoca facilitates microbiome recovery via antibiotic degradation and restores colonization resistance in a diet-dependent manner

Éva D H Almási et al. Nat Commun. .

Abstract

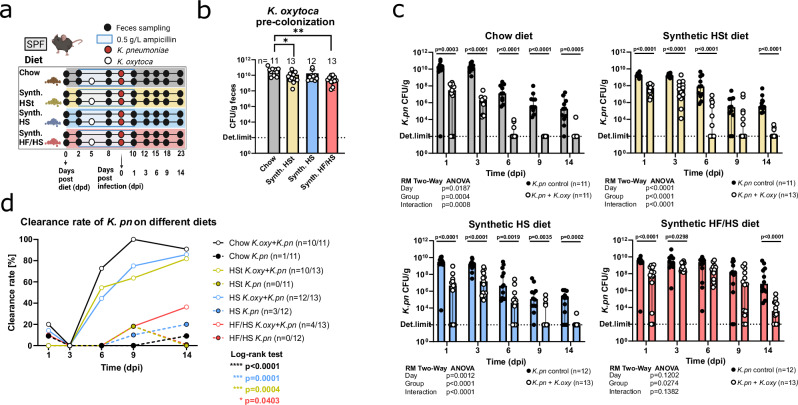
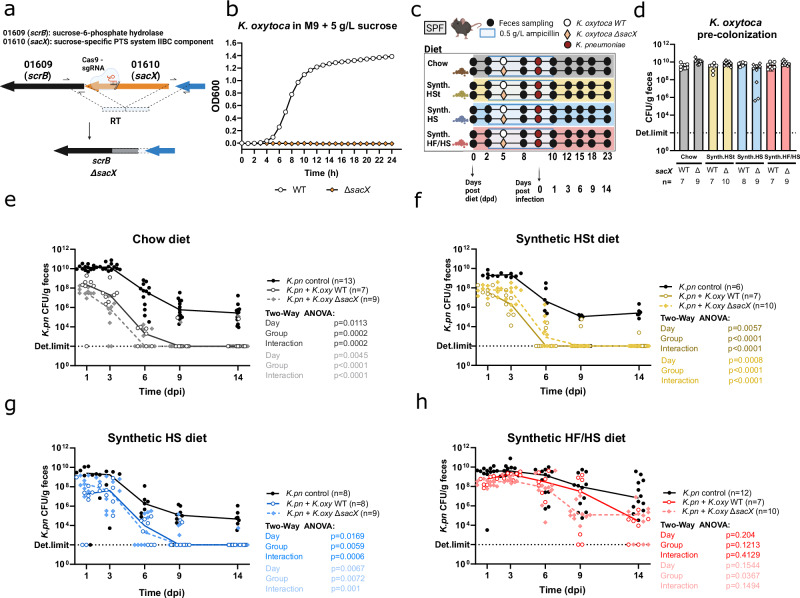
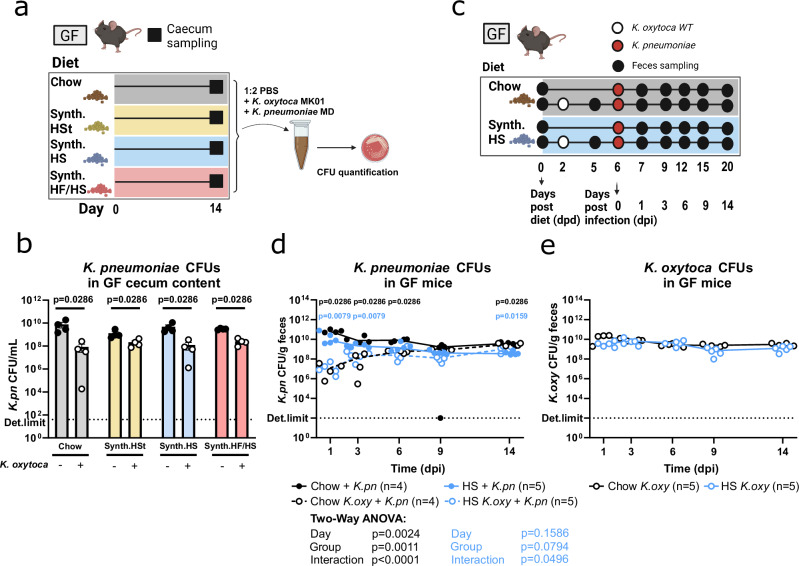
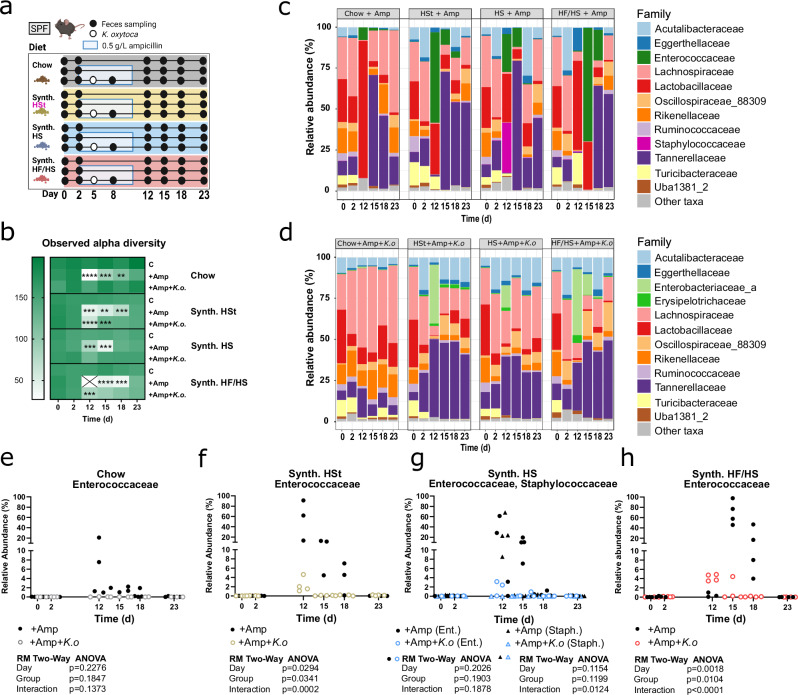
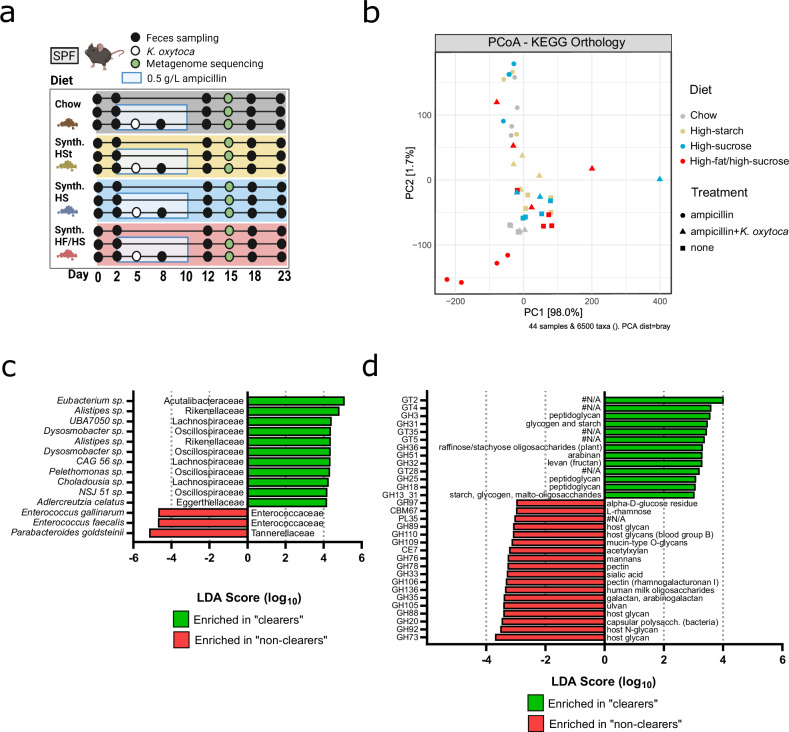
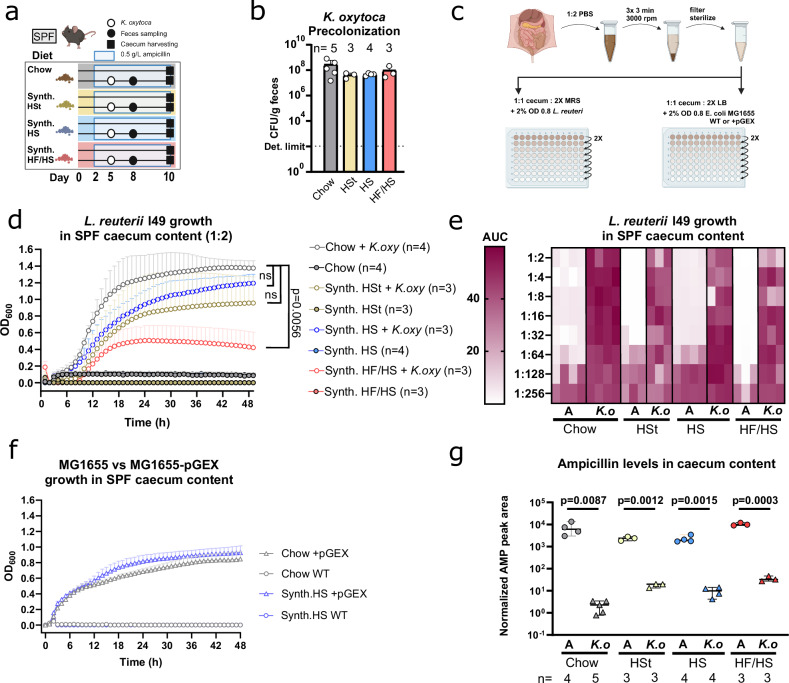
Competition among bacteria for carbohydrates is pivotal for colonization resistance (CR). However, the impact of Western-style diets on CR remains unclear. Here we show how the competition between Klebsiella oxytoca and Klebsiella pneumoniae is modulated by consuming one of three Western-style diets characterized by high-starch, high-sucrose, or high-fat/high-sucrose content. In vivo competition experiments in ampicillin-treated mice reveal that K. oxytoca promotes K. pneumoniae decolonization on all dietary backgrounds. However, mice on the high-fat/high-sucrose diet show reduced pathogen clearance. Microbiome analysis reveals that the combination of Western-style diets and ampicillin treatment synergize in microbiome impairment, particularly noticeable in the presence of high dietary fat content. The diet-independent degradation of ampicillin in the gut lumen by K. oxytoca beta-lactamases facilitates rapid commensal outgrowth, which is required for subsequent pathogen clearance. Our findings provide insights into how diet modulates functional microbiome recovery and K. oxytoca-mediated pathogen elimination from the gut.


Conflict of interest statement

Competing interests: T.S., L.O., and M.W. filed a patent for the use of K. oxytoca to decolonize MDR Enterobacteriaceae from the gut (EP4259171A1, EP4011384A1, WO002022122825A1 & US020240041950A1). The remaining authors declare no competing interests.

Figures

Fig. 1
Fig. 1. Diet modulates K. pneumoniae (K. pn) colonization dynamics and clearance is accelerated by K. oxytoca (K. oxy) colonization.
a Schematic showing the experimental setup. Mice were placed on specific diets and ampicillin, after which one group per diet received K. oxytoca inoculation orally while the other group per diet received no inoculation. All mice were challenged with K. pneumoniae on 0 dpi. b Mean K. oxytoca CFUs with SD confirming fecal colonization on − 1 dpi from three independent experiments with n = 3–6 mice/group. P-values represent ordinary one-way ANOVA analysis with Tukey’s multiple comparison test with *p < 0.05, **p < 0.01, ***p < 0.005, ****p < 0.0001. c Median K. pneumoniae CFUs with 95% CI per group per day in mice fed standard chow, semi-synthetic, semi-synthetic high-sucrose, and semi-synthetic high-fat/high-sucrose diets from three independent experiments with n = 3–6 mice/group. Bars represent group medians, and individual dots represent fecal samples collected from individual mice. Two-tailed p-values indicated at individual time points represent Mann-Whitney non-parametric rank comparison between K. oxytoca pre-colonized and non-colonized groups per day with *p < 0.05, **p < 0.01, ***p < 0.005, ****p < 0.0001. Global p-values represent a two-way repeated-measures ANOVA with Geisser-Greenhouse correction. d Clearance rates of K. pneumoniae per group per day representing the percentage of animals in each experimental group showing clearance. Number of all animals and those showing clearance are indicated in parentheses. P-values represent the Log-rank (Mantel-Cox) test with *p < 0.05, **p < 0.01, ***p < 0.001, ****p < 0.0001. Panel (a) Created with BioRender.com.
Fig. 2
Fig. 2. K. pneumoniae CFU reduction and clearance by K. oxytoca is independent of sucrose utilization.
a Schematic of the genomic locus of the sucrose-specific PTS in K. oxytoca MK01. sacX was deleted from the genome using a CRISPR-Cas9-mediated gene editing tool. b K. oxytoca WT and ΔsacX growth on minimal medium + 5 g/L sucrose represented by longitudinal OD600 values for 24 h, dots represent means of 3 technical replicates. c Schematic showing setup of animal experiment. Mice were pre-colonized with either K. oxytoca WT or ΔsacX strain. d Mean K. oxytoca CFUs with SD confirming fecal colonization one day before mice were challenged with K. pneumoniae from 2-3 independent experiments with n = 3–5 mice/group. eh CFUs of K. pneumoniae in K. oxytoca pre-colonized or non-colonized mice fed (e) standard chow, (f) semi-synthetic, (g) semi-synthetic high-sucrose or (h) semi-synthetic high-fat/high-sucrose diets from 2–3 independent experiments with n = 3–5 mice/group. Lines represent group medians. Global p-values represent a two-way repeated-measured ANOVA with Geisser-Greenhouse correction with *p < 0.05, **p < 0.01, ***p < 0.005, ****p < 0.0001. Panel (a) and (c) Created with BioRender.com.
Fig. 3
Fig. 3. K. oxytoca directly antagonizes K. pneumoniae in early infection but clearance is microbiome-dependent.
a Schematic illustrating ex vivo competition assay. Caecum content was isolated from GF mice fed one of four diets for 14 days, pooled, and used as a medium base for competition assay between K. oxytoca and K. pneumoniae. b CFUs of K. pneumoniae after 24 h of co-culturing with K. oxytoca. Dots represent the average of three technical replicates. Bars represent the mean of 4 independent experiments (n = 4) with SEM using different cultures of bacteria. Two-tailed p-values indicated represent Mann-Whitney non-parametric rank comparison with *p < 0.05, **p < 0.01, ***p < 0.005, ****p < 0.0001. c Schematic showing the experimental setup. One group of GF mice per diet was colonized with K. oxytoca while the other group per diet was left uncolonized. K. pneumoniae challenge took place four days after K. oxytoca pre-colonization, colonization levels of both bacteria were monitored for 14 days. d, e CFUs of (d) K. pneumoniae and (e) K. oxytoca from fecal samples. Lines represent group medians from one experiment with n = 4–5 mice/group. Global p-values represent a two-way repeated-measured ANOVA with Geisser-Greenhouse correction with *p < 0.05, **p < 0.01, ***p < 0.005, ****p < 0.0001. Two-tailed p-values indicated at individual time points represent Mann-Whitney non-parametric rank comparison between K. oxytoca pre-colonized and non-colonized groups per day with *p < 0.05, **p < 0.01, ***p < 0.005, ****p < 0.0001. Panel (a) and (b) Created with BioRender.com.
Fig. 4
Fig. 4. K. oxytoca colonization facilitates α-diversity recovery and prevents pathobiont outgrowth.
a Schematic showing the experimental setup. All mice were switched to one of four diets on day 0. Two days later, two groups on each diet began ampicillin treatment while one group per diet was left untreated. On day 5, one ampicillin-treated group was colonized with K. oxytoca while the other ampicillin-treated group received no bacterial inoculation. Fecal samples were collected on the indicated days. b Heatmap depicting fecal microbiota α-diversity represented by the number of observed OTUs from one experiment with n = 3–4 mice/group. P-values represent multiple unpaired t tests with the Holm-Sidak method with *p < 0.05, **p < 0.01, ***p < 0.005, ****p < 0.0001 comparing the ampicillin-treated groups to the untreated control on each diet. Further details about SE of difference, t ratio, degree of freedom, and adjusted p-values can be found in the Source Data file. c, d Relative abundances of the 12 most abundant families shown as group average for mice treated with ampicillin (c) without and (d) with subsequent K. oxytoca colonization. eh Longitudinal changes in the relative abundances of families (e, g) Enterococcaceae and (f, h) Staphylococcaceae (e, f) without and (g, h) with K. oxytoca pre-colonization. Colors represent different diets, dots represent individual mice. Panel (a) Created with BioRender.com.
Fig. 5
Fig. 5. Metagenome sequencing reveals diet-specific delays in microbiome recovery in mice fed HF/HS diet on day 15.
a Schematic showing the experimental setup. All mice were switched to one of four diets on day 0. Two days later, two groups on each diet began ampicillin treatment while one group per diet was left untreated. On day 5, one ampicillin-treated group was colonized with K. oxytoca while the other ampicillin-treated group received no bacterial inoculation. Fecal samples were collected for metagenome sequencing on 15 dpd. b PCoA plot calculated by Bray-Curtis distances of annotated KEGG functional modules in fecal samples collected on day 15 from mice either untreated, ampicillin treated or ampicillin treated and K. oxytoca colonized from one experiment with n = 3–4 mice/group. c, d Analysis of differentially abundant (c) bacterial taxa (from de novo generated MAG profiles) and (d) carbohydrate-active enzymes (CAZymes) in mice that show K. pneumoniae clearance versus mice that show no clearance by LEfSe. Panel (a) Created with BioRender.com.
Fig. 6
Fig. 6. Ampicillin degradation by K. oxytoca facilitates Limosilactobacillus reuteri outgrowth in a diet-dependent manner.
a Schematic showing in vivo experimental setup. b Fecal colonization was confirmed by CFU quantification on day 8. c Schematic showing ex vivo growth assays. In brief, isolated caecum contents (n = 3–4 mice/group) were diluted with 2X volume of PBS, after which they were centrifuged in three consecutive steps, removing the supernatant each time. Final supernatants were filtered using a 0.22 µm filter and serially diluted with PBS. 2X MRS and 2X LB were supplemented to support the growth of L. reuteri I49 and E. coli MG1655, respectively. d L. reuteri I49 growth in a mixture of (ratio 1:1) caecum content supernatants and MRS (final concentration: 1x) for 48 h. Displayed growth curves represent the mean of three-four biological replicates with standard deviation. P-values on the right side represent Kruskal Wallis test with Dunn’s multiple comparisons of the biological replicates in each condition at 48 h with *p < 0.05, **p < 0.01, ***p < 0.005, ****p < 0.0001 (e) Heatmap depicting L. reuteri I49 growth represented by area under the curve (AUC) measurements after 48 h in a mixture of (ratio 1:1) caecum content supernatants and MRS (final concentration: 1x). f E. coli MG1655 growth in a mixture of caecum content supernatants and LB (final concentration 1:1) for 48 h. Displayed growth curves represent three biological replicates with standard deviation. g Weight-normalized AMP peak areas determined in cecal extracts of mice (n = 3–4 mice/group) treated with ampicillin and mice treated with ampicillin and colonized with K. oxytoca fed different diets. Data are displayed as individual biological replicates (mean of double injection), and bars indicate the median with 95% confidence intervals. The indicated two-tailed p-values represent unpaired t test with *p < 0.05, **p < 0.01, ***p < 0.005, ****p < 0.0001. Panel (a) and (c) Created with BioRender.com.

References

    1. Lawley, T. D. & Walker, A. W. Intestinal colonization resistance. Immunology138, 1–11 (2013). - DOI - PMC - PubMed
    1. Caballero-Flores, G., Pickard, J. M. & Núñez, G. Microbiota-mediated colonization resistance: mechanisms and regulation. Nat. Rev. Microbiol.21, 347–360 (2023). - DOI - PMC - PubMed
    1. Buffie, C. G. et al. Precision microbiome reconstitution restores bile acid mediated resistance to Clostridium difficile. Nature517, 205–208 (2015). - DOI - PMC - PubMed
    1. Sassone-Corsi, M. et al. Microcins mediate competition among Enterobacteriaceae in the inflamed gut. Nature540, 280–283 (2016). - DOI - PMC - PubMed
    1. Litvak, Y., Byndloss, M. X. & Bäumler, A. J. Colonocyte metabolism shapes the gut microbiota. Science362, eaat9076 (2018). - DOI - PMC - PubMed

MeSH terms

LinkOut - more resources