. 2025 Jan 9;16(1):524.
doi: 10.1038/s41467-024-55738-1.

Alleviation of liver fibrosis by inhibiting a non-canonical ATF4-regulated enhancer program in hepatic stellate cells

Affiliations

Alleviation of liver fibrosis by inhibiting a non-canonical ATF4-regulated enhancer program in hepatic stellate cells

Li-Xian Yang et al. Nat Commun. .

Abstract

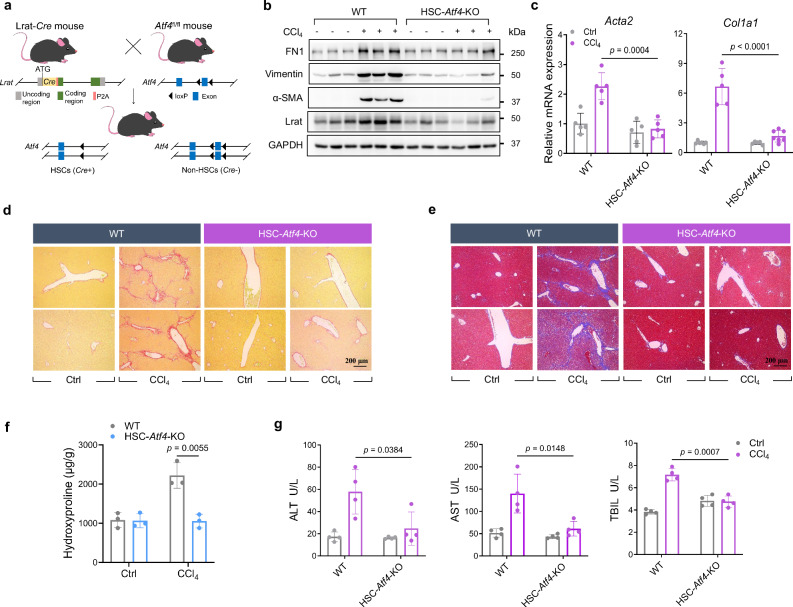
Liver fibrosis is a critical liver disease that can progress to more severe manifestations, such as cirrhosis, yet no effective targeted therapies are available. Here, we identify that ATF4, a master transcription factor in ER stress response, promotes liver fibrosis by facilitating a stress response-independent epigenetic program in hepatic stellate cells (HSCs). Unlike its canonical role in regulating UPR genes during ER stress, ATF4 activates epithelial-mesenchymal transition (EMT) gene transcription under fibrogenic conditions. HSC-specific depletion of ATF4 suppresses liver fibrosis in vivo. Mechanistically, TGFβ resets ATF4 to orchestrate a unique enhancer program for the transcriptional activation of pro-fibrotic EMT genes. Analysis of human data confirms a strong correlation between HSC ATF4 expression and liver fibrosis progression. Importantly, a small molecule inhibitor targeting ATF4 translation effectively mitigates liver fibrosis. Together, our findings identify a mechanism promoting liver fibrosis and reveal new opportunities for treating this otherwise non-targetable disease.


Conflict of interest statement

Competing interests: The authors declare no competing interests.

Figures

Fig. 1
Fig. 1. ATF4 governs gene expression in a signal-dependent manner.
a–c RNA-seq was conducted on the HMLE cells transduced with a scramble shRNA (shCtrl) or an ATF4-targeted shRNA (shATF4) and treated with indicated conditions (Twist-OE, Twist overexpression; Tg, thapsigargin). a A heatmap showing the expression of genes that were downregulated by ATF4 knockdown and ranked in the top 2.5% under Twist-OE or Tg treatment, respectively. b GO (gene ontology) enrichment analysis for genes downregulated by ATF4 knockdown for more than 1.5-fold in Tg treatment. A list of top enriched genesets (upper panel) and a GSEA (gene set enrichment analysis) plot showing the enrichment of the unfolded protein response pathway (lower panel) were shown. Hypergeometric test was used to identify significant enrichment pathways (P < 0.01). The statistical significance (nominal P value) of the normalized enrichment score (NES) was generated by employing an empirical phenotype-based permutation test. c GO enrichment analysis for genes downregulated by ATF4 knockdown for more than 1.5-fold when Twist was induced. A list of top enriched genesets (upper panel) and a GSEA plot showing the enrichment of the epithelial-mesenchymal transition pathway (lower panel) were shown. Hypergeometric test was used to identify significant enrichment pathways (P < 0.01). The statistical significance (nominal P value) of the normalized enrichment score (NES) was generated by employing an empirical phenotype-based permutation test procedure. d–f RNA-seq was conducted on the LX-2 cells transduced with a scramble shRNA (shCtrl) or an ATF4-targeted shRNA (shATF4) and treated with indicated conditions. Similar analyses were conducted as in (ac). Hypergeometric distribution tests were applied for GO enrichment analysis and weighted Kolmogorov–Smirnov tests were applied for GSEA. These analyses were conducted on the average data of two biological replicates.
Fig. 2
Fig. 2. ATF4 is required for the induction of EMT in epithelial cells.
The HMLE cell line was transduced with a scramble (shCtrl) or two ATF4-targeted shRNAs (shATF4-1 and shATF4-2). The EMT program of the HMLE cells was triggered by 4-hydroxytamoxifen (4-OHT)-mediated nuclear translocation of a Twist-ER fusion protein (see methods for details). a Western blots showing the expression of EMT marker genes in HMLE-shCtrl and HMLE-shATF4 cells treated with increasing concentrations of 4-OHT for 10 days. The experiment was repeated three times. b Calcein-AM staining showing the morphology of HMLE-shCtrl and HMLE-shATF4 cells treated with 4-OHT for 10 days. Representative fluorescence images (left) and quantitative analysis of disassociated cells (right) were shown (n = 10 images derived from 3 biological replicates). c Migratory ability of HMLE-shCtrl and HMLE-shATF4 cells treated with 4-OHT was gauged by a transwell assay. Representative images of Calcein-AM labeled cells passed through transwell chambers (left) and quantitative analysis (right) were shown (n = 10 images derived from 3 biological replicates). d Representative flow cytometry plots showing the distribution of CD24loCD44hi cells in HMLE-shCtrl and HMLE-shATF4 cells treated with or without 4-OHT for 10 days (left), and quantification analysis of the flow cytometry assay (right) (n = 3 biological replicates). Data are presented as mean ± s.e.m and representative of at least three independent experiments. Unpaired, two-tailed Student’s t tests were applied for (bd). Source data are provided as a Source Data file.
Fig. 3
Fig. 3. ATF4 positively regulates EMT program in HSCs and is required for HSC activation.
a Western blots showing the expression of mesenchymal marker genes in LX-2-shCtrl and LX-2-shATF4 cells treated with or without TGFβ for 2 days. The experiment was repeated four times. b Western blots showing the expression of mesenchymal marker genes in LX-2 cells treated with or without ISRIB (1 mM) and TGFβ (0, 1, and 5 ng/ml). The experiment was repeated three times. c Western blots showing the expression of mesenchymal marker genes in LX-2 cells overexpressing ATF4 treated with or without increasing concentrations of TGFβ (0, 0.5, 1, and 5 ng/ml) for 2 days. The experiment was repeated three times. d qPCR analysis of mesenchymal marker genes mRNA expression in LX-2 cells overexpressing ATF4 treated with or without increasing concentrations of TGFβ (0, 0.5, 1, and 5 ng/ml) for 2 days (n = 4 biological replicates). e Western blot showing the expression of fibrotic genes in LX-2-shCtrl and LX-2-shATF4 cells treated with increasing concentrations of TGFβ (0, 5, and 10 ng/ml) for 2 days. The experiment was repeated four times. f qPCR analysis of mRNA expression of fibrotic genes in LX-2-shCtrl and LX-2-shATF4 cells treated with TGFβ for 2 days (n = 3 biological replicates). g qPCR analysis of mRNA expression of fibrotic genes in LX-2 cells overexpressing ATF4 for 4 days and then treated with increasing concentrations of TGFβ (0, 0.5, and 1 ng/ml) for 2 days (n = 4 biological replicates). h qPCR analysis of mRNA expression of fibrotic genes in LX-2 cells treated with solvent control (Ctrl), TGFβ (5 ng/ml) for 2 days (TGFβ), or pretreated with ISRIB (1 mM) for 3 days followed by treatment with TGFβ (5 ng/ml) and ISRIB (1 mM) for another 2 days (TGFβ + ISRIB) (n = 3 biological replicates). Data are presented as mean ± s.e.m and representative of at least three independent experiments. Unpaired, two-tailed Student’s t tests were applied for (d) and (fh). Source data are provided as a Source Data file.
Fig. 4
Fig. 4. HSC-specific depletion of Atf4 alleviates liver fibrosis in vivo.
8-week-old male Lrat-Cre-/-;Atf4fl/fl (WT) and Lrat-Cre+/-;Atf4fl/fl (HSC-Atf4-KO) littermates were administrated with CCl4 (0.5 ml/kg) or solvent control (corn oil) twice weekly for 5 weeks, n = 5–7 mice per group. a A schematic of the design of Lrat-Cre+/–;Atf4fl/fl (HSC-Atf4-KO) mice. b Western blots showing the expression of EMT and fibrotic marker genes in the liver tissues of the WT and HSC-Atf4-KO mice. The experiment was repeated three times. c qPCR analysis showing the expression of fibrotic marker genes in the liver tissues of (b) (n = 5 samples per group). Panels (d, e) representative images of Sirius red staining and Masson’s trichrome staining for liver tissues of (b) (n = 6 images derived from 3 mouse livers per group). f Hepatic collagen content of the liver tissues of (d) was determined by hydroxyproline quantification (n = 3 samples per group). g, Serum levels of ALT, AST, and TBIL from the experimental animals of (b) were measured (n = 4 samples per group). Data are presented as mean ± s.e.m. Unpaired, two-tailed Student’s t tests were applied for (c, f, g). Source data are provided as a Source Data file.
Fig. 5
Fig. 5. The landscape of ATF4 and H3K27ac chromatin binding during HSC activation and ER stress.
a The genome-wide distribution of ATF4 binding peaks under TGFβ (TGFβ-ATF4) or Tg (Tg-ATF4) treatment. b GO enrichment analysis for genes that are closest to ATF4 binding sites under TGFβ or Tg treatment, respectively. Top enriched pathways were shown. Hypergeometric test was used to identify significant enrichment pathways (P < 0.01). c DNA-binding motifs of ATF4 under TGFβ or Tg treatment were identified by HOMER. The Top three enriched motifs were shown. d Venn diagram summarizing the number of peaks identified by ATF4 and H3K27ac ChIP-seq under TGFβ treatment. e The heatmap of normalized ChIP-seq signal of ATF4 and H3K27ac and input in three groups: TGFβ-specific ATF4 binding sites, TGFβ/Tg shared ATF4 binding sites, or Tg-specific ATF4 binding sites (from top to bottom). f Left panel: the distribution of ATF4 binding peaks overlapped with super-enhancers (SE), typical enhancers (TE), or other types of H3K27ac-marked elements (others) under TGFβ treatment. Right panel: the statistical significance of enrichment of the EMT pathway by using genes driven by SE or TE with ATF4 binding (ATF4-SE or ATF4-TE). g Left panel: the distribution of ATF4 binding peaks overlapped with super-enhancers (SE), typical enhancers (TE), or other types of H3K27ac-marked elements (others) under Tg treatment. Right panel: the statistical significance of enrichment of the UPR pathway by using genes driven by TE with ATF4 binding (ATF4-TE); the UPR pathway was not enriched by genes driven by SE with ATF4 binding (ATF4-SE).
Fig. 6
Fig. 6. ATF4 promotes the transcription of fibrotic genes via enhancer-dependent mechanisms.
a The snapshots of normalized ATF4 and H3K27ac and input ChIP-seq tracks at COL1A1 and LOXL2 loci across different conditions: Ctrl, TGFβ, and Tg treatment. The super-enhancers with ATF4 binding sites were highlighted in gray rectangles. The black arrows indicate the binding loci of ATF4, which were adopted for the ChIP-qPCR test. b ChIP-qPCR analysis showing the recruitment of ATF4 in the corresponding regions of COL1A1 and LOXL2 in the presence of solvent control, TGFβ, or combined TGFβ and JQ1 (n = 3 biological replicates). c A luciferase reporter containing a genomic region upstream of the COL1A1 gene (–9108 to –8708) was constructed to measure the transcriptional activity of the ATF4- and H3K27ac- co-bound regions. The COL1A1 reporter, along with a Renilla luciferase reporter, was transfected into LX-2 cells transduced with a control vector (Vec) or an ATF4-overexpression construct (ATF4-OE). The transfected cells were treated with solvent control, TGFβ (1 ng/ml) for 2 days, JQ1 (250 nM) for 12 h, or a combination of TGFβ (1 ng/ml) for 2 days and JQ1 (250 nM) for 12 h before they were analyzed by the Dual-Luciferase assay (n = 4 biological replicates). d qPCR analysis showing the expression of COL1A1 and LOXL2 in control or LX-2 cells overexpressing ATF4 treated with solvent control, TGFβ, JQ1, or a combination of TGFβ and JQ1 (n = 4 biological replicates). Data are presented as mean ± s.e.m and representative of at least three independent experiments. Unpaired, two-tailed Student’s t tests were applied for (b–d). Source data are provided as a Source Data file.
Fig. 7
Fig. 7. Pharmacological inhibition of eIF2α-ATF4 alleviates liver fibrosis.
a 8-week-old male C57BL/6 mice were administered with CCl4 (0.5 ml/kg) or solvent control (corn oil) and simultaneously with or without ISRIB (5 mg/kg) twice weekly for 5 weeks. n = 5–7 mice per group. Western blots showing the expression of EMT and fibrotic marker genes in the liver tissues of mice with different treatments. The experiment was repeated three times. b qPCR analysis showing the expression of fibrotic genes in hepatocytes and HSCs isolated from the liver tissues from (a) (n = 3 biological replicates). c The representative images of Sirius red staining for liver tissues of (a) (n = 6 images derived from 3 mouse livers per group). d The hepatic collagen content of the liver tissues of (a) was determined by hydroxyproline quantification (n = 4 biological replicates). e 8-week-old male C57BL/6 mice underwent a sham (Sham) operation or surgery of common bile duct ligation (BDL), followed by biweekly administration of ISRIB (5 mg/kg) or solvent control for 4 weeks (n = 5 mice per group). Western blots showing the expression of EMT and fibrotic marker genes in the liver tissues of mice with different treatments. The experiment was repeated three times. f 8-week-old male C57BL/6 mice were administered with solvent control, TAA (150 mg/kg), or a combination of TAA and ISRIB (5 mg/kg) twice weekly for 5 weeks (n = 5 mice per group). Western blots showing the expression of EMT and fibrotic marker genes in the liver tissues of mice with different treatments. The experiment was repeated three times. g The hepatic collagen content of the liver tissues of e was determined by hydroxyproline quantification (n = 4 samples per group). h The hepatic collagen content of the liver tissues of (f) was determined by hydroxyproline quantification (n = 5 samples per group). i t-SNE representation of scRNA-seq analysis of HSCs from human liver of healthy donors (n = 5) and cirrhotic patients (n = 5). Cells from healthy or cirrhotic samples are highlighted in cyan or red, respectively. (adapted from GSE136103). j Violin plot showing the mRNA expression of ATF4 in HSCs of (i). k GSEA was performed with two genesets of ATF4 targets in a data set where genes were ordered by the fold-change of their expression comparing the HSCs of the cirrhotic patients and the healthy donors of (i). The geneset “ATF4 targets under TGFβ” (left) refers to genes regulated by ATF4 under TGFβ treatment in the LX-2 cells originating from the above bulk RNA-seq; The geneset “ATF4 targets under Tg” (right) refers to genes regulated by ATF4 under Tg treatment in the LX-2 cells also originated from the above bulk RNA-seq. The statistical significance (nominal P value) of the normalized enrichment score (NES) was generated by employing an empirical phenotype-based permutation test. l Spearman correlation of the Fib-4 scores and the expression of ATF4 in HSCs in the liver tissue from 15 cirrhotic patients. Determined by the intensity of IHC staining, the ATF4 expression in HSCs in these tissues was put into four categories: negative (1), low (2), medium (3), and high (4). Data are presented as mean ± s.e.m. Unpaired, two-tailed Student’s t tests were applied for (b, d, g, h, j). Kolmogorov–Smirnov tests were applied for (k). Spearman’s correlation was applied for (l). Source data are provided as a Source Data file.

References

    1. Hernandez-Gea, V. & Friedman, S. L. Pathogenesis of liver fibrosis. Annu Rev. Pathol.6, 425–456 (2011). - PubMed
    1. Kisseleva, T. & Brenner, D. Molecular and cellular mechanisms of liver fibrosis and its regression. Nat. Rev. Gastroenterol. Hepatol.18, 151–166 (2021). - PubMed
    1. Cotter, T. G. & Rinella, M. Fatty liver disease 2020: The state of the disease. Gastroenterology158, 1851–1864 (2020). - PubMed
    1. Schwabe, R. F., Tabas, I. & Pajvani, U. B. Mechanisms of fibrosis development in nonalcoholic steatohepatitis. Gastroenterology158, 1913–1928 (2020). - PMC - PubMed
    1. Parola, M. & Pinzani, M. Liver fibrosis: Pathophysiology, pathogenetic targets and clinical issues. Mol. Asp. Med.65, 37–55 (2019). - PubMed

MeSH terms

Substances

LinkOut - more resources