

Co-profiling of single-cell gene expression and chromatin landscapes in stickleback pituitary
- PMID: 39789025
- PMCID: PMC11718312
- DOI: 10.1038/s41597-025-04376-3
Co-profiling of single-cell gene expression and chromatin landscapes in stickleback pituitary
Abstract
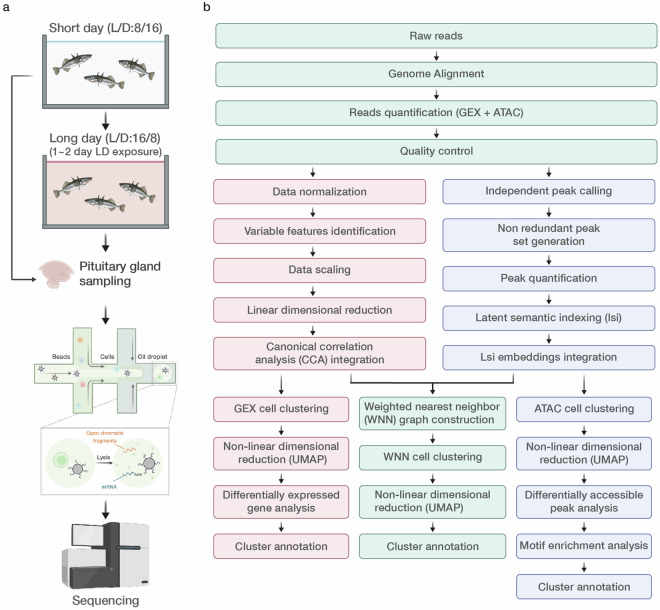
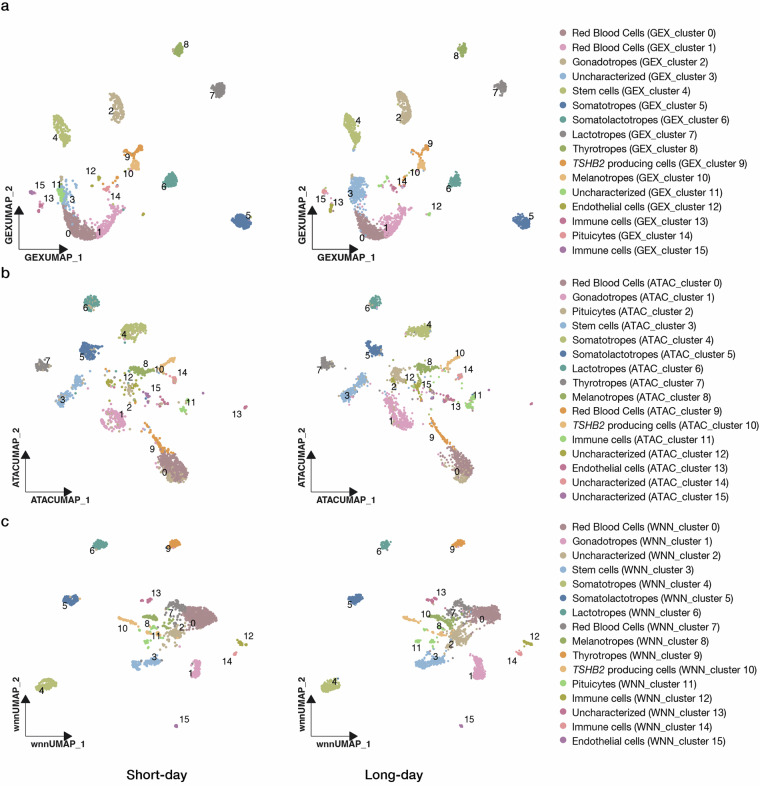
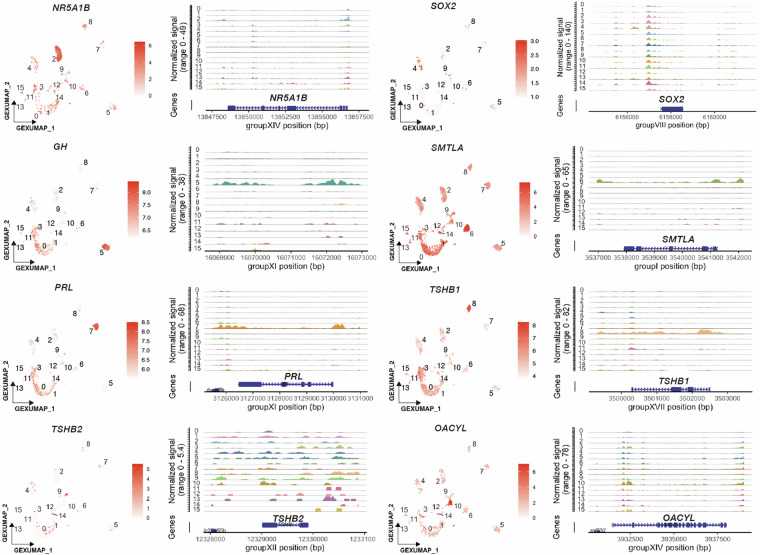
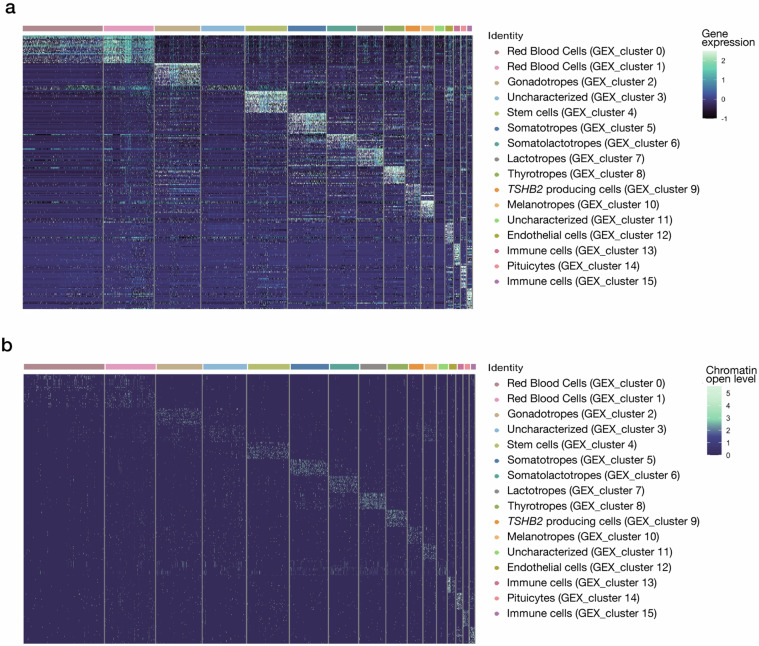
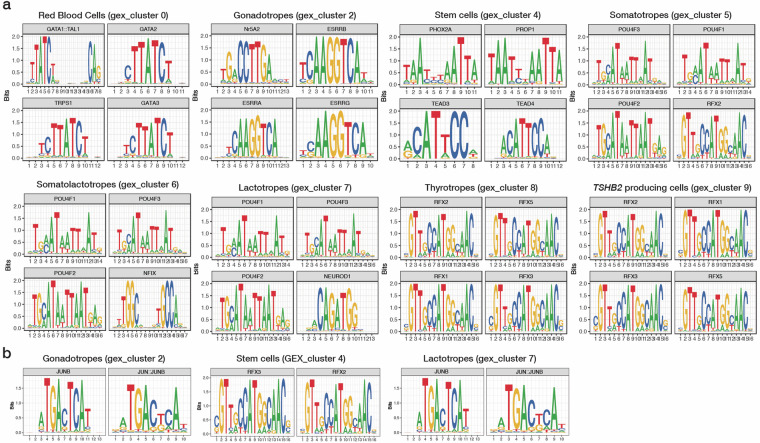
The pituitary gland is a key endocrine gland with various physiological functions including metabolism, growth, and reproduction. It comprises several distinct cell populations that release multiple polypeptide hormones. Although the major endocrine cell types are conserved across taxa, the regulatory mechanisms of gene expression and chromatin organization in specific cell types remain poorly understood. Here, we performed simultaneous profiling of the transcriptome and chromatin landscapes in the pituitary cells of the three-spined stickleback (Gasterosteus aculeatus), which represents a good model for investigating the genetic mechanisms underlying adaptive evolution. We obtained pairwise gene expression and chromatin profiles for 5184 cells under short- and long-day conditions. Using three independent clustering analyses, we identified 16 distinct cell clusters and validated their consistency. These results advance our understanding of the regulatory dynamics in the pituitary gland and provide a reference for future research on comparative physiology and evolutionary biology.
© 2025. The Author(s).
Conflict of interest statement
Competing interests: The authors declare no competing interests.
Figures
Similar articles
-
Computational identification of miRNAs, their targets and functions in three-spined stickleback (Gasterosteus aculeatus).Mol Ecol Resour. 2014 Jul;14(4):768-77. doi: 10.1111/1755-0998.12223. Epub 2014 Feb 10. Mol Ecol Resour. 2014. PMID: 24400739
-
Genomic divergence between nine- and three-spined sticklebacks.BMC Genomics. 2013 Nov 5;14(1):756. doi: 10.1186/1471-2164-14-756. BMC Genomics. 2013. PMID: 24188282 Free PMC article.
-
Measuring the immune system of the three-spined stickleback - investigating natural variation by quantifying immune expression in the laboratory and the wild.Mol Ecol Resour. 2016 May;16(3):701-13. doi: 10.1111/1755-0998.12497. Epub 2015 Dec 21. Mol Ecol Resour. 2016. PMID: 26646722 Free PMC article.
-
Diversity in reproductive seasonality in the three-spined stickleback, Gasterosteus aculeatus.J Exp Biol. 2020 Feb 7;223(Pt Suppl 1):jeb208975. doi: 10.1242/jeb.208975. J Exp Biol. 2020. PMID: 32034046 Review.
-
Nine-spined stickleback (Pungitius pungitius): an emerging model for evolutionary biology research.Ann N Y Acad Sci. 2013 Jun;1289:18-35. doi: 10.1111/nyas.12089. Epub 2013 Mar 29. Ann N Y Acad Sci. 2013. PMID: 23550583 Review.
References
-
- Rahmad Royan, M. et al. Functional and developmental heterogeneity of pituitary lactotropes in medaka. Gen. Comp. Endocrinol.330, 114144 (2023). - PubMed
Publication types
MeSH terms
Substances
Grants and funding
LinkOut - more resources
Full Text Sources
