. 2025 Jan 9;15(1):1452.
doi: 10.1038/s41598-024-77642-w.

Unveiling the molecular mechanisms of recurrent miscarriage through endoplasmic reticulum stress related gene expression

Affiliations

Unveiling the molecular mechanisms of recurrent miscarriage through endoplasmic reticulum stress related gene expression

Xiaodan Yin et al. Sci Rep. .

Abstract

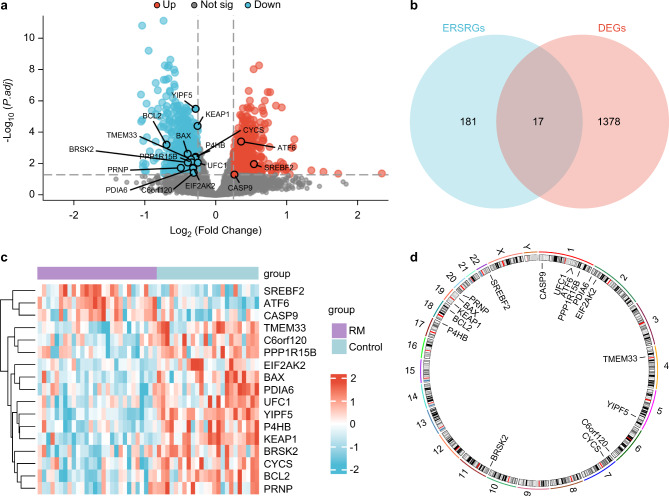
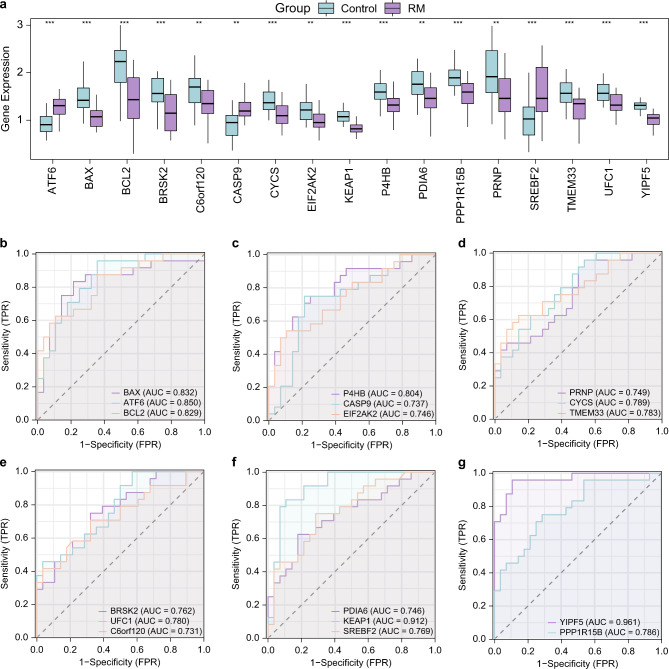
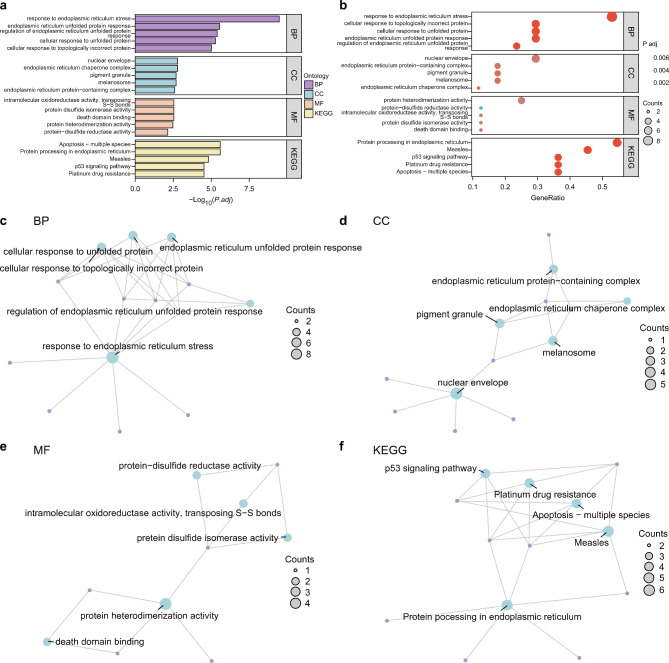
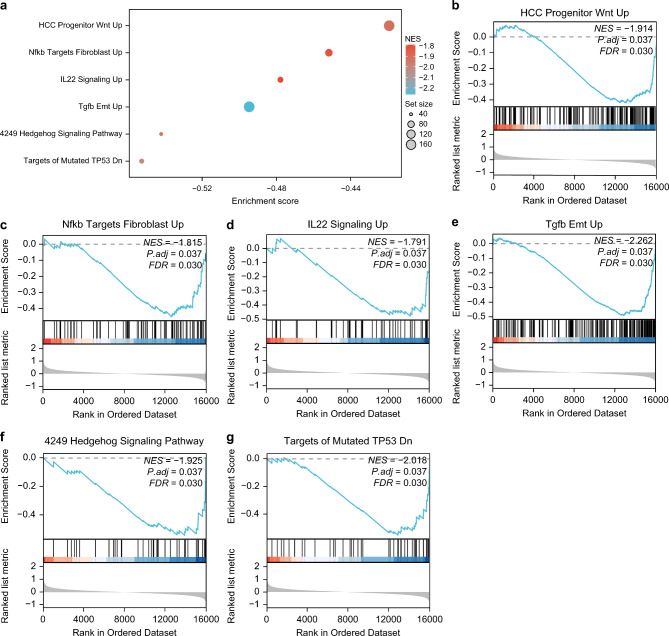
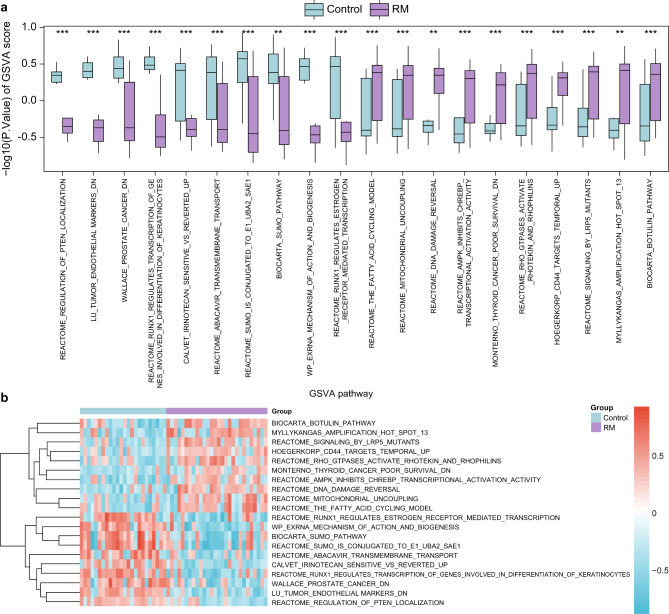
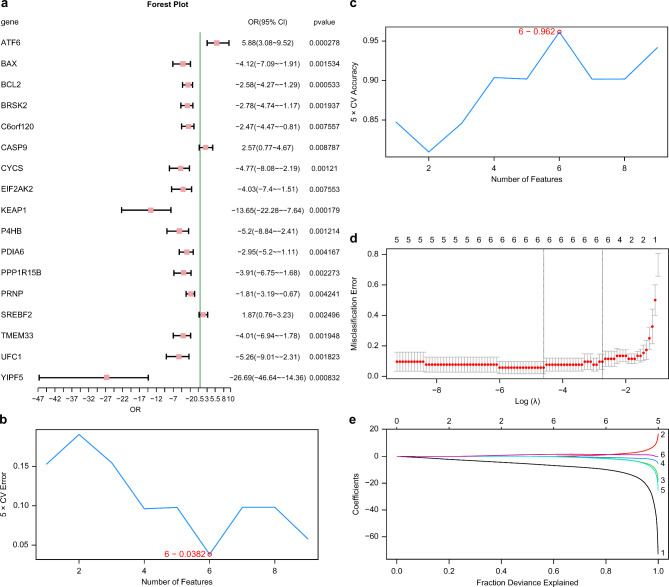
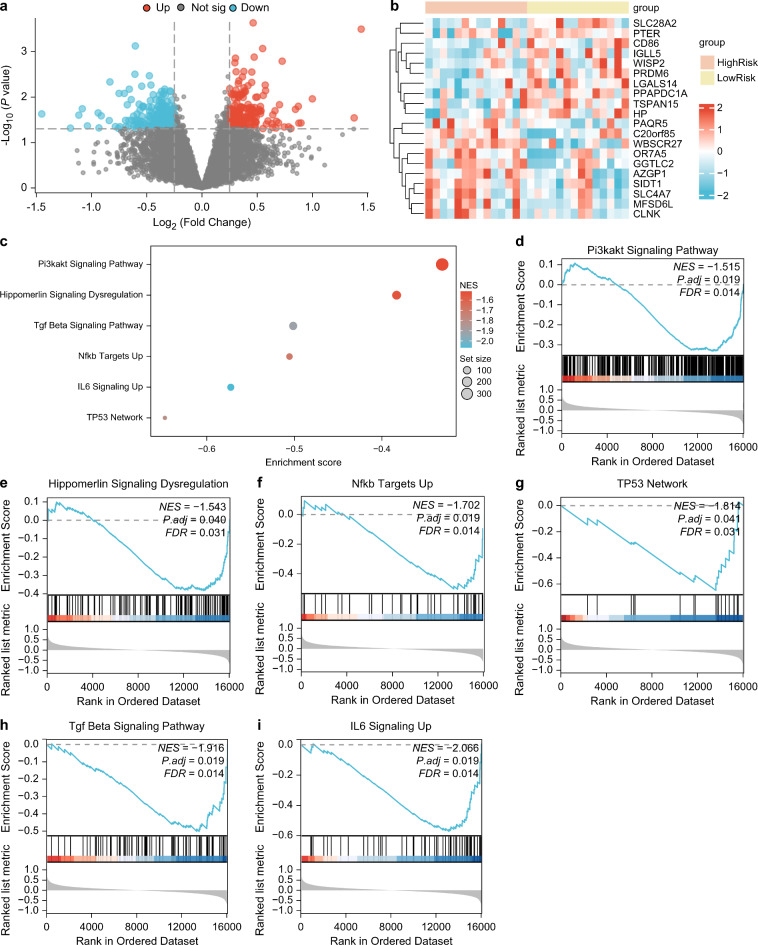
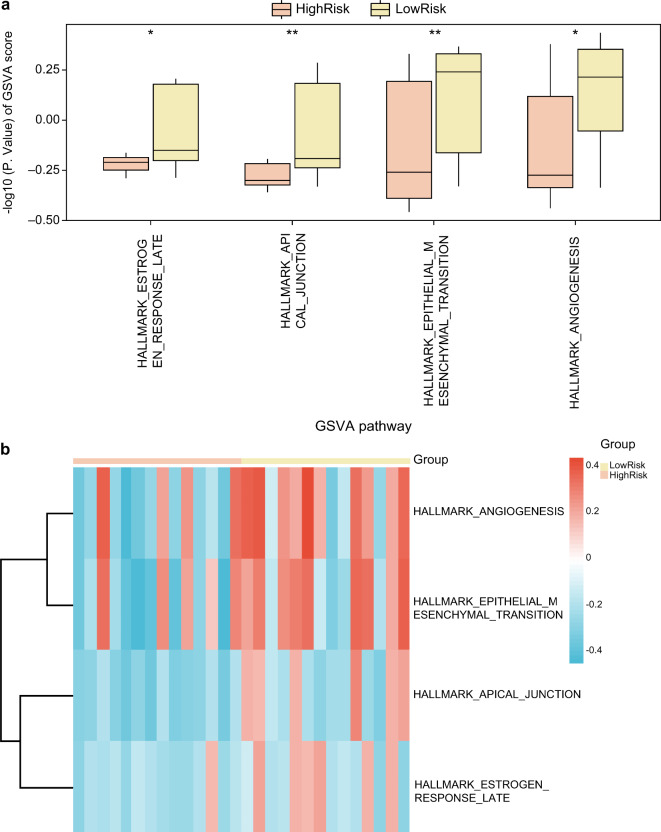
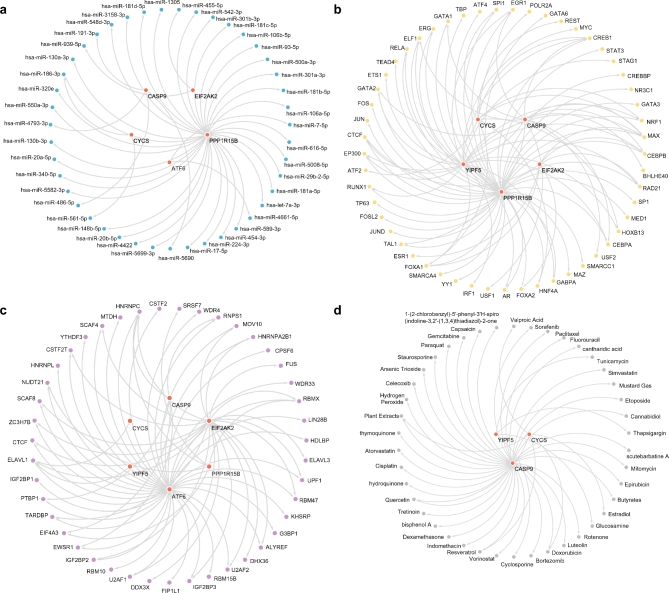
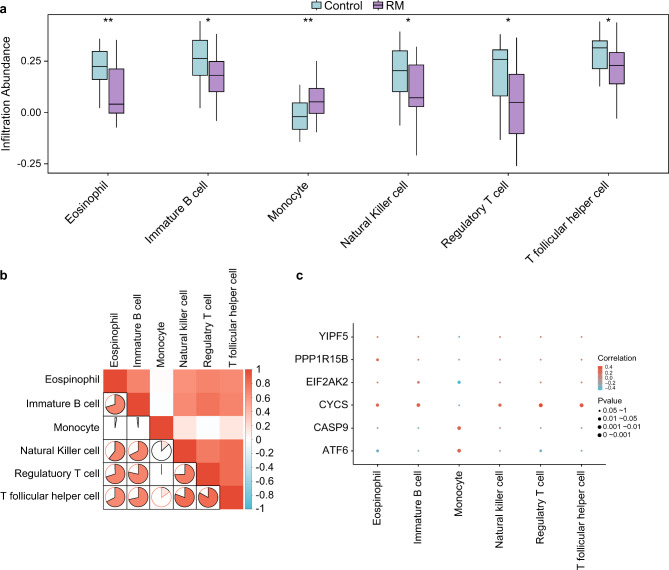
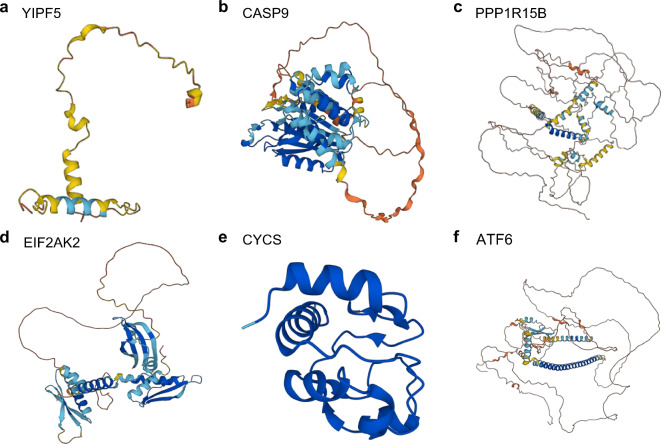
Recurrent miscarriage (RM) is a reproductive disorder affecting couples worldwide. The underlying molecular mechanisms remain elusive, even though emerging evidence has implicated endoplasmic reticulum stress (ERS). We investigated RM- and ERS-related genes to develop a diagnostic model that can enhance predictive ability. We utilized the R package GEO query to extract and process Gene Expression Omnibus data, applying batch correction, normalization, and differential gene expression analysis with limma. ERS-related differentially expressed genes (ERSRGs) were identified through Gene Ontology and Kyoto Encyclopedia of genes and genomes analyses, and their diagnostic potential was assessed. Diagnostic models were developed using logistic regression, support vector machines, and least absolute shrinkage and selection operators, complemented by immune infiltration analysis and regulatory network construction. Integrated analysis revealed 1395 differentially expressed genes (DEGs), including 626 upregulated and 769 downregulated genes. Seventeen ERSRGs were identified. KEAP1 and YIPF5 displayed high diagnostic accuracy (area under the curve [AUC] > 0.9). Gene Ontology and Kyoto Encyclopedia of genes and genomes analyses highlighted the role of ESRDEGs in cellular responses to ERS, protein processing, and apoptosis. Diagnostic models demonstrated robust predictive performance (AUC > 0.9). A molecular interaction was found between RM and the ERS response, and the identified ESRDEGs could serve as potential biomarkers for diagnosis.

Keywords: Bioinformatics; Diagnostic model; Endoplasmic reticulum stress; Immune Infiltration; Recurrent miscarriage.


Conflict of interest statement

Declarations. Competing interests: The authors declare no competing interests.

Figures

Fig. 1
Fig. 1
Differential gene expression analysis. (a) Analysis of DEGs in the combined GEO datasets between RM and control groups using volcano plots. (b) DEGs and ERSRGs in the combined GEO datasets are shown in a Venn diagram. (c) Heat map of ERSRDEGs in combined GEO dataset. (d) Chromosomal mapping of ERSRDEGs. Purple represents the RM group, and blue represents the control group.
Fig. 2
Fig. 2
Differential expression validation and ROC curve analysis. (a) Comparison of ERSRDEGs in RM and control groups of combined GEO datasets. (b–g) ROC curves of ERSRDEGs in combined GEO dataset. ** represents p-value < 0.01, highly statistically significant; *** represents p-value < 0.001 and highly statistically significant. AUC > 0.9 had high accuracy, and AUC 0.7–0.9 had moderate accuracy. The RM group is shown in purple, and the control group is shown in blue.
Fig. 3
Fig. 3
GO and KEGG enrichment analysis for ERSRDEGs. (a) ERSRDEG enrichment analysis according to GO and KEGG pathways. (b) Bubble diagram of GO and KEGG enrichment analysis results for ERSRDEGs. (c–f) GO and KEGG enrichment analysis results of the ERSRDEGs network diagram showing BP (c), CC (d), MF (e), and KEGG (f). Blue nodes represent items, purple nodes represent molecules, and lines represent relationships between items and molecules. Screening criteria for GO and KEGG enrichment analyses were adjusted to p < 0.05, FDR value (q value) < 0.25, and Benjamini–Hochberg (BH) was used as the correction method. Source: KEGG database Project, Kanehisa Laboratories, Ref. No.: 240,567
Fig. 4
Fig. 4
GSEA for combined datasets. (a) Gene set enrichment analysis (GSEA) 6 biological functions bubble plot presentation of combined GEO dataset. (b–g) GSEA showed that genes from the combined GEO dataset were significantly enriched in HCC Progenitor Wnt Up (b), Nfkb Targets Fibroblast Up (c), IL22 Signaling Up (d), Tgfb Emt Up (e), 4249 Hedgehog Signaling Pathway (f), Targets of Mutated TP53 Dn (g). The screening criteria of GSEA were adj.p < 0.05 and FDR value (q value) < 0.25, and the p-value correction method was BH.
Fig. 5
Fig. 5
GSVA for combined datasets. Boxplot (a) and heat map (b) of group comparison of GSVA results in RM and control. ** represents p-value < 0.01, highly statistically significant; *** represents p-value < 0.001 and highly statistically significant. Screening criteria for GSVA were adj. p < 0.05, positive or negative top10 logFC, and the p-value correction method was BH. The RM group is purple, and the control group is blue.
Fig. 6
Fig. 6
Diagnostic model of RM. (a) Logistic regression model for 17 ERSRDEGs included in RM diagnostic model. (b, c) Number of genes with the lowest error rate (b) and highest accuracy (c) determined by the SVM algorithm. (d, e) LASSO regression model diagnostic plots (d) and variable trajectory plots ( e).
Fig. 7
Fig. 7
GSEA for risk group. (a) Volcano plot of DEGs analysis in high-risk and low-risk groups of RM samples. (b) Heat map of positive and negative top ten logFC DEGs in RM samples from combined GEO dataset. (c) GSEA six biological function bubble plot presentation in RM samples from combined GEO dataset. (d–i) GSEA showed that genes in RM samples of the combined GEO dataset were significantly enriched in Pi3kakt signaling pathway (d). Hippomerlin Signaling Dysregulation (e), Nfkb Targets Up (f), TP53 Network (g), Tgf Beta Signaling Pathway (h), IL6 Signaling Up (i). The screening criteria of GSEA were adj.p < 0.05 and FDR value (q value) < 0.25, and the p-value correction method was BH.
Fig. 8
Fig. 8
GSVA for risk group. Boxplot (a) and heat map (b) of GSVA results for group comparison between high-risk and low-risk groups. *Represents p-value < 0.05, statistically significant; ** represents p-value < 0.01 and is highly statistically significant. Screening criterion for GSVA was p < 0.05. High-(orange) and low-risk (yellow) groups.
Fig. 9
Fig. 9
Regulatory network of key genes. (a) mRNA-miRNA regulatory network of key genes. (b) mRNA-TF regulatory network of key genes. (c) mRNA-RBP regulatory network of key genes. (d) mRNA-drug regulatory network of key genes. mRNAs are shown in red, miRNAs in blue, TFs in yellow, RBP in purple, and drug targets in gray.
Fig. 10
Fig. 10
Immune infiltration analysis by ssGSEA algorithm. (a) Immune cells in the RM and Control groups were compared. (b) Combined GEO data correlation heatmap of immune cell infiltration abundance. (c) An analysis of the correlation between key genes and immune cell infiltration abundance in the combined GEO datasets. *Represents p-value < 0.05, statistically significant; ** represents p-value < 0.01 and is highly statistically significant. Absolute values of the correlation coefficient (r-value) < 0.3 were weak or no correlation, 0.3 to 0.5 was a weak correlation, 0.5 to 0.8 was a moderate correlation, and above 0.8 was a strong correlation. In the group comparison diagram, the RM group is shown in purple, and the control group is shown in blue. In the correlation heatmap, red and blue represent positive and negative correlations, respectively.
Fig. 11
Fig. 11
Protein domain of key genes. (a–f) Protein domains of key genes YIPF5 (a), CASP9 (b), PPP1R15B (c), EIF2AK2 (d), CYCS (e), and ATF6 (f) are shown. AlphaFold protein structure database generated a confidence score per residue (pLDDT) between 0 and 100. Some regions below 50 pLDDT may be isolated unstructured regions, and when pLDDT < 50 (red area), the model confidence is very low; when 50 < pLDDT < 70 (yellow area), the model confidence is low; when 70 < pLDDT < 90 (light blue area), the model confidence was normal. When 90 < pLDDT (blue area), the model confidence is very high.

Similar articles

References

    1. Practice Committee of the American Society for Reproductive Medicine. Definitions of infertility and recurrent pregnancy loss: A committee opinion. Fertil. Steril.99, 63 (2013). - PubMed
    1. Rai, R. & Regan, L. Recurrent miscarriage. Lancet. 368, 601–611 (2006). - PubMed
    1. Biaggi, A., Conroy, S., Pawlby, S. & Pariante, C. M. Identifying the women at risk of antenatal anxiety and depression: A systematic review. J. Affect. Disord. 191, 62–77 (2016). - PMC - PubMed
    1. Christiansen, O. B. et al. ESHRE guideline: Recurrent pregnancy loss. Hum. Reprod. Open.2, hoy004 (2018). - PMC - PubMed
    1. Oakes, S. A. & Papa, F. R. The role of endoplasmic reticulum stress in human pathology. Annu. Rev. Pathol.10, 173–194 (2015). - PMC - PubMed

Publication types

Substances

LinkOut - more resources