. 2025 Jan 9;15(1):1467.
doi: 10.1038/s41598-024-84121-9.

The influence of repeated frowning and smiling on corrugator muscle activity and wrinkles between eyebrows

Affiliations

The influence of repeated frowning and smiling on corrugator muscle activity and wrinkles between eyebrows

Shuntaro Okazaki et al. Sci Rep. .

Abstract

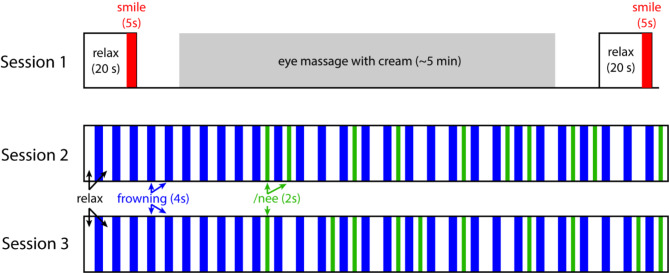
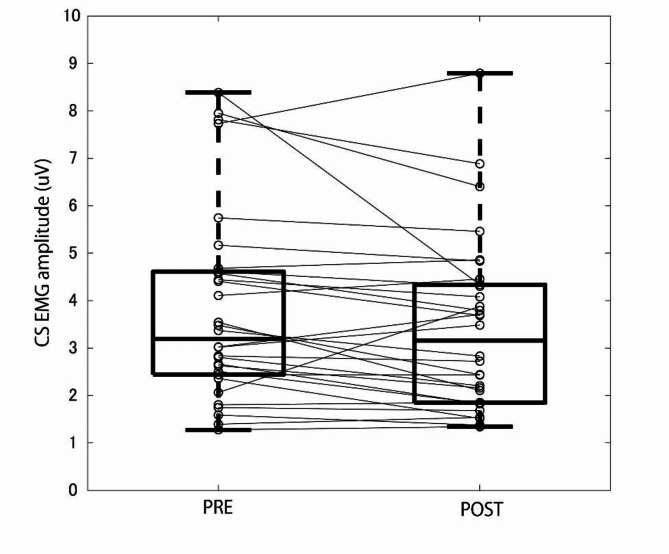
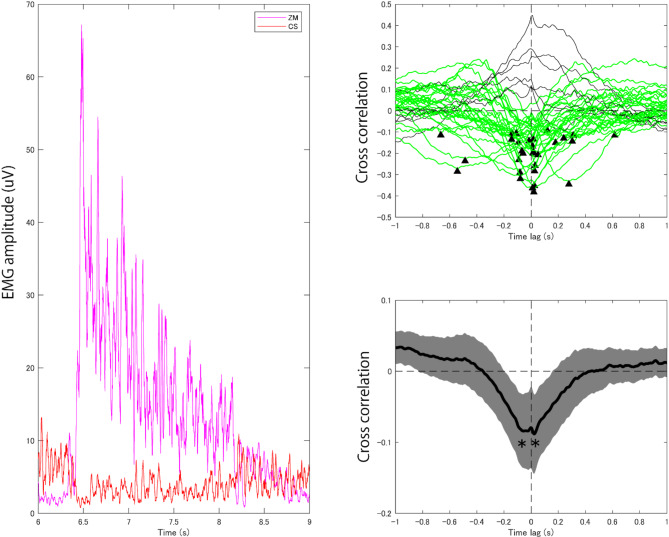
Like the lines themselves, concerns about facial wrinkles, particularly glabellar lines - the prominent furrows between the eyebrows - intensify with age. These lines can inadvertently convey negative emotions due to their association with negative facial expressions. We investigated the effects of repeated frowning on the development of temporary glabellar lines through the activation of the corrugator muscle. In addition, as communication via facial expressions requires precise control over the muscles of the face in such a way as to avoid contradictory signals, we hypothesized that smiling and activation of the zygomatic major may inhibit the corrugator. Our findings reveal that repeated frowning creates temporary wrinkles between the eyebrows, caused by the slight but cumulative activation of the corrugator muscle. Further we found that the act of smiling activates zygomatic major and suppresses the corrugator reducing the appearance of glabellar lines. The results offer a novel perspective on smiling and suggests that smiling not only facilitates positive emotional exchanges but may also help maintain a youthful facial appearance.

Keywords: Corrugator Supercilii; Electromyography; Facial expression; Facial muscle; Zygomaticus major.


Conflict of interest statement

Declarations. Competing interests: All authors are employed as researchers in Shiseido Co., Ltd.

Figures

Fig. 1
Fig. 1
Schematic representation of the experimental design.
Fig. 2
Fig. 2
CS and ZM muscle activation during and after the repeated frowning at each trial with and without induced /nee smiling. The upper panel depicts the time series of these muscles. Blue, red, cyan, magenta lines indicate the CS muscle activation at the Non and Nee trials, and the ZM muscle activation at the Non and Nee trials, respectively. The lower left panel depicts the comparison of the CS EMG amplitude between the trials (Non vs. Nee) during Nee phase. The lower right panel depicts the comparison of the CS EMG amplitude between the trials (Non vs. Nee) after the Nee phase. The phase in which we analyze the data are superimposed in the upper panel as gray boxes.
Fig. 3
Fig. 3
Quantitative assessment of the distance between eyebrows. The upper panel depicts the time series of the normalized distance (B/W; B: Horizontal distance between inner end coordinates of eyebrows, W: The horizontal distance between the left and right outermost landmarks of the face outline). All face landmarks coordinates were superimposed in this panel. Blue and red lines are the time series of the Non and Nee trials, respectively. The left and right gray boxed areas indicate the analysis time windows of during Nee and after Nee phases, respectively. The middle panel depicts the comparison of the distances between the trials (Non vs. Nee) during the Nee phase. The right panel depicts the comparison of the distance between the trials (Non vs. Nee) after the Nee phase.
Fig. 4
Fig. 4
CS muscle median activities before and after periorbital massage.
Fig. 5
Fig. 5
Accumulation of unintentional CS muscle activation and wrinkle production through repeated frowning across the first 9 trials in session 2 and 3. (A) The CS muscle activation extracted 1-s period after each frowning and “pre” means those before the 1st frowning B Wrinkle images in each trial subtracted by a “pre” wrinkle image in session 2. They were extracted 1-s period before each frowning and averaged across participants for session 2. “pre” means those before the 1st frowning. Note that the only the wrinkle image at “pre” is computed from 10 frames (see Materials and methods). C Wrinkle images in session 3 as in (B) . (D) t-value map of the wrinkle image for 9th trial in session 2. The image was resized (1 grid = 5 × 5 pixels) for statistics and only the results above the threshold of corrected p values were represented. E t-value map of wrinkle image for 9th trial in session 3. For panel (D) and (E) the averaged position of the face landmarks are superimposed.
Fig. 6
Fig. 6
Temporal relationship between the ZM muscle activation and the CS muscle deactivation by the induced smile. The left panel depicts signal of the ZM muscle activation (magenta) and CS muscle deactivation (red) in a typical single trial. Right upper panel depicts cross correlation functions of each panel separately. Green lines indicate the cross correlation functions whose lowest values were localized as a negative peak (indicated as arrows) from − 1 s to 1 s for the time lag. Right lower panel depicts grand average cross correlation function across all participants. Gray area indicates the standard error of mean of the cross correlation.
Fig. 7
Fig. 7
Photographic assessment of the face around the center of the 2 eyebrows. Panel (A) illustrates 3 most effective examples of the participants (P1-3). The top and middle rows of panel A depict the photograph around eye when the participants were relaxing without and with the induced smile (Non and Nee), respectively. The bottom row in A depicts the difference in brightness value between the Non and Nee trials (Nee-Non so that the yellow-colored portion indicates that the darker places at the face (e.g. wrinkle) got brighter). Panel (B) illustrates the averaged difference in brightness across participants. Panel (C) indicates the t-value map of the cluster-based statistics (10 × 10 = 100 grids for the correction of multiple comparisons). Only the results above the threshold of corrected p values were represented. For panel (B) and (C) the averaged position of the face landmarks are superimposed.

Similar articles

References

    1. Qaqish, C. Botulinum Toxin Use in the Upper Face. Atlas Oral Maxillofac. Surg. Clin. N. Am.24, 95–103 (2016). - PubMed
    1. Dastoor, S. F., Misch, C. E. & Wang, H. L. Botulinum Toxin (Botox) to Enhance Facial macroesthetics: a Literature Review. J. Oral Implantology. 33, 164–171 (2007). - PubMed
    1. Kim, H. J., Seo, K. K., Lee, H. K. & Kim, J. Clinical Anatomy of the Face for Filler and Botulinum Toxin Injection (Springer Singapore, 2016). 10.1007/978-981-10-0240-3
    1. Rosenberg, E. L. & Ekman, P. What the Face Reveals: Basic and Applied Studies of Spontaneous Expression Using the Facial Action Coding System (FACS) (Oxford University Press, 2020).
    1. Hamas, R. S. Reducing the subconscious frown by endoscopic resection of the corrugator muscles. Aesthetic Plast. Surg.19, 21–25 (1995). - PubMed

Publication types

LinkOut - more resources