. 2025 Jan 9;8(1):24.
doi: 10.1038/s42003-024-07389-7.

Mapping mitochondrial morphology and function: COX-SBFSEM reveals patterns in mitochondrial disease

Affiliations

Mapping mitochondrial morphology and function: COX-SBFSEM reveals patterns in mitochondrial disease

Julie Faitg et al. Commun Biol. .

Abstract

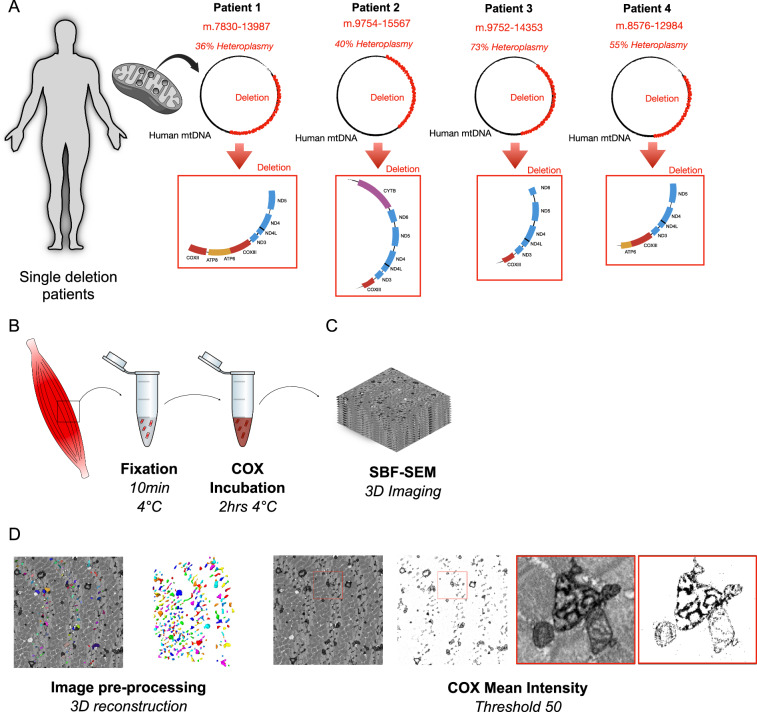
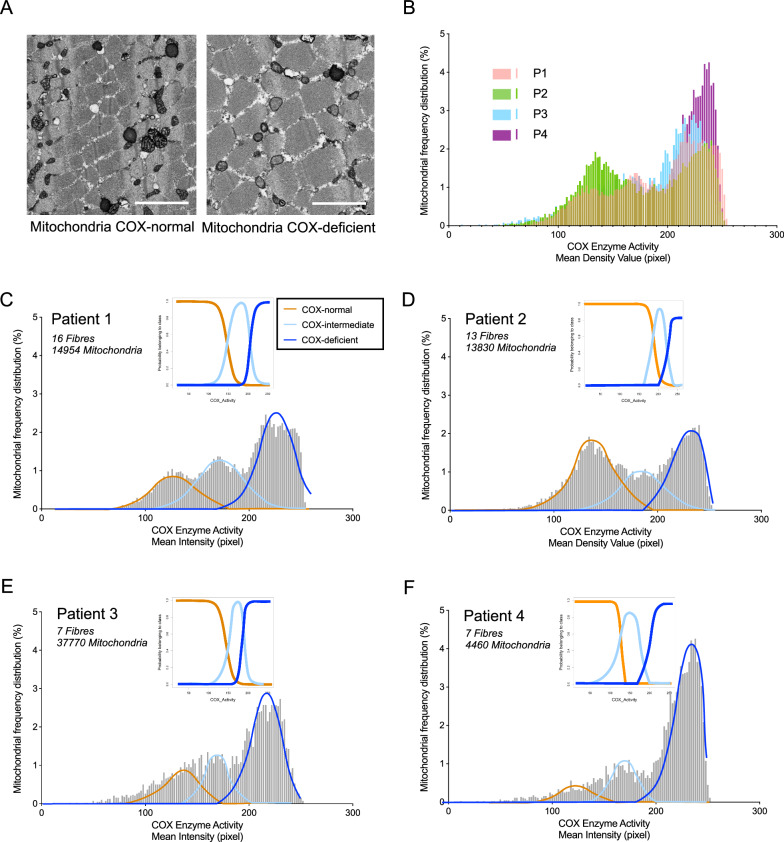
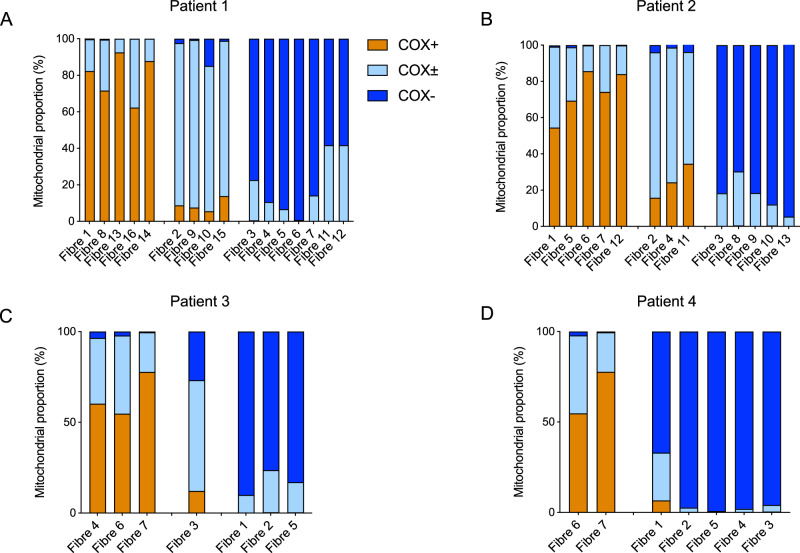
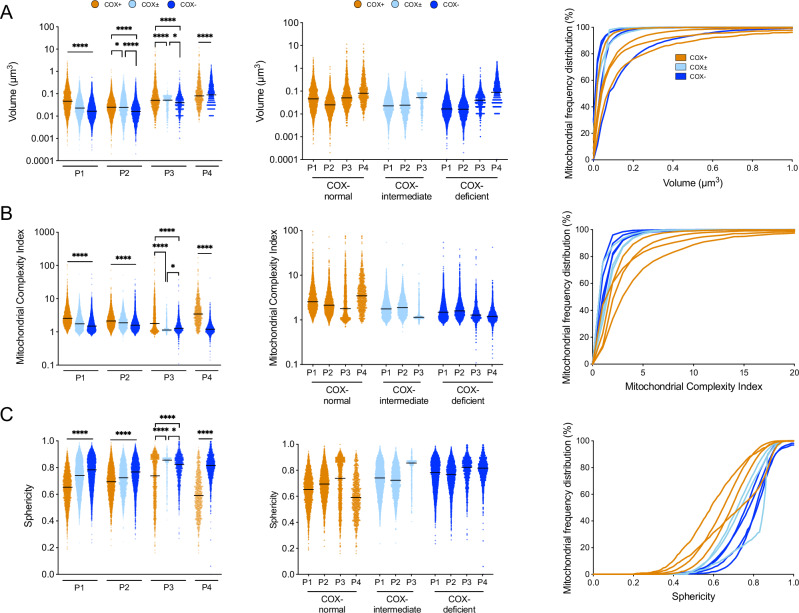
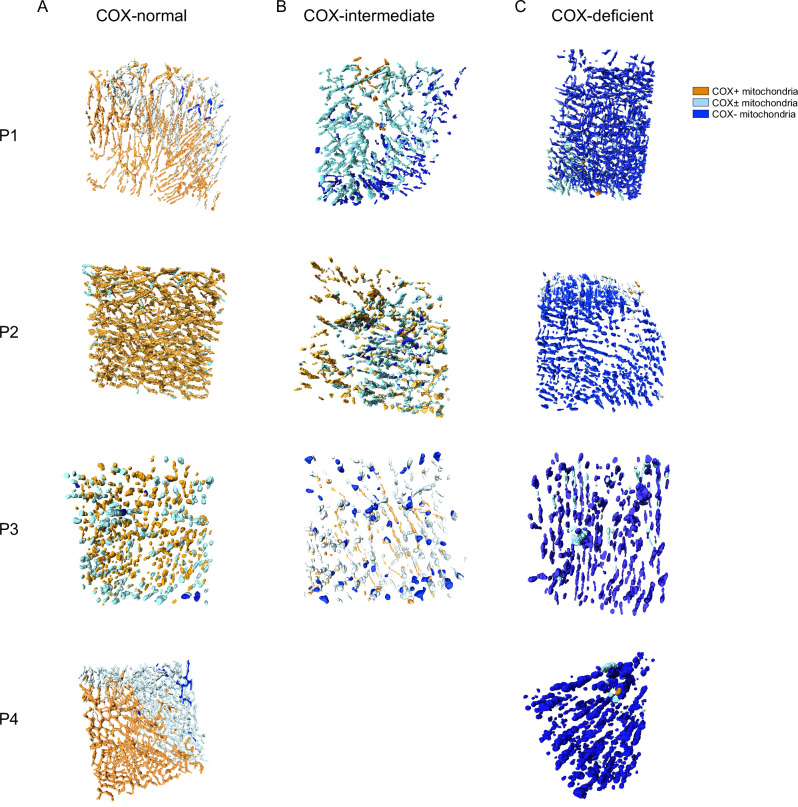
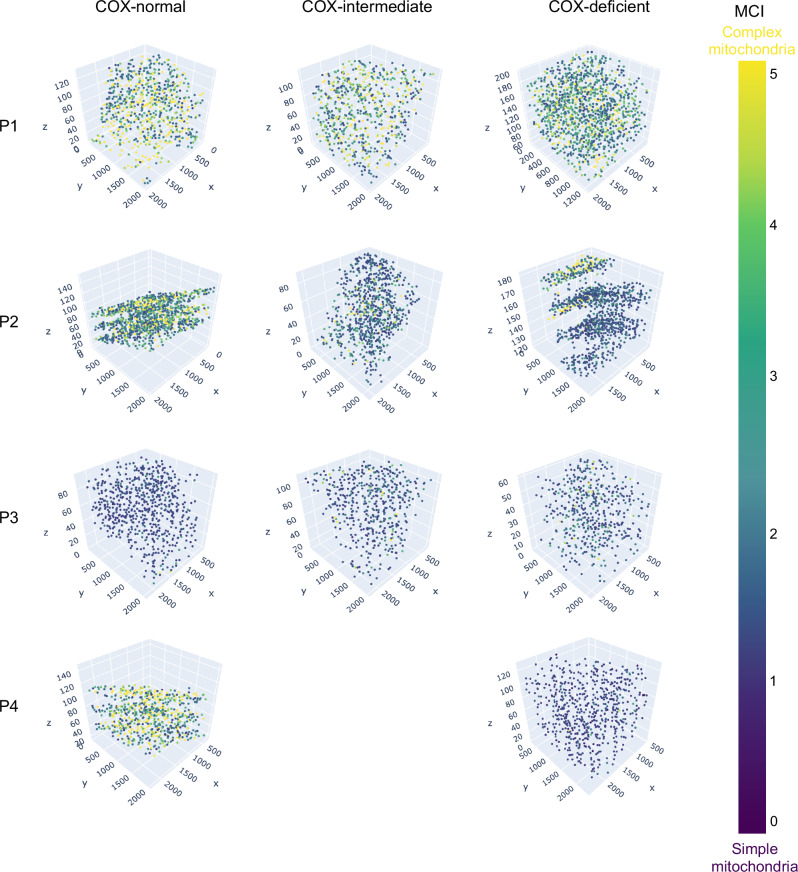
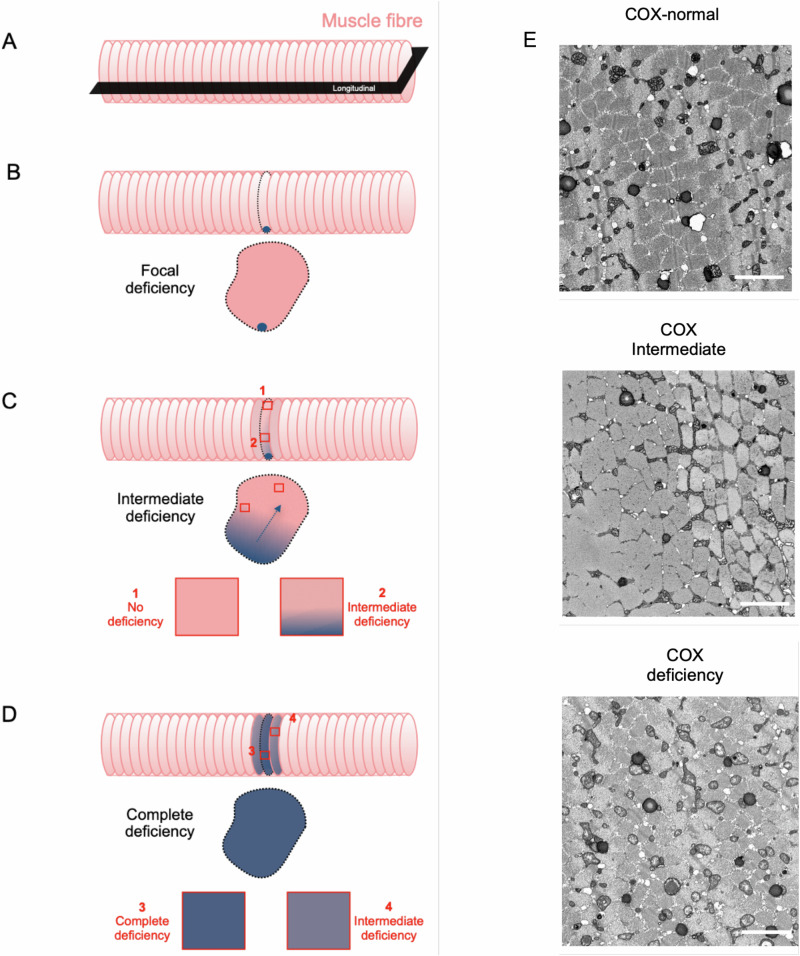
Mitochondria play a crucial role in maintaining cellular health. It is interesting that the shape of mitochondria can vary depending on the type of cell, mitochondrial function, and other cellular conditions. However, there are limited studies that link functional assessment with mitochondrial morphology evaluation at high magnification, even fewer that do so in situ and none in human muscle biopsies. Therefore, we have developed a method which combines functional assessment of mitochondria through Cytochrome c Oxidase (COX) histochemistry, with a 3D electron microscopy (EM) technique, serial block-face scanning electron microscopy (SBFSEM). Here we apply COX-SBFSEM to muscle samples from patients with single, large-scale mtDNA deletions, a cause of mitochondrial disease. These deletions cause oxidative phosphorylation deficiency, which can be observed through changes in COX activity. One of the main advantages of combining 3D-EM with the COX reaction is the ability to look at how per-mitochondrion oxidative phosphorylation status is spatially distributed within muscle fibres. Here we show a robust spatial pattern in COX-positive and intermediate-fibres and that the spatial pattern is less clear in COX-deficient fibres.


Conflict of interest statement

Competing interests: JF is an employee of Amazentis. DMT is on the Scientific Advisory Board for Khondrion BV and Pretzel therapeutics. DMT does consultancy work for Reneo Pharma, Droia NV, IMEL Biotherapeutics and Precision Biosciences. All other authors declare no competing interests.

Figures

Fig. 1
Fig. 1. Schematic showing work flow for experiments.
A Schematic of study design involving single deletion patients. B Muscle biopsy and teasing fibre. fixation and imaging of bundles muscle fibre and mitochondria in transversal orientation. C Z stack at EM resolution from serial block face scanning electron microscopy (SBF-SEM) used for 3D reconstructions (dimensions of 20 μm × 20 μm). D Image processing and 3D reconstruction of individual mitochondria (left) and thresholding for COX intensity including high resolution image of COX positive and negative mitochondria (left).
Fig. 2
Fig. 2. Mitochondrial COX activity falls into three distinct groups.
A Single SBF-SEM image of a COX normal fibre (left) and a COX-deficient fibre (right). B Frequency distribution of mitochondrial COX activity from individual fibres of all single, large-scale mtDNA deletion patients. Patients, n = 4; Fibre, n = 43; Mitochondria, n = 37,014. Gaussian Mixture Model to P1 (C), P2 (D), P3 (E), P4 (F) data, each mitochondrion belongs to the orange, light blue, or blue cluster fit to COX activity distributions from Patient 1: Fibres n = 16; Mitochondria; n = 14,954. Patient 2: Fibres n = 13; Mitochondria; n = 13,830. Patient 3: Fibres n = 7; mitochondria n = 770. Patient 4: Fibres n = 7; mitochondria n = 4460.
Fig. 3
Fig. 3. Proportion of mitochondria classified as COX positive, intermediate or deficient in each fibre.
Proportion of Mitochondria classified as COX positive, intermediate and deficient within each fibre from A Patient 1, B Patient 2, C Patient 3 and D Patient 4. COX positive mitochondria are represented in orange; COX intermediate mitochondria are represented in light blue; COX negative mitochondria are represented in blue. Typically, fibres exhibiting more than 50% COX positive mitochondria were visually classified as COX positive fibres, those exhibiting more than 50% COX intermediate mitochondria were visually classified as intermediate fibres and those exhibiting more than 50% COX deficient mitochondria were visually classified as COX deficient mitochondria. Patient 1: Fibres n = 16; Mitochondria n = 14,954. Patient 2: Fibres n = 13; Mitochondria n = 13,830. Patient 3: Fibres n = 7; Mitochondria n = 3770. Patient 4: Fibres n = 7; Mitochondria n = 4460.
Fig. 4
Fig. 4. General morphological comparison between mitochondria of COX-normal, intermediate, and deficient fibres from all patients.
Mitochondrial volume (A), MCI (B), and sphericity (C) with their respective cumulative frequency distribution of the COX-normal, COX-intermediate, and COX-deficient fibres. For each parameter 2 additional graph have been added: The first column displays median values for each metric, the second column shows patient-grouped data, and the third column presents the frequency distributions. Mitochondrial complexity Index (MCI) is a three-dimensional metric of mitochondrial shape complexity. MCI is an analogous to sphericity and scales with mitochondrial shape complexity, including branches and increased surface area relative to volume. Patient 1: Fibres n = 16; Mitochondria n = 14,954. Patient 2: Fibres n = 13; Mitochondria n = 13,830. Patient 3: Fibres n = 7; Mitochondria n = 3770. Patient 4: Fibres n = 7; Mitochondria n = 4460. Data are presented as median with 95% CI. Kruskal–Wallis test followed by post-hoc tests using the two-stage step-up method of Benjamini, Krieger, and Yekutieli to correct multiple comparisons (p < 0.05, q < 0.05).
Fig. 5
Fig. 5. Effect of Single deletion mutation on mitochondrial morphology and function for each patient.
Mitotypes illustrating the difference in COX activity and MCI between fibres (mean ± SEM), for patient 1 (A), patient 2 (B), patient 3 (C) and patient 4 (D). Patient 1: Fibres n = 16; Mitochondria n = 14,954. Patient 2: Fibres n = 13; ; Mitochondria n = 13,830. Patient 3: Fibres n = 7; Mitochondria n = 3770. Patient 4: Fibres n = 7; Mitochondria n = 4460.
Fig. 6
Fig. 6. Multivariate analysis of mitochondrial morphology between individual normal and deficient fibres from all patients.
A Partial Least Squares Discriminant Analysis (PLS-DA) highlights morphological variables specific to the differentiation of COX-normal and COX-deficient fibres. On the left, the PLS-DA score plots were presented for each type of variable. The model explains 92.1% (PC1) + 6.3% (PC2) + 1.3% (PC3) = 99.7% of the variance. This method is used to discern differences between different group. PC1 is the most significant component, capturing the majority of the variance (92.1%). This means that the majority of the morphological differences between COX-normal and COX-deficient fibres are explained by PC1. PC2 and PC3 contribute less to the variance but still provide additional information for differentiation. The COX-normal fibres are more widely distributed, with the COX-deficient fibres mostly contained within the red ellipse, with the exception of 3 points falling outside. Inset shows 3D PLS-DA from an alternative angle to more clearly see the separation of points. B The variable importance in projection or VIP score for the morphology parameters used in the PLS-DA regrouping the 4 patients together. The VIP score of a variable is a measure of its contribution to the model across all components. Higher VIP scores indicate greater importance in differentiating between classes. A common threshold for considering a variable important is a VIP score greater than 1. Variables with VIP scores above this threshold are typically considered significant in the model. The coloured boxes on the right indicate the relative concentrations of the corresponding metabolite in each group under the current study. Heatmap across group average (D), and all subjects and parameters (C), with dendrograms illustrating hierarchical clustering of pattern similarity across morphological parameters and samples (top) (Euclidean distance measure, Ward clustering algorithm). The colours indicate the relative quantitative value, where red indicates a higher value, and blue indicates a lower value. The COX-normal fibres: Patient 1: n = 5; Patient 2: n = 5; Patient 3: n = 3; Patient 4: n = 2. The COX-deficient fibres: Patient 1: n = 7; Patient 2: n = 5; Patient 3: n = 3; Patient 4: n = 5.
Fig. 7
Fig. 7. Morphological comparison of the three distinct mitochondria groups present within each fibre.
This involve analysis of the COX-normal, COX-intermediate, and COX-deficient fibres of all the regrouped patients in order to draw a conclusive comparison. A Box and whisker plots for mitochondrial volume, MCI (B), and sphericity (C) of the COX-normal, COX-intermediate, and COX-deficient fibres. Box and whisker represent median, 25th quartile and 75th quartile as well as minimum and maximum values. D Nanotunnels frequency (/100mitochondria) quantification for one fibre COX-normal and one fibre COX-deficient per patient. Patient 1: Fibres n = 16; Mitochondria n = 14,954. Patient 2: Fibres n = 13; Mitochondria n = 13,830. Patient 3: Fibres n = 7; Mitochondria n = 3770. Patient 4: Fibres n = 7; Mitochondria n = 4460. Data are presented as median with 95% CI. Kruskal–Wallis test followed by post-hoc tests using the two-stage step-up method of Benjamini, Krieger, and Yekutieli to correct multiple comparisons (p < 0.05, q < 0.05).*p < 0.05,**p < 0.005, ***p < 0.0005, ****p < 0.0001.
Fig. 8
Fig. 8. COX activity and spatial distribution of the mitochondrial COX activity and their respective morphologies within a COX-normal/COX-intermediate and COX-deficient fibres from Patient 1,2,3&4.
The 3D reconstruction figures of a COX-normal (Fig. 7A), COX-intermediate (Fig. 7B) and COX-deficient (Fig. 7C) fibre demonstrate coloured mitochondria according to their COX activity. 3D reconstruction of mitochondrial COX activity across two sarcomeres in COX normal (A), COX-intermediate (B) and COX-deficient (C) fibres demonstrate coloured mitochondria according to their COX activity for Patients 1-4. Mitochondria are colour coded dependent on COX activity as indicated by the scale Cluster of COX-normal and intermediate mitochondria can be distinguished by the dotted circle.
Fig. 9
Fig. 9. Mitochondrial spatial distribution and their MCI within a COX-normal/COX-intermediate and COX-deficient fibres from all patients.
3D scatter plot of mitochondrial complexity index across two sarcomeres in COX normal (A), COX-intermediate and COX-deficient fibres. Mitochondria are colour coded dependent on mitochondrial complexity index as indicated by the scale.
Fig. 10
Fig. 10. Model illustrating spread of COX-deficiency.
AE A theoretical guide to understanding and classifying the development of COX deficiency. Focal perinuclear deficiency (B) to segmental deficiency (C). The spread of the dysfunction involves COX-intermediate stages before the full complete COX-deficiency muscle fibre (D). Examples of 2D images from Fibres COX-normal, intermediate and deficient (E).

References

    1. Ogata, T. & Yamasaki, Y. Scanning electron-microscopic studies on the three-dimensional structure of mitochondria in the mammalian red, white and intermediate muscle fibers. Cell Tissue Res.241, 251–256 (1985). - PubMed
    1. Vincent, A. E. et al. Quantitative 3D mapping of the human skeletal muscle mitochondrial network. Cell Rep.27, 321 (2019). - PMC - PubMed
    1. Picard, M., White, K. & Turnbull, D. M. Mitochondrial morphology, topology, and membrane interactions in skeletal muscle: a quantitative three-dimensional electron microscopy study. J. Appl. Physiol.114, 161–171 (2013). - PMC - PubMed
    1. Picard, M., Hepple, R. T. & Burelle, Y. Mitochondrial functional specialization in glycolytic and oxidative muscle fibers: tailoring the organelle for optimal function. Am. J. Physiol. Cell Physiol.302, C629–C641 (2012). - PubMed
    1. Ferreira, R. et al. Subsarcolemmal and intermyofibrillar mitochondria proteome differences disclose functional specializations in skeletal muscle. Proteomics10, 3142–3154 (2010). - PubMed

Substances

LinkOut - more resources