. 2025 Jan;6(1):123-144.
doi: 10.1038/s43018-024-00881-3. Epub 2025 Jan 9.

Ongoing replication stress tolerance and clonal T cell responses distinguish liver and lung recurrence and outcomes in pancreatic cancer

Affiliations

Ongoing replication stress tolerance and clonal T cell responses distinguish liver and lung recurrence and outcomes in pancreatic cancer

Jason M Link et al. Nat Cancer. 2025 Jan.

Abstract

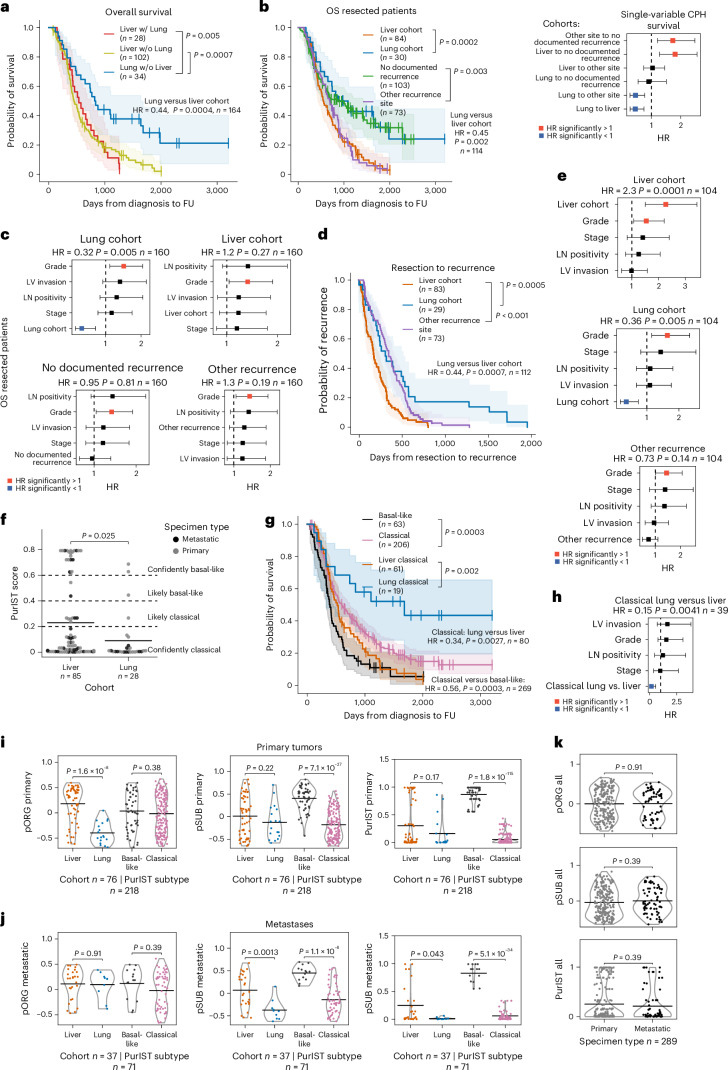
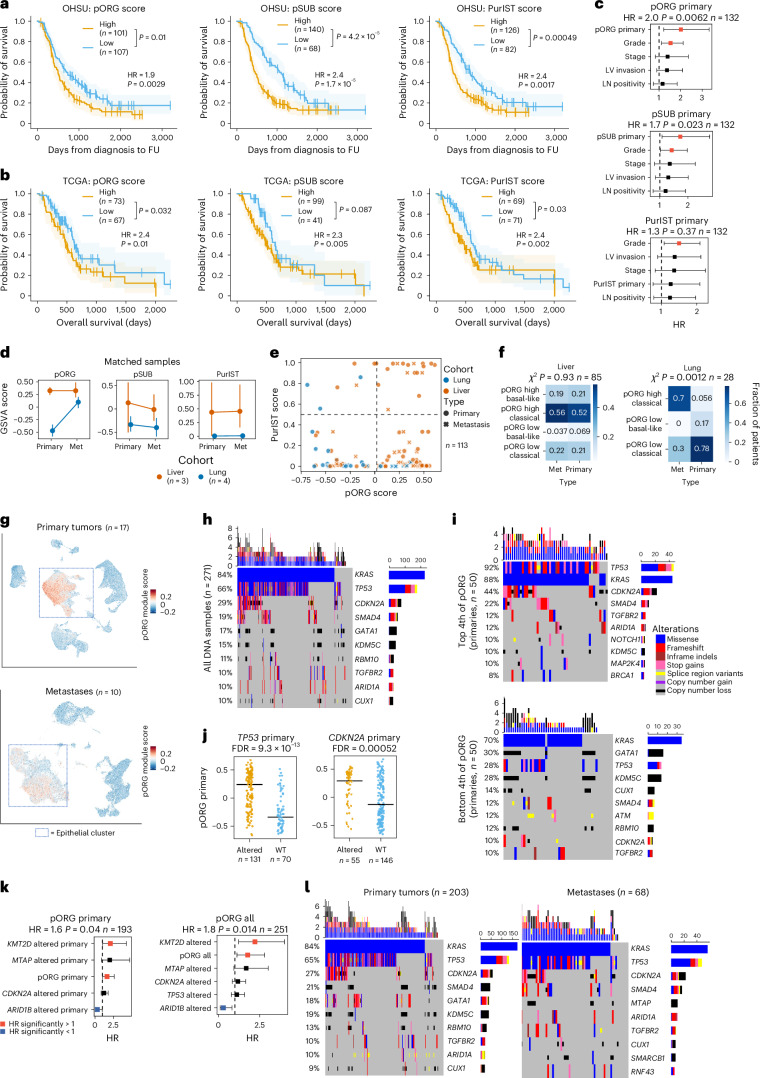
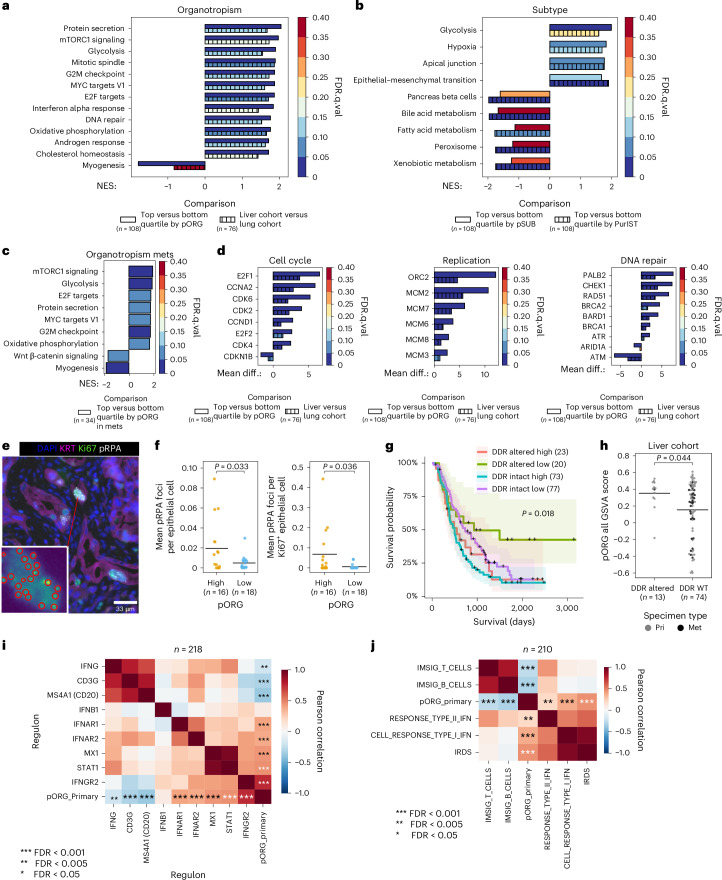
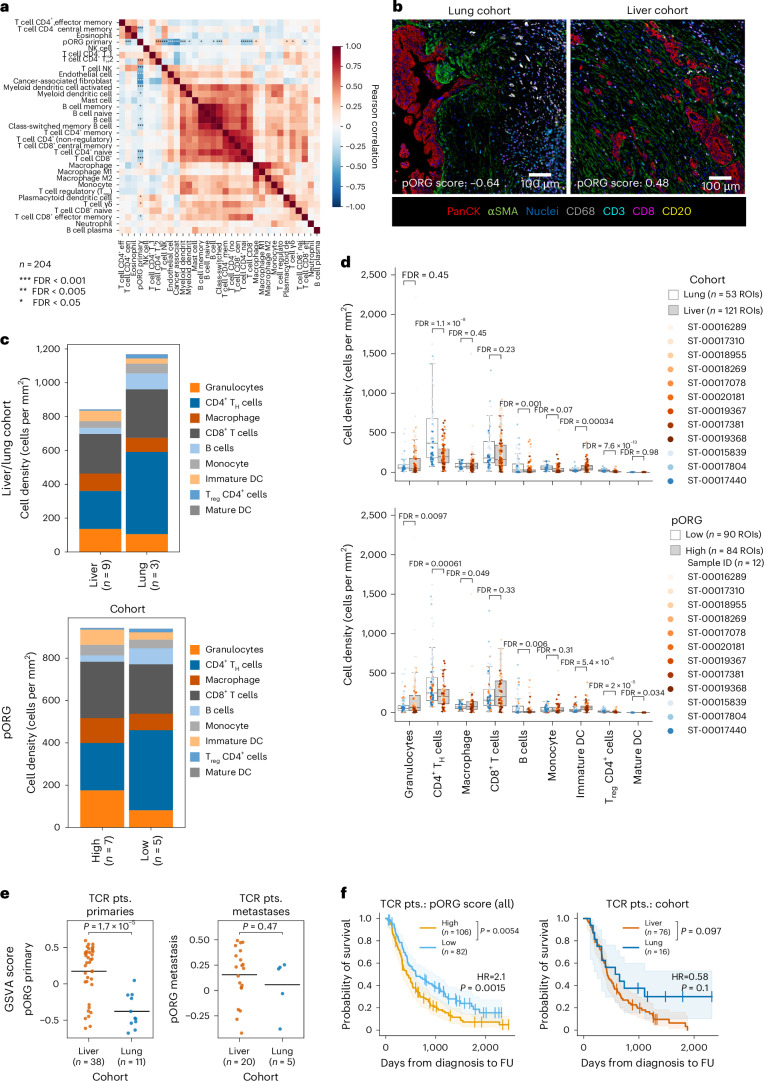
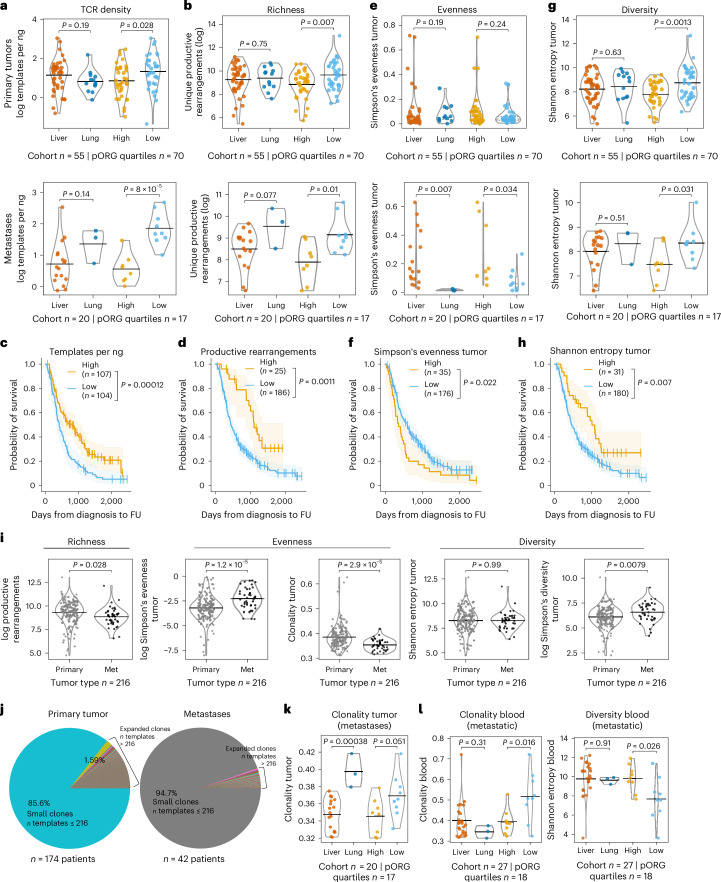
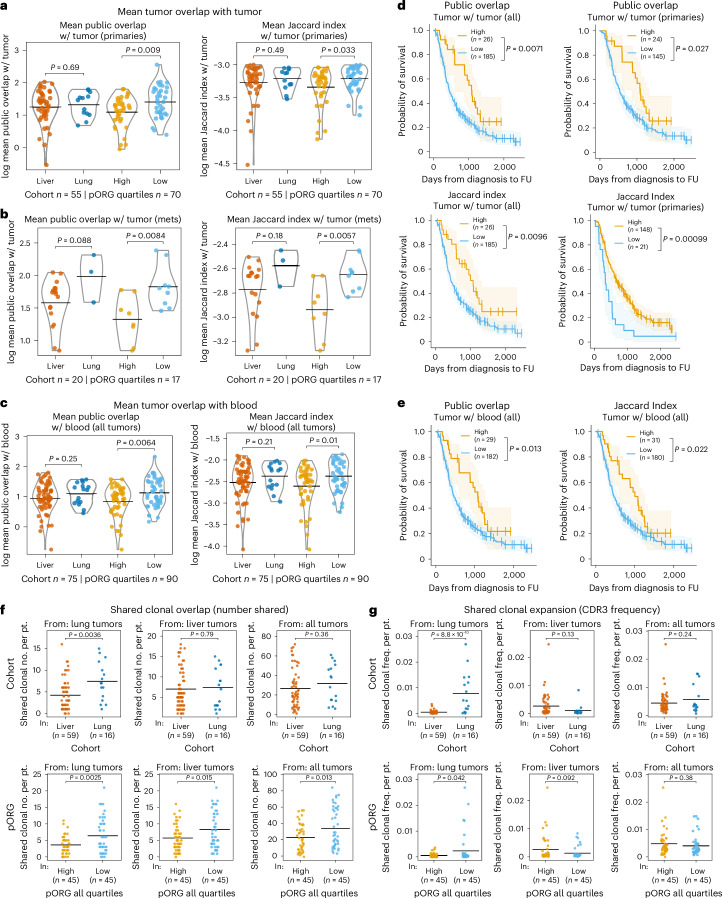
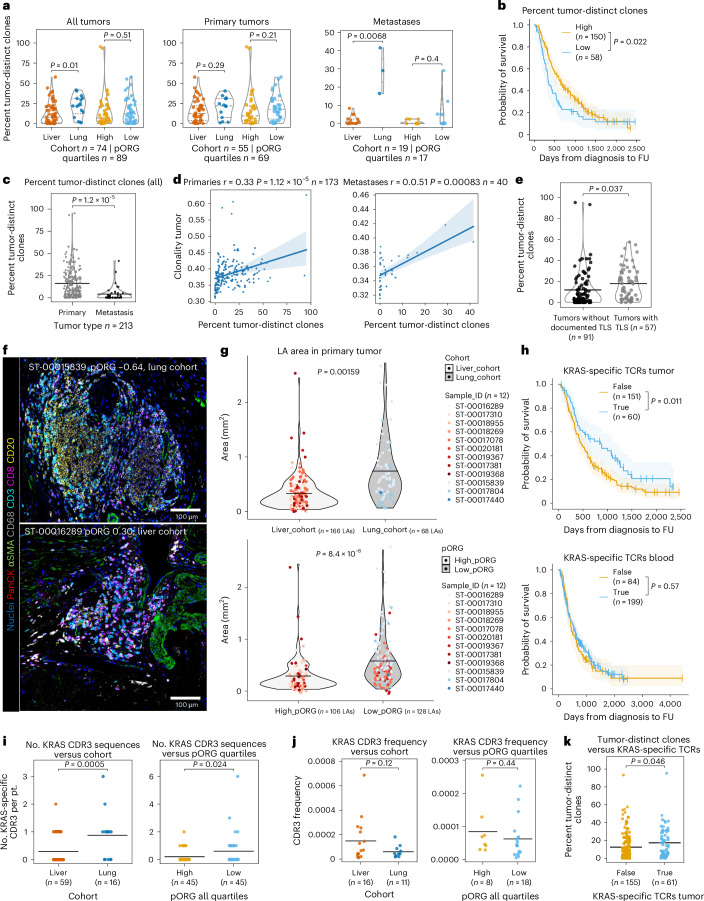
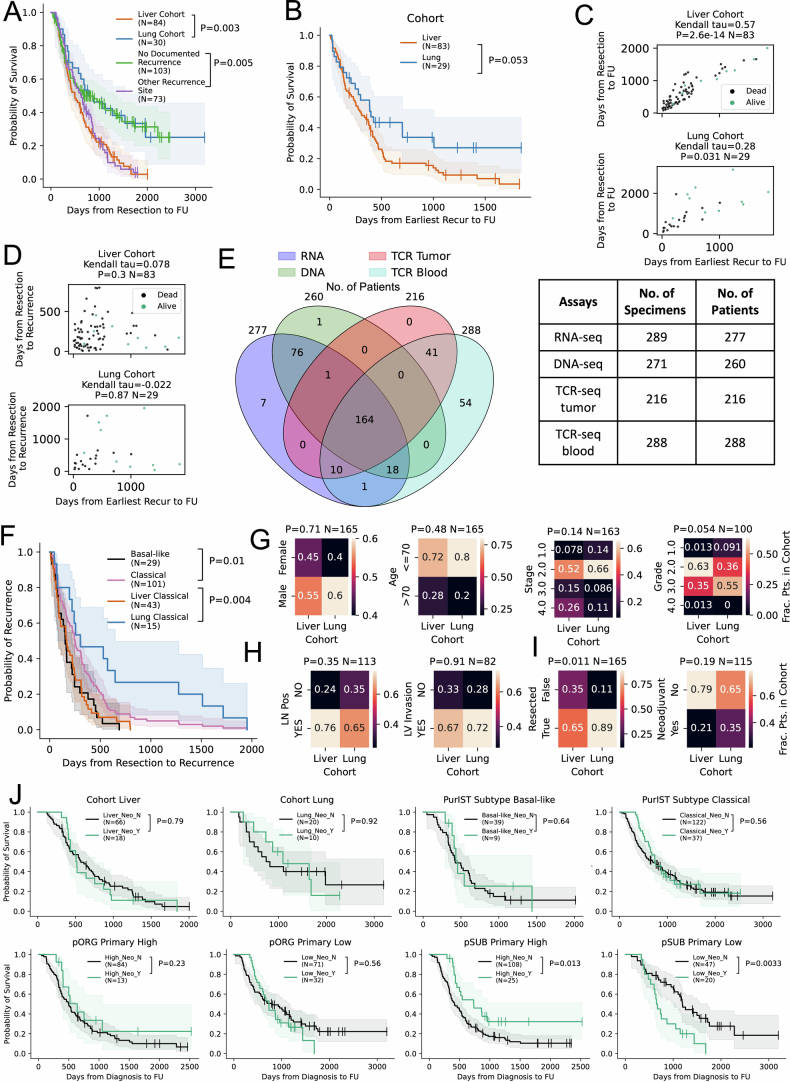
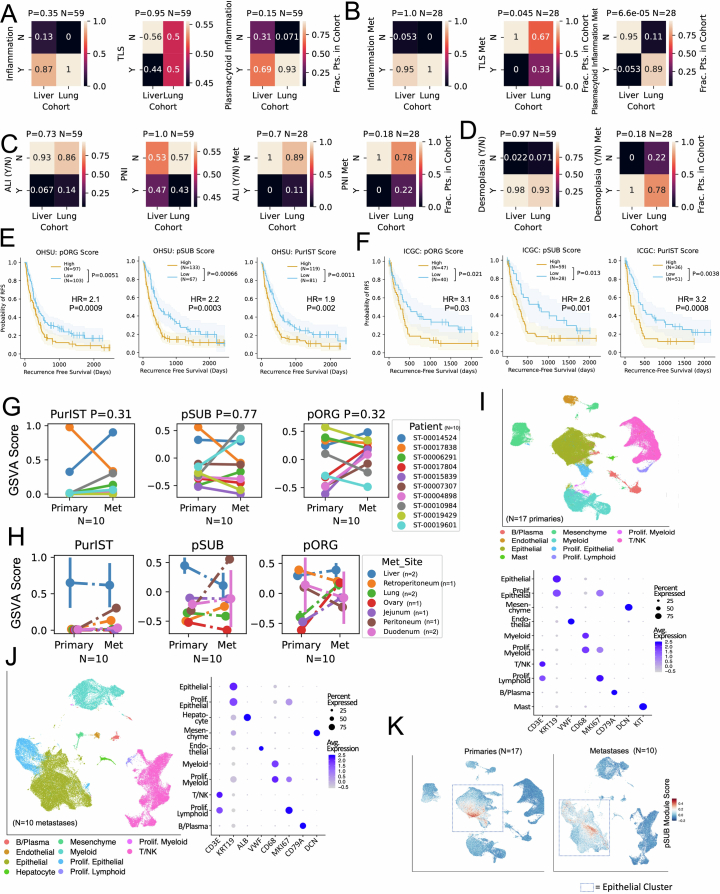
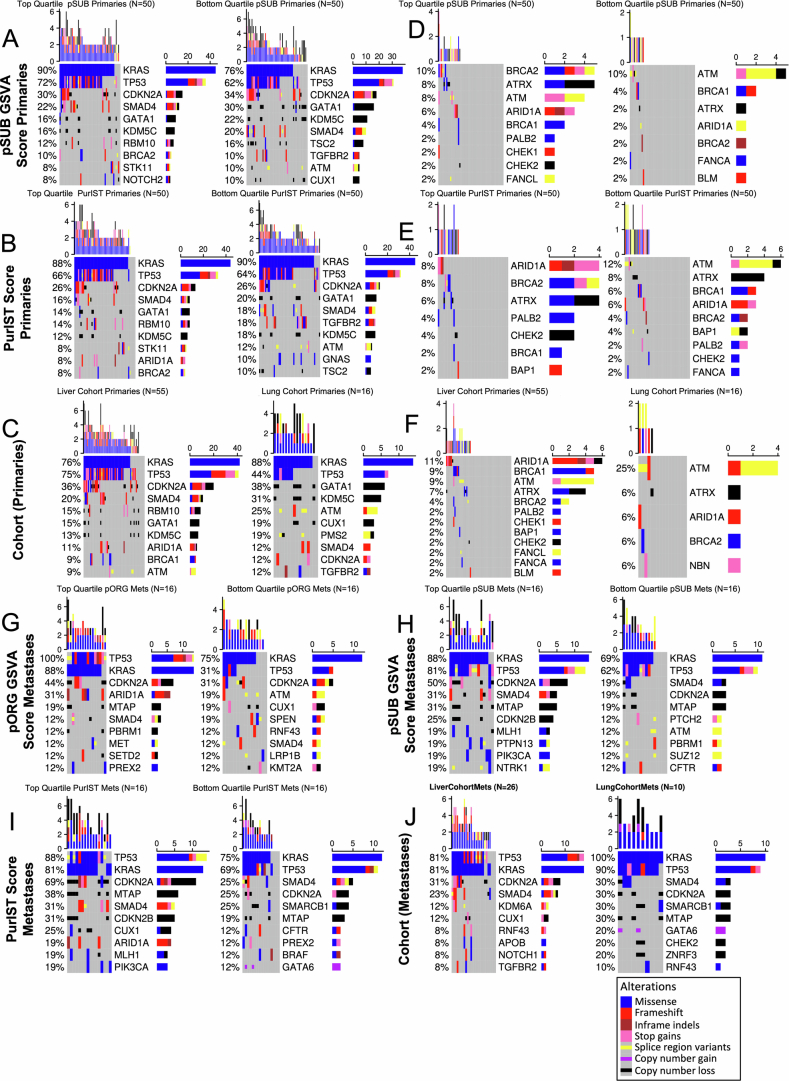
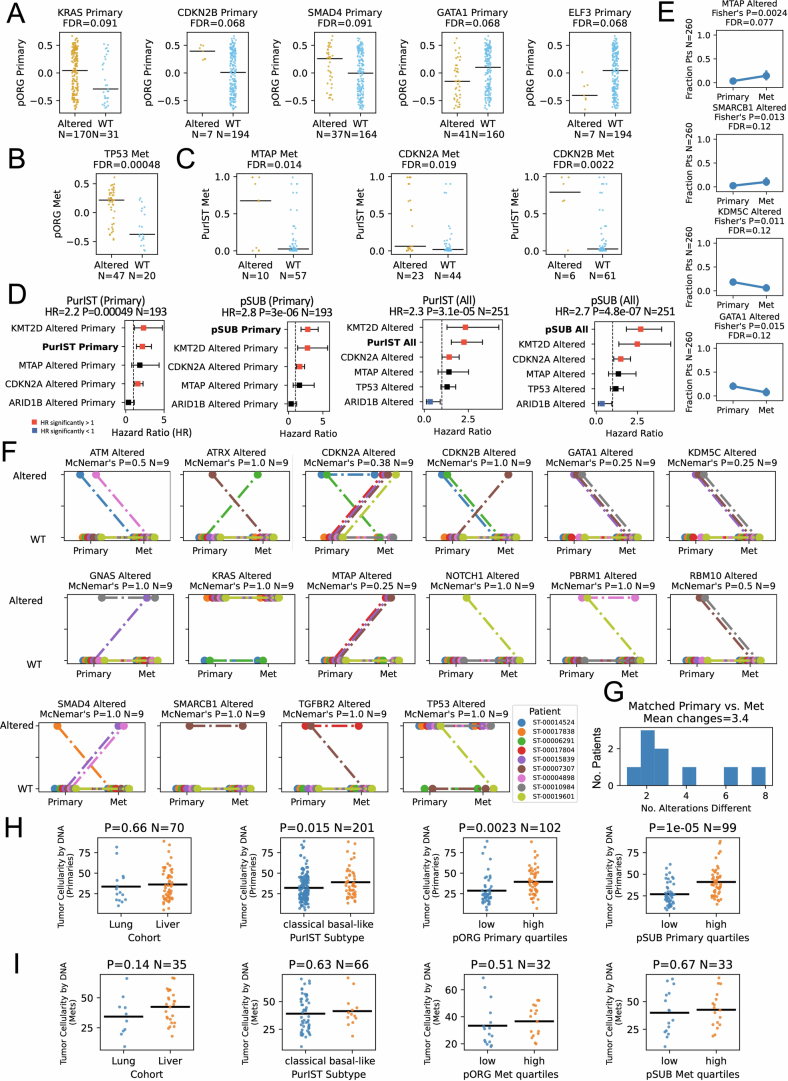
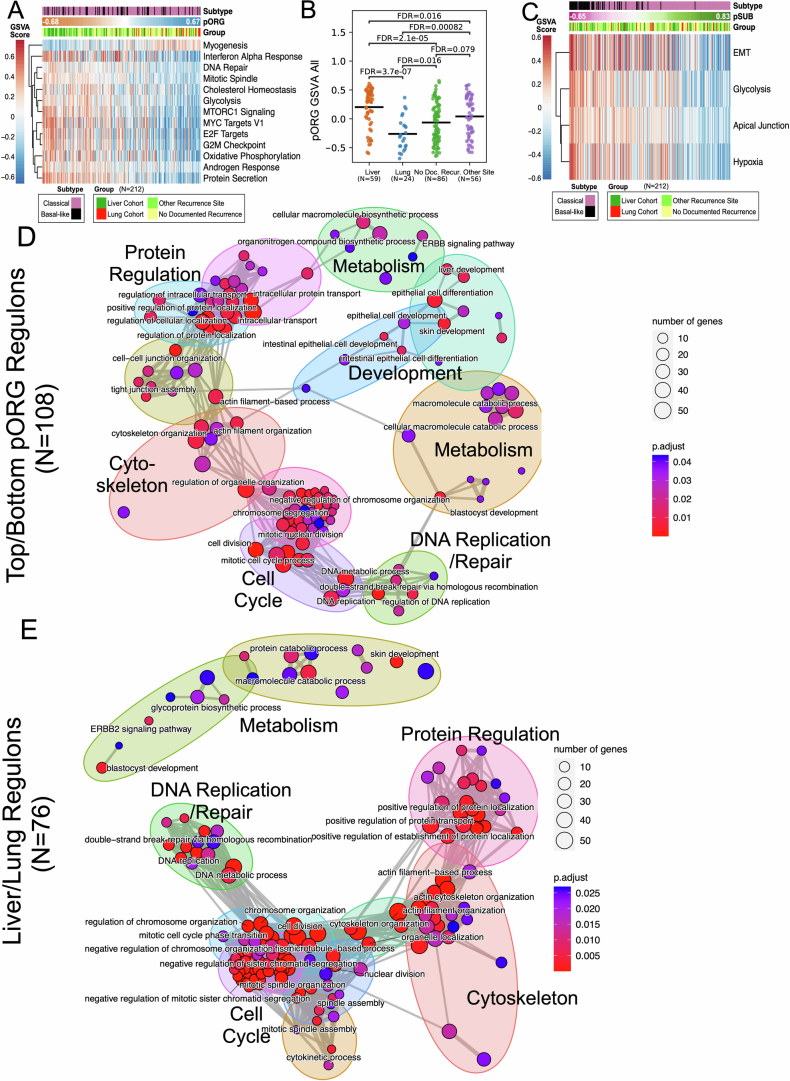
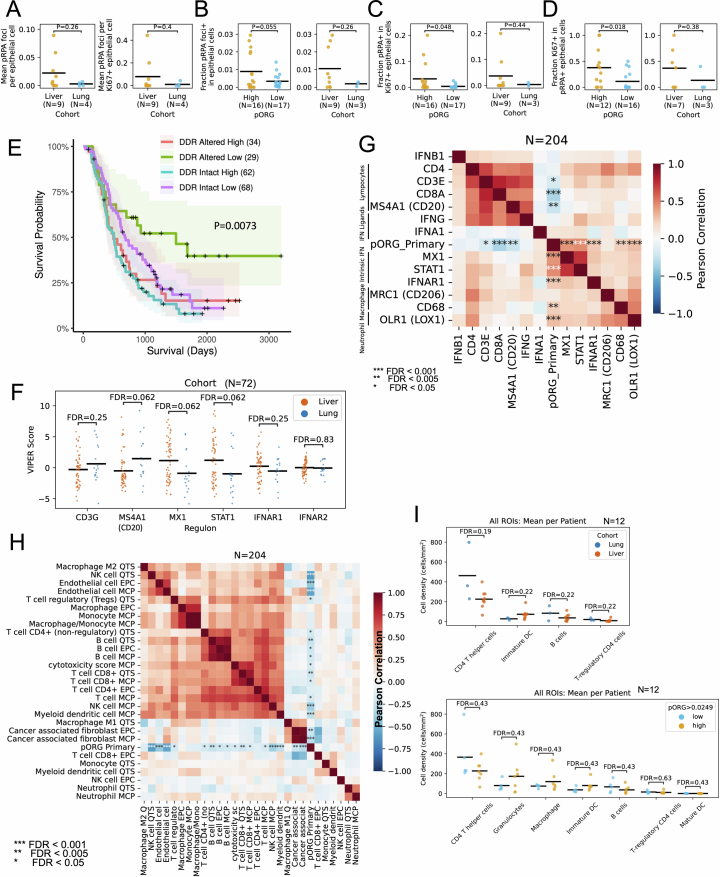
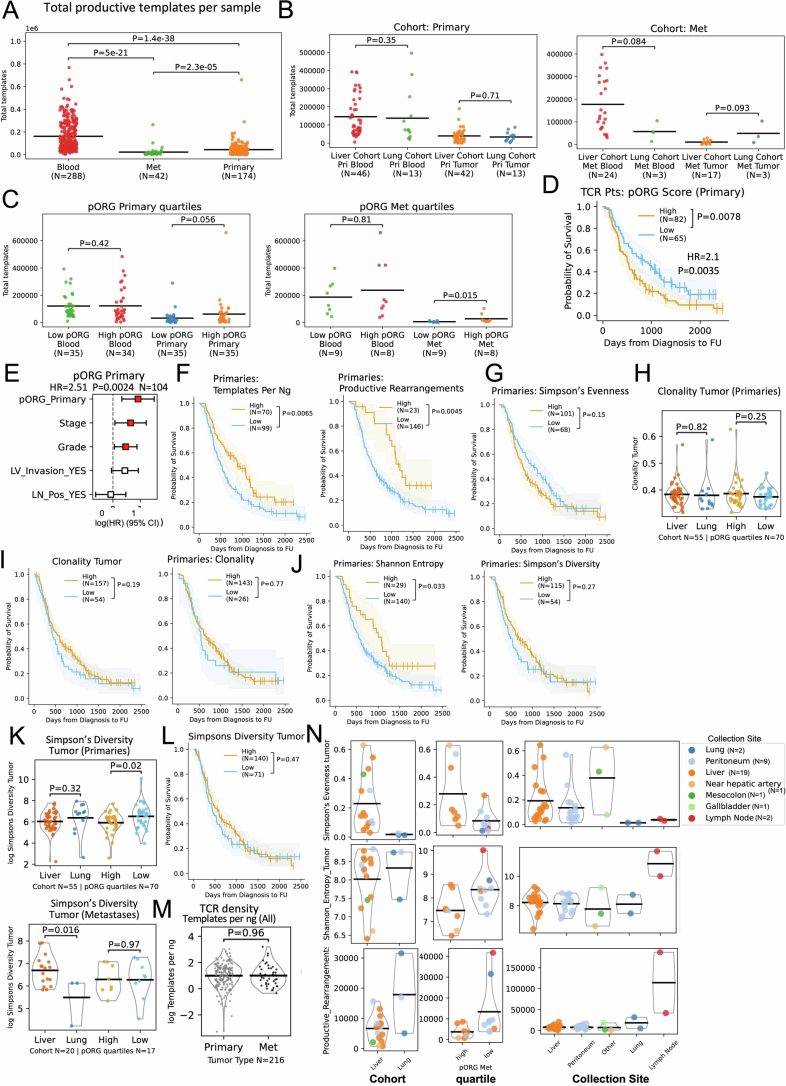
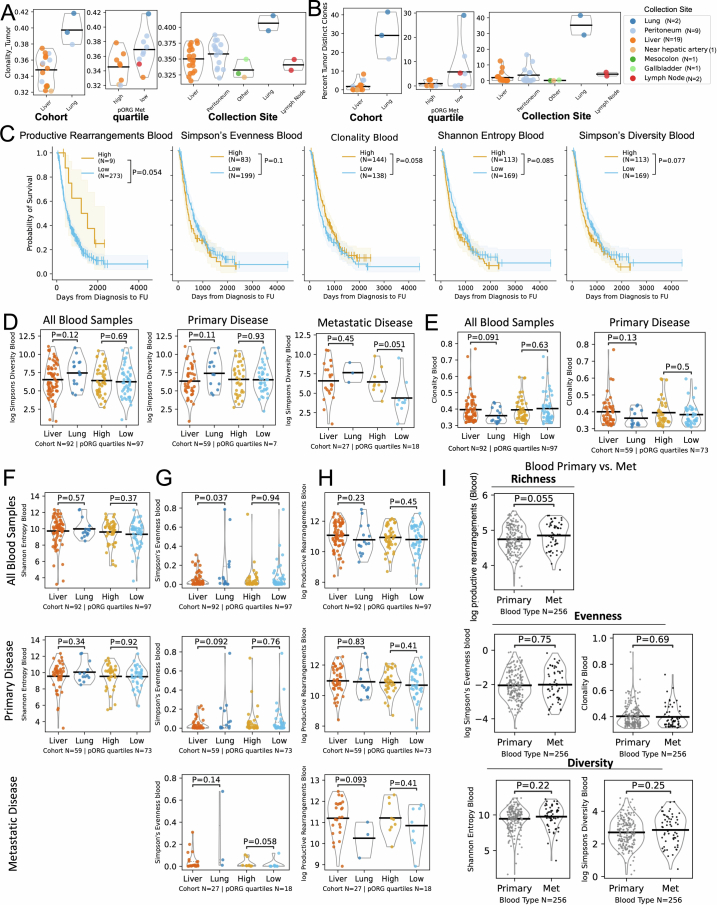
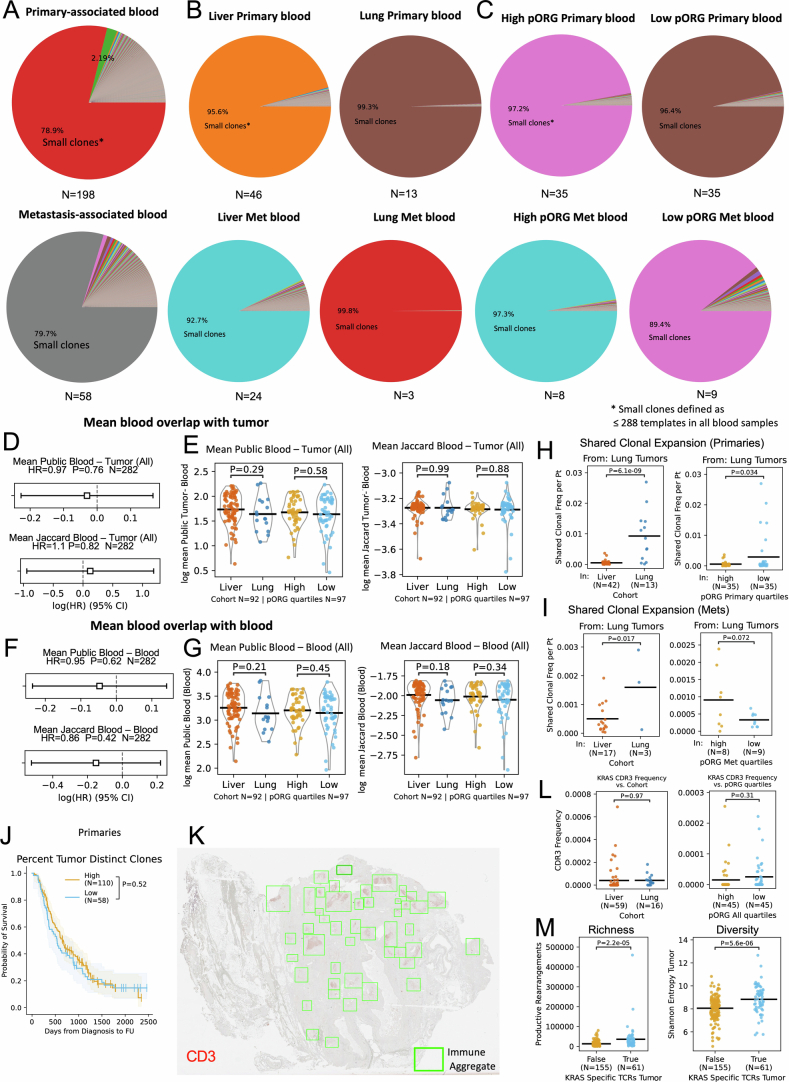
Patients with metastatic pancreatic ductal adenocarcinoma survive longer if disease spreads to the lung but not the liver. Here we generated overlapping, multi-omic datasets to identify molecular and cellular features that distinguish patients whose disease develops liver metastasis (liver cohort) from those whose disease develops lung metastasis without liver metastases (lung cohort). Lung cohort patients survived longer than liver cohort patients, despite sharing the same tumor subtype. We developed a primary organotropism (pORG) gene set enriched in liver cohort versus lung cohort primary tumors. We identified ongoing replication stress response pathways in high pORG/liver cohort tumors, whereas low pORG/lung cohort tumors had greater densities of lymphocytes and shared T cell clonal responses. Our study demonstrates that liver-avid pancreatic ductal adenocarcinoma is associated with tolerance to ongoing replication stress, limited tumor immunity and less-favorable outcomes, whereas low replication stress, lung-avid/liver-averse tumors are associated with active tumor immunity that may account for favorable outcomes.


Conflict of interest statement

Competing interests: Disclosures relevant to PDAC are as follows. R.C.S. declares Scientific Advisory Board (SAB)/consultancy for Rappta Therapeutics, PanCAN, PRECEDE, MOHCCN & PanCuRx Canada and Precision Panc CRUK; sponsored research for Cardiff Oncology, AstraZeneca. G.B.M. declares SAB/consultancy for Amphista, Astex, AstraZeneca, BlueDot, Chrysallis Biotechnology, Ellipses Pharma, ImmunoMET, Infinity, Ionis, Lilly, Medacorp, Nanostring, Nuvectis, PDX Pharmaceuticals, Roche, Signalchem Lifesciences, Tarveda, Turbine and Zentalis Pharmaceuticals; Stock/options/financial for AstraZeneca, Catena Pharmaceuticals, ImmunoMet, SignalChem, Tarveda and Turbine; licensed technology HRD assay to Myriad Genetics and Digital Spatial Profiler patents with Nanostring. L.M.C. declares consulting services for Cell Signaling Technologies, AbbVie, the Susan G Komen Foundation and Shasqi, received reagents and/or research support from Cell Signaling Technologies, Syndax Pharmaceuticals, ZelBio, Hibercell and Acerta Pharma, and participates in advisory boards for Pharmacyclics, Syndax, Carisma, Verseau, CytomX, Kineta, Hibercell, Cell Signaling Technologies, Alkermes, Zymeworks, Genenta Sciences, Pio Therapeutics, PDX Pharmaceuticals, NextCure, the AstraZeneca Partner of Choice Network, the Lustgarten Foundation and the NIH–NCI-Frederick National Laboratory Advisory Committee. J.R.B. declares SAB for Perthera, Advisory for IDEAYA and is an editor for Springer and Taylor & Francis publishing. The other authors declare no competing interests.

Figures

Fig. 1
Fig. 1. Survival outcomes and the primary organotropism gene set distinguish liver or lung recurrence independent of subtype.
a, Kaplan–Meier (K–M) estimates of OS of all patients with documented liver (n = 102 patients (pts.)) and/or lung recurrence (n = 28 and 34 pts.), P = 0.0005 and P = 0.0007. b, OS of patients treated by resection stratified by metastatic cohort; documented liver metastases (n = 84 pts.) or lung metastases without liver metastases (n = 30 pts.; P = 0.0002), recurrent disease at nonliver/lung (other) sites (n = 73 pts.) or no documented recurrence (n = 103 pts.; P = 0.003); K–M estimates (left), CPH single-variable modeling (right). c, CPH multivariable modeling of OS for patients treated by resection stratified by metastatic cohort; lung metastases (P = 0.005), liver metastases (P = 0.27), no documented recurrence (P = 0.81) and recurrent disease at nonliver/lung (other) sites (P = 0.19) combined with clinical covariates significant in single-variable modeling (n = 160 pts. with clinical covariate data). d, K–M estimates of days between resection and recurrence for metastatic cohorts; liver metastases (n = 83 pts.), recurrent disease at nonliver/lung (other) sites (n = 73; P ≤ 0.0001), or lung metastases (n = 29 pts.; P = 0.0005). e, CPH multivariable modeling of days between resection and recurrence, stratified by metastatic cohort; liver metastases (P = 0.0001), lung metastases (P = 0.005) and recurrent disease at nonliver/lung (other) sites (P = 0.14) combined with clinical covariates (n = 104 pts. with clinical covariate data). f, PurIST subtyping scores for primary and metastatic tumor specimens from patients in the liver (n = 85 pts.) and lung (n = 28 pts.; P = 0.025) cohorts. Black bars represent means. P value from two-tailed t-test. g, K–M estimates of OS for patients categorized by PurIST subtype; basal-like (n = 63 pts.) or classical (n = 206 pts.; P = 0.0003) and liver/lung cohorts; liver classical (n = 61 pts.) or lung classical (n = 19 pts.; P = 0.002). h, CPH multivariable modeling of OS for classical subtype lung cohort versus classical subtype liver cohort patients (n = 39 pts.; P = 0.0041) combined with clinical covariates. i, GSVA scores for the pORG (left; liver or lung (n = 76, P = 1.6 × 10−8), basal-like or classical (n = 218, P = 0.38)) and pSUB gene sets (center; liver or lung (n = 76, P = 0.22), basal-like or classical (n = 218, P = 7.1 × 10−27)) and PurIST scores (right; liver or lung (n = 76, P = 0.17), basal-like or classical (n = 218, P = 1.8 × 10−115)) calculated from primary tumors. j, GSVA scores for the pORG (left; liver or lung (n = 37, P = 0.91), basal-like or classical (n = 71, P = 0.39)) and pSUB gene sets (center; liver or lung (n = 37, P = 0.0013), basal-like or classical (n = 71, P = 1.1 × 10−8)) and PurIST scores (right; liver or lung (n = 37, P = 0.043), basal-like or classical (n = 71, P = 5.1 × 10−34)) calculated from metastatic tumors. k, GSVA scores for primaries versus metastases for pORG (top (n = 289, P = 0.91)), pSUB (middle (n = 289, P = 0.39)) and PurIST scores (bottom (n = 289, P = 0.39)). Patients who died <30 days after resection were omitted (ae,g,h). P values between groups indicated with brackets determined by log-rank test, shaded regions represent 95% confidence intervals (CIs), and HR, P value and n are from CPH single-variable modeling (a,b,d,g). HR and associated P value for recurrence site variable was determined by CPH modeling; squares mark the HR estimates, and the horizontal bars represent the 95% CI (b,c,eh). Patients with complete information on covariates were included in CPH multivariable analysis. Black bars represent means; P values were derived from one-way analysis of variance (ANOVA) tests and corrected with the Benjamini–Hochberg method and n indicates number of tumors (ik). FU, follow-up; LN, lymph node; LV, lymph/vascular. Source data
Fig. 2
Fig. 2. pORG predicts survival independently of clinical and genomic features.
a, K–M estimate of OS for patients with primary tumors having high or low pORG (left; high (n = 101 pts.), low (n = 107 pts.; P = 0.01)), pSUB (middle; high (n = 140 pts.), low (n = 68 pts.; P = 4.2× 10⁻⁵)) or PurIST scores (right; high (n = 126 pts.), low (n = 82 pts.; P = 0.00049)) from the OHSU dataset. High/low risk was determined by receiver operating characteristic curve (ROC) and maximum Youden’s index. b, K–M estimate of OS in TCGA pORG (left; high (n = 73 pts.), low (n = 67 pts.; P = 0.032), pSUB (middle; high (n = 99 pts.), low (n = 41 pts.; P = 0.087) or PurIST (right; high (n = 69 pts.), low (n = 71 pts.; P = 0.03)) patients with PDAC. High/low score is defined using cutoff from OHSU dataset. c, CPH multivariable modeling of OS versus primary GSVA score for pORG (top; P = 0.0062), pSUB (middle; P = 0.023) and PurIST (bottom; P = 0.37) with clinical covariates (n = 132 pts.). d, pORG, pSUB and PurIST scores of primaries and metastases (Met) from the same patient, grouped by clinically defined liver cohort (documented liver recurrence, n = 3 pairs) or lung cohort (documented lung recurrence without liver recurrence, n = 4 pairs) showing cohort mean GSVA (point) and 95% CI (error bars). e, pORG and PurIST scores for primaries (circles) and metastases (x) in liver and lung cohorts (n = 113 pts.). f, Fraction of primaries or metastases in each quadrant of the graph in e; liver (n = 85 pts., P = 0.93) or lung (n = 28 pts., P = 0.0012). P values from two-way chi-squared test between primary and metastatic specimens. g, UMAP of Werba et al. scRNA-seq, shaded by per-cell scores for pORG in PDAC primaries (top; n = 17 pts.) and PDAC liver metastases (bottom; n = 10 pts.). h,i, Oncoprints of the top ten altered genes and alteration types (n = 271 tumors) in the DNA dataset (h) and top (above, n = 50 pts.) and bottom quartile (below, n = 50 pts.) (i) by pORG primary GSVA score. j, pORG primary GSVA score versus TP53 (left; altered (n = 131 pts.), WT (n = 70 pts.), FDR = 9.3 × 10−13) or CDKN2A (right; altered (n = 55 pts.), WT (n = 146 pts.), FDR = 0.00052) gene alteration. P value from two-tailed t-test calculated for genes with ≥10 alterations in the dataset, corrected with the Benjamini–Hochberg method. k, CPH multivariable modeling of OS versus pORG GSVA score and genomic alterations prognostic in single-variable CPH modeling in primary tumors (left; n = 193 pts., P = 0.04) and all tumors (right; n = 251 pts., P = 0.014). l, Oncoprints of the top ten altered genes and their alteration types in primaries (left; n = 203 tumors) and metastases (right; n = 68 tumors). The log-rank test P values and n per group are indicated with brackets, shaded regions represent 95% CI, and CPH single-variable modeling HRs and associated P values are displayed on plots (a,b). Frequency is indicated at left, top bars indicate variant types by tumor, and right bars indicate variant types by gene (h,i,l). Alteration key (i). HR and associated P value for GSVA or PurIST score was determined by CPH modeling, squares represent HR estimates, and error bars represent 95% CIs (c,k). Patients who died within 30 days after resection are not shown (a,c,k). Source data
Fig. 3
Fig. 3. High pORG, liver-tropic PDAC is associated with replication stress tolerance and IFN response.
ac, NES colored by FDR P-adjusted (FDR.q) value (FDR.q.val) (from one-way ANOVA) is shown for Hallmark GSEA pathways if any of the comparisons reached a NES > 1.7 and FDR.q < 0.05 from the cohorts indicated on each plot. a, Solid bars, top versus bottom quartile by pORG (n = 108 pts.); hatched bars, liver versus lung cohort (n = 76 pts.). b, Solid bars, top versus bottom quartile by pSUB (n = 108 pts.); hatched bars, top versus bottom quartile by PurIST (n = 108 pts.). c, Solid bars, top versus bottom quartile by pORG in metastases (mets) (n = 34 pts.). d, Mean differential (diff.) VIPER regulon activity scores colored by FDR.q.val (from one-way ANOVA) in top versus bottom quartile by pORG (solid bars, n = 108 pts.) and liver cohort versus lung cohort (hatched bars, n = 76 pts.) primary tumors for regulons related to cell cycle (left), DNA replication (center) and DNA damage repair (right). e, Example immunostaining of epithelial cells (KRT+), proliferation (Ki67+) and algorithmic detection of pRPA foci in PDAC tissue (n = 55 cores imaged in total). f, Mean RS pRPA foci in epithelial cells (left; high pORG (n = 16 pts.), low pORG (n = 18 pts.), P = 0.033) and Ki67+ proliferating epithelial cells (right; high pORG (n = 16 pts.), low pORG (n = 18 pts.), P = 0.036) in each patient determined by immunostaining a TMA with 34 primary specimens, 1–2 cores each. g, K–M estimate of OS for patients with tumors with high or low pORG GSVA scores stratified by tumors with or without a known pathologic somatic alteration (VUS were excluded) in a DDR-related gene (DDR altered high (n = 23 pts.), DDR intact high (n = 73 pts.), DDR altered low (n = 20 pts.) or DDR intact low (n = 77 pts.), P = 0.018). log-rank P value, and shaded regions represent 95% CI. h, pORG GSVA scores for primary tumors (Pri) and metastases (Met) from patients in the liver cohort categorized by a known pathologic somatic alteration (VUS were excluded) in a DDR-related gene (DDR altered (n = 13 tumors) or DDR WT (n = 74 tumors), P = 0.044). i, Pearson correlation (two-sided) of the indicated VIPER regulon scores and pORG GSVA scores (n = 218 pts.). j, Pearson correlation (two-sided) of pORG and IFN- and immune-related signature GSVA scores for primary tumors (n = 210 pts.). Two-tailed Students t-test P value; black bars represent the mean (f,h). P values from Pearson correlation and corrected with the Benjamini–Hochberg method (i,j). *FDR P adjusted < 0.05, **P adjusted < 0.01, ***P adjusted < 0.001. FDR-adjusted P values were 0.0037, 4.7 × 10−6, 3.5 × 10−8, 0.24, 1.8 × 10−9, 2.6 × 10−8, 5 × 10−11, 8 × 10−12, 7.4 × 10−39, n = 218 patients (for i) and 8.8 × 10−5, 1.8 × 10−5, 0.0047, 2 × 10−7, 4.1 × 10−11 (for j), n = 210 patients. Source data
Fig. 4
Fig. 4. Transcriptomic and multiplex imaging evidence of immune suppression in high pORG, liver-tropic tumors.
a, Pearson correlation (two-sided) of xCell deconvolution scores and pORG GSVA score for primary tumors (n = 204 pts.). P values from Pearson correlation and corrected with the Benjamini–Hochberg method. *FDR P adjusted < 0.05, **P adjusted < 0.01, ***P adjusted < 0.001. FDR-corrected P values are 0.198, 9.06 × 10−6, 0.0752, 0.802, 0.123, 2.31 × 10−9, 5.23 × 10−10, 1.26 × 10−16, 2.58 × 10−22, 0.000701, 0.0112, 0.164, 0.0215, 0.0966, 0.0125, 0.000937, 0.0682, 0.281, 0.326, 1.93 × 10−6, 3.54 × 10−5, 0.0215, 0.362, 0.228, 0.462, 0.326, 0.0147, 0.00857, 0.362, 0.018, 0.422 and 0.227. b, Representative images of mIHC staining of a low pORG, lung cohort patient tumor (left) and a high pORG, liver cohort patient tumor (right). n = 12 tissues imaged, 174 ROIs total. c, Average leukocyte densities for primary tumors from patients in the liver cohort (mean pORG 0.23 s.e.m. = 0.11, n = 9 pts.) and lung cohort (mean pORG −0.51 s.e.m. = 0.09, n = 3 pts.) (top). Average leukocyte densities for primary tumors from patients with high pORG (pORG 0.38 s.e.m. = 0.04, n = 7 pts.) and low pORG GSVA scores (mean pORG –0.43 s.e.m. = 0.08, n = 5 pts.) (bottom). DC, dendritic cell. d, Leukocyte densities in ROIs from liver (n = 121 ROIs) or lung cohort (n = 53 ROIs) primaries (top) and high (n = 84 ROIs) or low (n = 90 ROIs) pORG primaries (bottom). Each dot represents an ROI colored by patient specimen (n = 12 patients). Box represents the median and interquartile range (IQR), and whiskers extend 1.5 × IQR. P values from two-tailed t-test corrected with the Benjamini–Hochberg method. FDR-corrected P values are 0.45, 1.1 × 10−8, 0.45, 0.23, 0.001, 0.07, 0.00034, 7.6 × 10−13, 0.98 (top) and 0.0097, 0.00061, 0.049, 0.33, 0.006, 0.31, 5.4 × 10−6, 2 × 10−5, 0.034 (bottom, n = 174 ROIs). e, pORG score from RNA-seq of liver versus lung cohort tumors in the TCRβ dataset, primaries (left; liver (n = 38 pts.), lung (n = 11 pts.), P = 1.7 × 10−5) and metastases (right: liver (n = 20 pts.), lung (n = 5 pts.), P = 0.47). P values from two-tailed t-test. Black bars represent the means. f, K–M estimation of OS of patients with high (n = 106 pts.) versus low (n = 82 pts.; P = 0.0054) pORG GSVA scores (left; cutoff determined by ROC and maximum Youden’s index in the full dataset in Fig. 2a) and liver (n = 76 pts.) versus lung cohort (n = 16 pts.; P = 0.097) patients (right) in the TCRβ dataset. log-rank test P values and n patients per group are indicated with brackets and shaded regions represent 95% CI. CPH single-variable modeling HR and associated P values are displayed on plots. Source data
Fig. 5
Fig. 5. Tumoral TCRβ repertoire richness, diversity associated with low pORG tumors; clonality decreases in metastases, but not in low pORG, lung metastases.
a, TCRβ templates per ng of DNA sequenced in primary tumors (top; liver or lung (n = 55 pts., P = 0.19), pORG quartiles high or low (n = 70 pts., P = 0.028)) and metastases (bottom; liver or lung (n = 20 pts., P = 0.14), pORG quartiles high or low (n = 17 pts., P = 8 × 10−5)) in liver versus lung and high (top quartile) versus low (bottom quartile) pORG tumors. b, The number of unique productive rearrangements of TCRβ templates in primary tumors (top; liver or lung (n = 55 pts., P = 0.75), high or low (n = 70 pts., P = 0.007)) and metastases (bottom; liver or lung (n = 20 pts., P = 0.077), high or low (n = 17 pts., P = 0.01)), grouped by the indicated cohorts. c,d, K–M estimates of OS of patients with high versus low templates per ng (c) (high (n = 107 pts.) or low (n = 104 pts.), P = 0.00012) and productive rearrangements (d) in all tumors (high (n = 25 pts.) or low (n = 186 pts.), P = 0.0011). e, Simpson’s evenness estimation of TCRβ repertoire evenness in primary tumors (top; liver or lung (n = 55 pts., P = 0.19), high or low (n = 70 pts., P = 0.24)) and metastases (bottom; liver or lung (n = 20 pts., P = 0.007), high or low (n = 17 pts., P = 0.034)), grouped by the indicated cohorts. P values from Kruskal–Wallis H-test; dashed lines represent the median and IQR. f, K–M estimates of OS of patients with high (n = 35 pts.) versus low (n = 176 pts.; P = 0.022) Simpson’s evenness. g, Shannon entropy estimation of TCRβ repertoire diversity in primary tumors (top; liver or lung (n = 55 pts., P = 0.63), high or low (n = 70 pts., P = 0.0013)) and metastases (bottom; liver or lung (n = 20 pts., P = 0.51), high or low (n = 17 pts., P = 0.031)), grouped by the indicated cohorts. h, K–M estimates of OS of patients with high (n = 31 pts.) versus low (n = 180 pts.; P = 0.007) Shannon entropy. i, The indicated TCR metrics in metastases (Met) versus primary tumors grouped by related TCR metrics; productive rearrangement (n = 216 pts., P = 0.028), Simpson’s evenness estimation (n = 216 pts. P = 1.2 × 10−5), clonality (n = 216 pts., P = 2.9 × 10−5), Shannon entropy estimation (n = 216 pts., P = 0.99) and Simpson’s diversity estimation (n = 216 pts., P = 0.0079). j, Pie charts of fraction of each CDR3 sequence in TCRβ repertoires of primary tumors (n = 174 pts.) or metastases (n = 42 pts.). The largest slice is all the small clones (those present in less than or equal to one template per patient on average in tumor samples) and each smaller slice of pie is an expanded clone present at greater than one template per patient on average across the tumors. k, Tumor TCRβ clonality in high/low (n = 17 pts., P = 0.051) pORG or liver/lung cohorts (n = 20 pts., P = 0.00038) in metastases. l, Clonality (left; liver or lung (n = 27 pts., P = 0.31), high or low (n = 18 pts., P = 0.016)) and Simpson’s diversity (right; liver or lung (n = 27 pts., P = 0.91), high or low (n = 18 pts., P = 0.026)) in bloods collected from patients with metastases, grouped by the indicated cohorts. High/low cutoff determined with the ROC and maximum Youden’s index for each metric, log-rank P value and n per group shown with bracket, and shaded regions represent 95% CI (c,d,f,h). Patients who died within 30 days after resection are not shown. P values were derived from a one-way ANOVA; black bars represent the mean (a,b,g,i,k,l). Source data
Fig. 6
Fig. 6. Shared, clonal TCR responses in low pORG, lung cohort tumors.
a,b, Number and fraction of TCRβ clonotypes that are shared with other tumor clonotypes in the dataset, quantified as (log) mean public overlap and (log) mean Jaccard index (intersection of two sets over the union of two sets), respectively. Primary tumors’ mean public overlap (left; liver or lung (n = 55 pts., P = 0.69), pORG quartile high or low (n = 70 pts., p = 0.009)) and Jaccard index (right; liver or lung (n = 55 pts., P = 0.49), high or low (n = 70 pts., P = 0.033)) of each tumor with each other tumor sample, grouped by the indicated cohorts (a). Metastatic tumors’ (mets) mean public overlap (left; liver or lung (n = 20 pts., P = 0.088), pORG quartile high or low (n = 17 pts., P = 0.0084)) and Jaccard index (right; liver or lung (n = 20 pts., P = 0.18), pORG quartile high or low (n = 17 pts., P = 0.0057)), grouped by the indicated cohorts (b). c, Mean public overlap (left; liver or lung (n = 75 pts., P = 0.25), high or low (n = 90 pts., P = 0.0064)) and Jaccard indices (right; liver or lung (n = 75 pts., P = 0.21), high or low (n = 90 pts., P = 0.01)) of tumors’ overlap with each blood sample, grouped by the indicated cohorts. d, K–M estimates of OS of patients with high versus low mean public clonotypes (top) of all tumor samples’ (left; high (n = 26 pts.) or low (n = 185 pts.), P = 0.0071) or primary tumor samples’ (right; high (n = 24 pts.) or low (n = 145 pts.), P = 0.027) and Jaccard index (bottom) of all tumor samples’ (left; high (n = 26 pts.) or low (n = 185 pts.), P = 0.0096) or primary tumor samples’ (right; high (n = 148 pts.) or low (n = 21 pts.), P = 0.00099) overlap with tumor TCRβ repertoires. e, K–M estimates of OS of patients with high versus low mean public overlap (left; high (n = 29 pts.) or low (n = 182 pts.), P = 0.013) and Jaccard index (right; high (n = 31 pts.) or low (n = 180 pts.), P = 0.022) of all tumor samples’ overlap with blood repertoires. f, Number of shared, dominantly clonal CDR3 clonotypes from lung (left; liver (n = 59), lung (n = 16), P = 0.036), liver (center; liver (n = 59), lung (n = 16), P = 0.79) and all tumors (right; liver (n = 59), lung (n = 16), P = 0.36) present in each patient’s repertoire in liver versus lung cohort (top row). Number of shared, dominantly clonal CDR3 clonotypes from lung (left; high (n = 45), low (n = 45), P = 0.0025), liver (center; high (n = 45), low (n = 45), P = 0.015) and all tumors (right; high (n = 45), low (n = 45), P = 0.013) present in each patient’s repertoire in high versus low pORG quartiles (bottom row). g, Productive frequency of all shared, dominantly clonal CDR3 clonotypes from lung (left; liver (n = 59), lung (n = 16), P = 8.8 × 10−10), liver (center; liver (n = 59), lung (n = 16), P = 0.13) and all tumors (right; liver (n = 59), lung (n = 16), P = 0.24) present in each patient’s repertoire in liver versus lung cohort (top row). Productive frequency of all shared, dominantly clonal CDR3 clonotypes from lung (left; high (n = 45), low (n = 45), P = 0.042), liver (center; high (n = 45), low (n = 45), P = 0.092) and all tumors (right; high (n = 45), low (n = 45), P = 0.38) present in each patient’s repertoire in high versus low pORG (bottom row). P values were obtained by one-way ANOVA; black bars represent the mean (ac). High/low cutoff determined with the ROC and maximum Youden’s index; P values were determined by a log-rank test and shaded regions represent 95% CI (d,e). Patients who died within 30 days after resection are not shown. P values are from a two-tailed t-test, black bars represent the mean, and n indicates the number of patients (f,g). Source data
Fig. 7
Fig. 7. T cell clonal expansion within tumors associated with better outcome.
a, The percentage of unique tumor TCRβ CDR3 sequences with ≥10 templates detected in tumor samples, but not in patient matched blood samples; all tumors (left; liver or lung (n = 74 pts., P = 0.01), pORG quartile high or low (n = 89 pts., P = 0.51)), primary tumors (center; liver or lung (n = 55 pts., P = 0.29), high or low (n = 69 pts., P = 0.21)) and metastatic tumors (right; liver or lung (n = 19 pts., P = 0.0068), high or low (n = 17 pts., P = 0.4)) from the indicated cohorts. P values from Kruskal–Wallis H-test; dashed lines represent median and IQR. b, K–M estimates of OS of patients with high (n = 150 pts.) versus low (n = 58 pts.; P = 0.022) tumor-distinct clones. High/low cutoff determined with the ROC and maximum Youden’s index. c, Percent tumor-distinct clones in primary tumors versus metastases (n = 213 pts., P = 1.2 × 10−5). P values were derived from a from one-way ANOVA. d, Correlation between tumor-distinct clones and tumor TCRβ clonality quantified by 1 − normalized Shannon entropy for primaries (left; r and P value from Pearson correlation (n = 173 pts., P = 1.12 × 10−5)) and metastases (right; r and P value from Spearman correlation (n = 40 pts., P = 0.00083)). The line represents a linear regression and shaded regions show the 95% CI. e, The percentage of tumor-distinct clones in tumors with the presence (n = 57 pts.) or absence (n = 91 pts.; P = 0.037) of pathologist-identified TLSs. f, Representative mIHC images of LAs in lung/low pORG (top) and liver/high pORG (bottom) primary tumors; n = 12 images collected. g, LA area in primary tumors from patients in the liver cohort (nine patients (n = 166 LAs evaluated)) versus lung cohort (three patients (n = 68 LAs; P = 0.00159)) (top) or high pORG (seven patients (n = 106 LAs)) versus low pORG (five patients (n = 128 LAs; P = 8.4 × 10−8)) (bottom). Each point represents one immune aggregate colored by patient specimen. h, K–M estimates of OS of patients containing at least one putative mutant KRAS-specific TCRβ sequence within their TCR repertoire in tumors (top; present (n = 60 pts.), not detected (n = 151 pts.), P = 0.011) or blood (bottom; present (n = 199 pts.), not detected (n = 84 pts.), P = 0.57) for all patients. i, Number of putative mutant KRAS-specific TCRβ sequences within the TCR repertoire of each tumor (primary and metastasis) in liver versus lung cohort (left; liver (n = 59 pts.), lung (n = 16 pts.), P = 0.0005) and the top versus bottom quartile of pORG tumors by GSVA scores from all tumors (right; high (n = 45 pts.), low (n = 45 pts.), P = 0.024). j, CDR3 frequency of putative mutant KRAS-specific TCRβ sequences in samples containing them in liver versus lung cohort (left; liver (n = 16 pts.), lung (n = 11 pts.), P = 0.12) and the top versus bottom quartile of pORG tumors by GSVA scores from all patients (right; high (n = 8 pts.), low (n = 18 pts.), P = 0.44). k, Percent tumor-distinct clones in tumors with (n = 61 pts.) or without (n = 155 pts.; P = 0.046) putative KRAS-specific TCRβ sequences in the tumor. Black bars represent the mean (c,e,g,ik). P values from two-tailed t-test (e,g,ik). P values were determined by a log-rank test and shaded regions represent 95% CI (b,h). Patients who died within 30 days after resection are not shown. Source data
Extended Data Fig. 1
Extended Data Fig. 1. Survival and clinical characteristics of metastatic cohort and subtype.
A) Kaplan–Meier (K–M) estimates of days from resection to follow-up for resected patients with known liver (N = 84 patients) and/or lung metastases (N = 30 patients, P = 0.003), other recurrence site (neither liver nor lung, N = 73 patients) or no documented recurrence (N = 103 patients, P = 0.005). B) K–M estimates of survival after liver (N = 83) or lung (N = 29, P = 0.053) recurrence. C) Kendall tau correlation (for censored data) between survival after liver (N = 83, P = 2.6e-14) or lung (N = 29, P = 0.031) recurrence and survival after resection. D) Kendall tau correlation between time to recurrence after resection and survival after liver (N = 83, P = 0.3) or lung (N = 29, P = 0.87) recurrence. E) Venn diagram of patient overlap (left, RNA-seq (N = 277), DNA-seq (N = 260], TCR-seq tumor (N = 216], TCR-seq blood (N = 288], and table of number of specimens (right, RNA-seq [N = 289], DNA-seq [N = 271], TCR-seq tumor [N = 216], TCR-seq blood [N = 288] with the indicated analyses. F) K–M estimates of days between resection and recurrence for all basal-like (N = 29) vs classical (N = 101, P = 0.01) patients, and all liver cohort (N = 43) vs lung cohort (N = 15, P = 0.004) classical patients. For the two patients with more than one specimen analyzed, the resected primary tumor was used for subtype assignment. G-H) Fraction of patients in liver or lung cohort with different clinical covariates, that is, male or female (N = 165, P = 0.71), age <= 70 or > 70 (N = 165, P = 0.48), stage (N = 163, P = 0.14), grade (N = 100, P = 0.054), LN positive (N = 113, P = 0.35), and LN invasion (N = 82, P = 0.91). I) Fraction of patients in liver or lung cohort receiving a resection (left, [N = 165, P = 0.011]) and the ratio of resected patients receiving neoadjuvant chemotherapy (right, [N = 115, P = 0.19]). J) K–M estimates of overall survival of resected patients stratified by neoadjuvant treatment (Neo) in the liver cohort (no neo [N = 66], neo [N = 18, P = 0.79 or lung cohort (no neo [N = 20], neo [N = 10, P = 0.92]), categorized by PurIST tumor subtype basal-like (no neo [N = 39], neo [N = 9, P = 0.64] or classical (no neo [N = 122], neo [N = 37, P = 0.56]), pORG primary high (no neo [N = 84], neo [N = 13, P = 0.23]) or pORG primary low (no neo [N = 71], neo [N = 32, P = 0.56] and pSUB primary high (no neo [N = 108], neo [N = 25, P = 0.013]) or pSUB primary low (no neo [N = 47], neo [N = 20, P = 0.00333]). A-B, F, J) Patients who died <30 days after resection were omitted. P values between groups indicated with brackets determined by log-rank test and shaded regions represent 95% confidence intervals. N=number of patients. C-D) Statistic and P value from two-sided Kendall tau correlation. N=number of patients. G-I) P value from Chi-squared test. N=number of patients. Source data
Extended Data Fig. 2
Extended Data Fig. 2. Organotropism and subtype association with histology, recurrence, and cell type.
A) Fraction of patients in liver or lung cohort with different inflammatory features scored by a pathologist from hematoxylin and eosin (H&E) stained slides from the primary tumor that is, inflammation (N = 59, P = 0.35), TLS (N = 59, P = 0.95), and plasmacytoid inflammation (N = 59, P = 0.15). B) Fraction of patients in liver or lung cohort with different inflammatory features scored from metastatic tumor H&E slides that is, Metastases inflammation (N = 28, P = 1.0), TLS met (N = 28, P = 0.045), and plasmacytoid inflammation met (N = 28, P = 6.6e-5). C) Fraction of patients in liver or lung cohort with perineural invasion (PNI) from primary (N = 59, P = 2.0) or metastatic tumors (N = 28, P = 0.18) and angiolymphatic invasion (ALI) scored from H&E slides from the primary tumor (N = 59, P = 0.73) or metastatic tumor (N = 28, P = 0.7). D) Fraction of patients in liver or lung cohort with desmoplasia scored from H&E slides from the primary tumor (left, [N = 59, P = 0.97]) or metastatic tumor (right, [N = 28, P = 0.18]). E) Kaplan–Meier (K–M) estimates of recurrence-free survival (RFS) in OHSU patients split into high and low pORG (high,[N = 101], low [N = 107, P = 0.00062]), pSUB (high [N = 140], low [N = 68, P = 0.00013]) and PurIST (high [N = 126], low [N = 40, P = 0.021]) by cutoffs from Fig. 2d. F) K–M estimates of RFS in ICGC patients split into high and low pORG (high [N = 47], low [N = 82, P = 0.03]), pSUB (high [N = 59], low [N = 28, P = 0.001]) and PurIST (high [N = 26], low [N = 51, P = 0.0038]) by same cutoffs as OHSU patients. G-H) GSVA scores of matched primaries and mets from the same patient for PurIST (left, [N = 10 pts., P = 0.31]), pSUB (center, [N = 10 pts., P = 0.77]) and pORG (right, [N = 10 pts., P = 0.32]). G) colored by patient, P value from two-side Wilcoxon signed-rank test and H) grouped by met collection site showing mean GSVA (point) and 95% confidence intervals (error bars) (N = 10 pts. for all cohorts). I-J) Single-cell RNA-seq data from Werba G et al. (2023). I) UMAP of 17 primary PDAC tumors colored by cell types (top) and corresponding expression of cell type markers in each population (bottom). J) UMAP of 10 PDAC liver metastases colored by cell types (left) and corresponding cell type marker expression (right). K) pSUB module scores in primary tumors (left) and PDAC liver metastases (right). A-D) P value from chi-squared test. Plasmacytoid inflammation defined as the presence of plasma cells in a background of chronic inflammation (that is lymphocytes). Lymphoid aggregates/tertiary lymphoid structures (TLS) are specifically defined as clusters of lymphocytes forming a reactive germinal center in the tissue. PNI: Perineural invasion requires the carcinoma invades into the perineurial space around nerves. ALI: angiolymphatic invasion, defined as the presence of tumor cells within venous or lymphatic spaces. Desmoplasia is defined as dense fibrosis with elastin and collagen deposition around invading tumor cells. N=number of patients. E-F) P values between groups indicated with brackets determined by log-rank test and shaded regions represent 95% confidence intervals. N=number of patients. Source data
Extended Data Fig. 3
Extended Data Fig. 3. Genomic alterations associated with metastatic cohort, organotropism, and subtype.
A-C) Oncoprints indicating the top ten most frequently altered genes and their alteration types in primary tumors in the top quartile (left) versus bottom quartile (right) by A) pSUB primary GSVA score (top quartile [N = 50], or bottom quartile [N = 50]) B) PurIST primary score (top quartile [N = 50], bottom quartile [N = 50]) and C) liver (left, [N = 55]) and lung (right, [N = 16]) cohort primary tumors. D-F) Oncoprints indicating the top ten most frequently altered DDR-relevant genes and their alteration types in primary tumors in the top quartile (left) versus bottom quartile (right) by D) pSUB primary GSVA score (top quartile [N = 50], bottom quartile [N = 50] E) PurIST primary score and F) liver (left, [N = 55]) and lung (right, [N = 16]) cohort primary tumors. G-J) Oncoprints indicating the top ten most frequently altered genes and their alteration types in metastatic tumors in the top quartile (left) versus bottom quartile (right) by G) pORG metastatic GSVA score (top quartile [N = 16], bottom quartile [N = 16]) H) pSUB metastatic GSVA score (top quartile [N = 16], bottom quartile [N = 16]) I) PurIST metastatic score (top quartile [N = 16], bottom quartile [N = 16]) and J) liver (left, [N = 26]) and lung (right, [N = 16]) cohort metastatic tumors. A-J) To the left of each panel is the gene alteration frequency in the cohort, the top bars indicate variant types by tumor, and right bars indicate variant types by gene. Variant type legend in lower right of figure. N=number of patients. Source data
Extended Data Fig. 4
Extended Data Fig. 4. Gene alteration and tumor cellularity association with organotropism, subtype, distant recurrence, and survival.
A-C) Gene alteration status (Altered or WT) versus GSVA score of A) pORG in primary tumors that is KRAS (altered [N = 170], WT [N = 31, FRD = 0.091]), CDKN2B (altered [N = 7], WT [N = 194, FDR = 0.068]), SMAD4 (altered [N = 37], WT [N = 164, FDR = 0.091]), GATA1 (altered [N = 41], WT [N = 160, FDR = 0.068]), and ELF3 (altered [N = 7], WT [N = 194, FDR = 0.068]). B) pORG in metastases that is TP53 (altered [N = 47], WT [N = 20, FDR = 0.00048]). C) PurIST in metastases that is MTAP (altered [N = 10], WT [N = 57, FDR = 0.014]), CDKN2A (altered [N = 23], WT [N = 44, FDR = 0.019]), and CDKN2B (altered [N = 6], WT [61, FDR = 0.0022]). D) Cox proportional hazard multi-variable modeling of overall survival versus PurIST (primary [N = 193, P = 0.00049] or all [N = 251, P = 3.1e-05]) or pSUB (primary [N = 193, P = 3e-06], or all [N = 251, P = 4.8e-07]) GSVA score combined with genomic alterations that were prognostic in single-variable CPH. HR and associated P value for variable in bold was determined by CPH modeling. Squares indicate hazard ratio estimates, and error bars show 95% confidence interval. Patients who died within 30 days after resection are not shown. E) Fraction of tumors altered for genes with significantly different alteration frequency between primaries and mets that is MTAP (N = 260, Fisher’s P = 0.0024, FDR = 0.077), SMARCB1 (N = 260, Fisher’s P = 0.013, FDR = 0.12), KDM5C (N = 2600, Fisher’s P = 0.011, FDR = 0.12) and GATA1 (N = 260, Fisher’s P = 0.015, FDR = 0.12). P value from Fisher’s exact test corrected with the Benjamini/Hochberg method. F) Alteration status of genes with at least one alteration in nine patients with matched primaries and mets that is ATM (N = 9, McNemar’s P = 0.5), ATRX (N = 9, McNemar’s P = 1.0), CDKN2A (N = 9, McNemar’s P = 0.38), CDKN2B (N = 9, McNemar’s P = 1.0), GATA1 (N = 9, McNemar’s P = 0.25), KDM5C (N = 9, McNemar’s P = 0.25), GNAS (N = 9, McNemar’s P = 2.0), KRAS (N = 9, McNemar’s P = 1.0), MTAP (N = 9, McNemar’s P = 0.25), NOTCH1 (N = 9, McNemar’s P = 1.0), PBRM1 (N = 9, McNemar’s P = 1.0), RBM10 (N = 9, McNemar’s P = 0.5), SMAD4 (N = 9, McNemar’s P = 1.0), SMARCB1 (N = 9, McNemar’s P = 1.0), TGFBR2 (N = 9, McNemar’s P = 1.0), and TP53 (N = 9, McNemar’s P = 1.0). P value from McNemar’s test. G) Histogram of number of alteration differences between matched primary and met from the same patient (N = 9 patients with DNA sequencing). H) The percentage of tumor cells in primary tumor samples analyzed by RNA-seq determined by mutant allele frequencies from the amplicon-based, high-throughput sequencing of 595 genes on the Tempus xT genomic alteration panel for the indicated comparisons that is lung or liver (N = 70, P = 0.66) classical or basal-like PurIST subtype (N = 201, P = 0.015), low or high pORG primary quartiles (N = 102, P = 0.0023), and low or high pSUB primary quartiles (N = 99. P = 1e-05). I). The percentage of tumor cells in metastatic tumor samples analyzed by RNA-seq determined as in (C) for the indicated comparisons that is lung or liver (N = 35, P = 0.14) classical or basal-like PurIST subtype (N = 66, P = 0.63), low or high pORG met quartiles (N = 32, P = 0.51), and low or high pSUB met quartiles (N = 33. P = 0.67). A-C) For genes with >10 alterations in the dataset, P values obtained from two-tailed t-test and corrected with the Benjamini/Hochberg method. Black bars represent means. N=number of patients. H-I) P values from two-tailed t-test. Black bars represent means. N=number of patients. Source data
Extended Data Fig. 5
Extended Data Fig. 5. Organotropism and subtype association with recurrence site and biological processes.
A) Heatmap of GSVA scores of MSigDB “Hallmark” gene sets with NES > 1.7 and FDR.Q < 0.05 by GSEA for top versus bottom quartile by pORG. Primary tumor samples (columns) are ordered from highest-to-lowest by pORG score. N = 212 pts. B) pORG score of primary tumors in liver, lung, other site or no documented recurrence metastatic cohorts that is liver or lung (N = 59 and N = 24, FDR = 3.7e-07), liver or no documented recurrence (N = 59 and N = 86, FDR = 2.1e-05), liver or other site recurrence (N = 59 and N = 56, FDR = 0.016), lung or no documented recurrence (N = 24 and N = 86, FDR = 0.016), lung or other site recurrence (N = 24 and N = 56, FDR = 0.00082), and no documented recurrence or other site recurrence (N = 86 and N = 56, FDR = 0.079). P values obtained from two-tailed t-test and corrected with the Benjamini/Hochberg method. Black bars represent means. N=number of patients. C) Heatmap of Hallmark GSVA scores with NES > 1.7 and FDR.Q < 0.05 by GSEA for top versus bottom quartile by pSUB. Primary tumor samples (columns) are ordered from highest-to-lowest by pSUB score. N = 212 pts. D-E) Enrichment map depicting Gene Ontology (GO) biological process enrichment results for the top 300 VIPER regulons significantly increased (by one-way ANOVA; FDR.Q-value ≤ 0.05) in D) top pORG primary tumors compared to bottom pORG (N = 108 pts.), or E) liver cohort primary tumors compared to lung cohort (N = 76 pts.). Top regulons were selected by order of greatest increase in mean regulon score for (D) top pORG samples or (E) liver cohort samples. Up to 150 enriched GO terms (points) are shown, but only the top 3 most significant terms within each cluster (large colored circles) are labeled. GO terms were arranged into clusters based on their semantic similarity. Point size scales with the number of regulons annotated with the indicated GO term. Edges connecting GO terms indicate a Jaccard similarity of at least 0.2 (scaled by width). Source data
Extended Data Fig. 6
Extended Data Fig. 6. Relationship of organotropism to replication stress, tolerance of DDR-pathway alteration and immune infiltration.
A) pRPA foci per epithelial cell (left, liver [N = 9], lung [N = 4, P = 0.26]) and per Ki67+ epithelial cell (right, liver [N = 9], lung [N = 4, P = 0.4]) in liver versus lung cohort primary tumors on the TMA. B) Percent of epithelial cells positive for pRPA foci for pORG high or low (N = 16 and N = 17, P = 0.055) and liver versus lung cohort (N = 9 and N = 3, P = 0.26) C) Percent of proliferating epithelial cells positive for pRPA foci for pORG high or low (N = 16 and N = 17, P = 0.048) and liver versus lung cohort (N = 9 and N = 3, P = 0.44). D) Percent of pRPA+ epithelial cells that are proliferating for pORG high or low (N = 12 and N = 16, P = 0.018) and liver versus lung cohort (N = 7 and N = 3, P = 0.38). E) Kaplan–Meier estimates of overall survival for patients with tumors with high or low pORG GSVA scores stratified by tumors with or without a non-silent somatic alteration in a DDR-related gene that is DDR altered high (N = 34), DDR altered low (N = 29), DDR intact high (N = 62), and DDR intact low (N = 68, P = 0.0073). P value determined by log-rank test and shaded regions represent 95% confidence intervals. F) VIPER regulon scores in liver versus lung cohort for genes CD3G (N = 72, FDR = 0.25), MS4A1 (N = 72, FDR = 0.062), MX1 (N = 72, FDR = 0.062), STAT1 (N = 72, FDR = 0.062), IFNAR1 (N = 72, FDR = 0.25) and IFNAR2 (N = 72, FDR = 0.82). G) Pearson correlation of marker gene expression from RNA-seq and pORG GSVA score for primary tumors (Exact FDR values are 0.24, 0.43, 0.026, 5.9e-06, 0.0018, 0.44, 0.11, na, 1.9e-09, 6.6e-11, 0.0008, 0.24, 0.0018, 6.4e-05, N = 204). H) Pearson correlation of deconvolution algorithm scores and pORG GSVA score for primary tumors. Deconvolution algorithms include QTS: quanTIseq; MCP: MCP-counter; EPC: EPIC (see Methods, exact FDR values are 0.062, 7e-20, 1.2e-08, 2.2e-17, 0.012, 0.7, 0.1, 0.1, 0.012, 0.0017, 0.0053, 0.01, 0.025, 0.005,0.034, 0.1, 0.012, 2.5e-07, 0.0008, 0.81, 0.0029, 0.0001, na, 0.84, 0.095, 0.68, 0.45, 0.065, 0.45, N = 204). I) mIHC mean cell density per patient for each indicated cell type that is CD4 T helper cells (N = 12, FDR = 0.19), immature DC (N = 12, FDR = 0.22), B cells (N = 12, FDR = 0.22), and T regulatory CD4 cells (N = 12, FDR = 0.22) significant at the ROI cohort level in lung versus liver cohort primaries (top) and low versus high pORG score primaries (bottom) that is CD4 T helper cells N = 12, FDR = 0.43), granulocytes (N = 12, FDR = 0.43), Macrophage (N = 12, FDR = 0.43), immature DC (N = 12, FDR = 0.43), B cells (N = 12, FDR = 0.43), T-regulatory. Each dot represents a patient. A-D) Each data point is the average across two primary tumor TMA cores imaged per patient in high and low pORG or liver and lung cohort groups. P values from two-tailed t-test. Black bars represent the means. N=number of patients. F, I) P values from two-tailed t-test corrected with Benjamini/Hochberg method. Black bars represent the means. N=number of patients. G, H) FDR corrected P values from two-sided Pearson correlation with pORG GSVA score, *** FDR < 0.001 ** FDR < 0.005 * FDR < 0.05. N=number of patients. Source data
Extended Data Fig. 7
Extended Data Fig. 7. Association of tumoral TCR sequences and organotropism, patient outcome or recurrence site.
A-C) Total productive TCRβ templates sequenced per patient in A) blood samples or samples from primary or metastatic tumors (blood versus primary [N = 288 and N = 174, P = 1e-38], blood versus met [N = 289 and N = 42, P = 4.7e-21] and primary versus met [N = 174 and N = 42, P = 2.3e-05]) or blood or tumor samples from B) primary liver or lung cohort (left, liver versus lung blood [N = 46 and N = 13, P = 0.35], liver versus lung tumor [N = 42 and N = 13, P = 0.71]) or metastatic liver or lung cohort (right, liver versus lung blood [N = 24 and N = 3, P = 0.084], liver versus lung tumor [N = 17 and N = 3, P = 0.093]) or C) high or low pORG primary (left, low versus high pORG blood [N = 35 and N = 34, P = 0.42], low versus high pORG primary [N = 35 and N = 35, P = 0.056]) or metastatic (right, low versus high pORG blood [N = 9 and N = 8, P = 0.81], or low versus high pORG met [N = 9 and N = 8, P = 0.015]) cohort samples. Primary tumors and blood collected during primary resectable disease and metastatic tumors and blood collected during metastatic disease. D) Kaplan–Meier (K–M) estimation of overall survival (OS) in primary tumor sampled patients in the TCRβ dataset with high (N = 82) versus low (N = 65, P = 0.0078) pORG GSVA scores. E) Cox proportional hazards multi-variable modeling of OS versus TCRβ dataset patient’s primary tumor pORG GSVA score with clinical covariates (N = 104, P = 0.0024). HR and associated P value for variable in bold was determined by CPH modeling. Hazard ratios indicated by boxes and 95% confidence intervals by error bars. F-G) K–M estimate of OS of patients with high versus low F) templates per nanogram (ng) (left, high [N = 70] or low [N = 99, P = 0.0065]) or productive rearrangements (right, high [N = 23] or low [N = 146, P = 0.0045]) or G) Simpson’s evenness in primary tumors (high [N = 101] or low [N = 68, P = 0.15]). H) Tumor TCRβ Clonality in high/low pORG (N = 70, P = 0.25) or liver/lung (N = 55, P = 0.82) cohorts in primaries. I) K–M estimate of OS of patients with high versus low Clonality in all tumors (left, high [N = 157] or low [N = 54, P = 0.19]) and primary tumors (right, [N = 143] or low [N = 26, P = 0.77]). J) K–M estimate of OS of patients with high versus low TCRβ Shannon entropy (left, high [N = 29] or low [N = 140, P = 0.033]) and Simpson’s diversity (right, high [N = 115] or low [N = 54, P = 0.27]) in primary tumors. K) TCRβ Simpson’s diversity in high/low pORG or liver/lung cohorts in primary tumors (top, high or low pORG [N = 70, P = 0.02], liver or lung [N = 55, P = 0.32]) or metastases (bottom, high or low pORG [N = 17, P = 0.97], liver or lung [N = 20, P = 0.016]). L) K–M estimate of OS of patients with high (N = 140) versus low (N = 71, P = 0.47) TCRβ Simpson’s diversity. M) Templates per nanogram (ng) in all primary tumors and metastases (N = 216, P = 0.96). N) The indicated TCR metrics in metastatic tumors colored by collection site of metastasis that is lung (N = 2), peritoneum (N = 9), liver (N = 19), near hepatic artery (N = 1), mesocolon (N = 1), gallbladder (N = 1), or lymph node (N = 2), grouped by liver versus lung cohort (left), high versus low pORG quartiles (center), and metastatic collection site based on surgical and radiologic notes (right). Black bars represent the means A-C) P values from two-tailed Mann-Whitney U test, black bars represent the means. N=number of patients. D, F-G, I-J, L) High/low cutoff determined with the max Youden index. P values between groups indicated with brackets determined by log-rank test and shaded regions represent 95% confidence intervals. Patients who died within 30 days after resection are not shown. N=number of patients. H, K, M) P values from one-way ANOVA, black bars represent the means. N=number of patients. Source data
Extended Data Fig. 8
Extended Data Fig. 8. Association of blood TCR sequences and organotropism, patient outcome or disease progression.
A-B). Metastatic tumors’ TCRβ repertoire A) Clonality and B) tumor-distinct clones that is, found in tumor but not matched blood, colored by collection site of metastasis, i.e lung (N = 2), peritoneum (N = 9), liver (N = 19), near hepatic artery (N = 1), mesocolon (N = 1), gallbladder (N = 1), or lymph node (N = 2), grouped by liver versus lung cohort (left), high versus low pORG quartiles (center), and metastatic collection site based on surgical and radiologic notes (right). C) Kaplan–Meier estimate of overall survival of patients with high versus low TCR metrics in blood samples that is productive rearrangement (high [N = 130] or low [N = 62, P = 0.02]), Simpson’s evenness (high [N = 83], or low [N = 199, P = 0.1]), clonality (high [N = 144], or low [N = 138, P = 0.058]), Shannon entropy (high [N = 113], or low [N = 169, P = 0.085]) and Simpson’s diversity (high [N = 113], or low [N = 169, P = 0.077]). High/low cutoff determined with the ROC max Youden index. P values between groups indicated with brackets determined by log-rank test and shaded regions represent 95% confidence intervals. Patients who died within 30 days after resection are not shown. N=number of patients. D) TCR Simpson’s diversity (1- Simpson’s D) in all (left, liver or lung [N = 92, P = 0.12], high or low pORG quartiles [N = 97, P = 0.69)), primary- associated (center liver or lung [N = 59, P = 0.11], high or low pORG quartiles [N = 7, P = 0.93]), and metastatic blood (right, liver or lung [N = 27, P = 0.45], high or low pORG quartiles [N = 18, P = 0.051]).E) TCR Clonality (that is 1 – Normalized Shannon Entropy) in all (left, liver or lung [N = 92, P = 0.091], high or low pORG quartiles [N = 97, P = 0.63]) and primary-associated blood (right, liver or lung [N = 59, P = 0.13], high or low pORG quartiles [N = 73, P = 0.5]) F-H) TCR metrics in all blood samples (top), blood collected from patients at the time of primary resectable disease (center) and collected during metastatic disease (bottom) from the indicated cohorts. Metrics are F) Shannon entropy in all blood samples (top, liver or lung [N = 92, P = 0.57], high or low pORG quartiles [N = 97, P = 0.37]), and at time of primary resectable disease (center, liver or lung [N = 59, P = 0.34], high or low pORG quartiles [N = 73, P = 0.92]).G) Simpson’s evenness in all blood samples (top, liver or lung [N = 92, P = 0.037], high or low pORG quartiles [N = 97, P = 0.94]), at time of primary resectable disease (center, liver or lung [N = 59, P = 0.092], high or low pORG quartiles [N = 73, P = 0.76]), and during metastatic disease (bottom, liver or lung [N = 27, P = 0.14], high or low pORG quartiles [N = 18, P = 0.058]). H) (log) number of unique productive rearrangements of TCRβ templates in all blood samples (top, liver or lung [N = 92, P = 0.23], high or low pORG quartiles [N = 97, P = 0.45]), at time of primary resectable disease (center, liver or lung [N = 59, P = 0.83], high or low pORG quartiles [N = 73, P = 0.41]), and during metastatic disease (bottom, liver or lung [N = 27, P = 0.093], high or low pORG quartiles [N = 18, P = 0.41) I) TCR metrics for richness (N = 256, P = 0.055), evenness that is Simpson’s evenness (left, [N = 256, P = 0.75) and clonality (right, [N = 256, P = 0.69]) and diversity that is Shannon entropy (left, [N = 256, P = 0.22]), and Simpson’s diversity (right, [N = 256, P = 0.25]) in blood collected from patients at the time of primary resectable disease or collected during metastatic disease. D-I) P values one-way ANOVA or from Kruskal–Wallis H-test for plots with dashed lines. A-B, D-I) black bars represent the means, or dashed line represent median and interquartile range. N=number of patients. Source data
Extended Data Fig. 9
Extended Data Fig. 9. Association of organotropism or KRAS-specific TCRs with clonal expansion.
A-C) Pie charts of fraction of each cohorts’ repertoire made up of expanded clones, where the largest slice is all the small clones, that is those present in less than or equal to one template per patient on average in the blood and each additional slice of pie is an expanded clone present at greater than 1 template per patient on average across the blood samples. Comparisons are as follows: A) Blood from patients with primary-associated (N = 198 pts.) or metastatic-associated (N = 58 pts.) disease, B) Blood from patients in the liver (primary [N = 46 pts.], metastatic [N = 24 pts.]) or lung cohort with primary (N = 13 pts.) or metastatic (N = 3 pts.) disease, C) Blood from patients in the high (primary [N = 35 pts.], metastatic [N = 8 pts.]) or low pORG cohort with primary (N = 35 pts.) or metastatic (N = 9 pts.) disease. D) Cox proportional hazards (CPH) modeling of overall survival (OS) for mean public overlap (top, [N = 282, P = 0.76]) and Jaccard index (bottom, [N = 282, P = 0.82]) of blood samples with each tumor’s clonotypes. E) Mean public overlap (left, liver or lung [N = 92, P = 0.29], high or low pORG quartile [N = 97, P = 0.58]) and Jaccard index (right, liver or lung [N = 92, P = 0.99], high or low pORG quartile [N = 97, P = 0.88]) of blood samples with each tumor’s clonotypes in liver versus lung and high versus low pORG cohorts. F) CPH modeling of OS versus mean public clones (top, [N = 282, P = 0.62]) and Jaccard overlap (bottom, [N = 282, P = 0.42]) of blood samples with each blood sample’s clonotypes. G) Mean public overlap (left, liver or lung [N = 92, P = 0.21], high or low pORG quartile [N = 97, P = 0.45]) and Jaccard index (right, liver or lung [N = 92, P = 0.18], high or low pORG quartile [N = 97, P = 0.34]) of blood samples with each blood sample’s clonotypes of cohorts as in (E). H) CDR3 frequency of all shared clonal sequences from lung present in each patient’s primary tumor repertoire in liver (N = 42) versus lung (N = 13, P = 6.1e-09) cohort (left) and high (N = 3) versus low (N = 35, P = 0.034) pORG primaries (right). I) CDR3 frequency of all shared clonal clonotypes from lung present in each patient’s metastatic tumor repertoire in liver (N = 17) versus lung (N = 3, P = 0.017) cohort (left) and high (N = 8) versus low (N = 9, P = 0.072) pORG metastases (right). J) Kaplan–Meier estimate of OS for patients with high (N = 110) versus low (N = 58, P = 0.52) tumor-distinct clones in primaries. P values between groups indicated with brackets determined by log-rank test and shaded regions represent 95% confidence intervals. K) Example of identification of lymphoid aggregates in mIHC data; Defined as CD20+ cells clustered with CD3+ cells present. N = 12 tissues analyzed. L) CDR3 frequency of putative mutant KRAS-specific TCRβ sequences in tumor samples in liver (N = 59) versus lung (N = 16, P = 0.97) cohort (left) and the top (N = 45) versus bottom (N = 45, P = 0.31) quartile of pORG tumors by GSVA scores from all patients (right). M) TCRβ repertoire richness (left, true [N = 61], false [N = 155, P = 2.2e-05]) and diversity (right, true [N = 61]. False [N = 155, P = 5.6e-06]) in tumors with and without putative mutant KRAS-specific sequences in tumor. D, F, J) Patients who died within 30 days after resection are not shown. N=number of patients. E-G) P values from one-way ANOVA, black bars represent the means. N=number of patients. H-M) P values from two-tailed t-test, black bars represent the means. N=number of patients. Source data

Similar articles

Cited by

References

    1. Downs-Canner, S. et al. The indolent nature of pulmonary metastases from ductal adenocarcinoma of the pancreas. J. Surg. Oncol.112, 80–85 (2015). - PMC - PubMed
    1. He, C., Huang, X., Zhang, Y., Lin, X. & Li, S. The impact of different metastatic patterns on survival in patients with pancreatic cancer. Pancreatology21, 556–563 (2021). - PubMed
    1. Wangjam, T. et al. Resected pancreatic ductal adenocarcinomas with recurrence limited in lung have a significantly better prognosis than those with other recurrence patterns. Oncotarget6, 36903–36910 (2015). - PMC - PubMed
    1. Link, J. M. et al. Tumor-infiltrating leukocyte phenotypes distinguish outcomes in related patients with pancreatic adenocarcinoma. JCO Precis. Oncol.5, 344–356 (2021). - PMC - PubMed
    1. Arnaoutakis, G. J. et al. Pulmonary resection for isolated pancreatic adenocarcinoma metastasis: an analysis of outcomes and survival. J. Gastrointest. Surg.15, 1611–1617 (2011). - PMC - PubMed

MeSH terms

Grants and funding