. 2025 Jan 9;8(1):7.
doi: 10.1038/s42004-024-01403-z.

Excited state dynamics of azanaphthalenes reveal opportunities for the rational design of photoactive molecules

Affiliations

Excited state dynamics of azanaphthalenes reveal opportunities for the rational design of photoactive molecules

Malcolm Garrow et al. Commun Chem. .

Abstract

Various photoactive molecules contain motifs built on aza-aromatic heterocycles, although a detailed understanding of the excited state photophysics and photochemistry in such systems is not fully developed. To help address this issue, the non-adiabatic dynamics operating in azanaphthalenes under hexane solvation was studied following 267 nm excitation using ultrafast transient absorption spectroscopy. Specifically, the species quinoline, isoquinoline, quinazoline, quinoxaline, 1,6-naphthyridine, and 1,8-naphthyridine were investigated, providing a systematic variation in the relative positioning of nitrogen heteroatom centres within a bicyclic aromatic structure. Our results indicate considerable differences in excited state lifetimes, and in the propensity for intersystem crossing vs internal conversion across the molecular series. The overall pattern of behaviour can be explained in terms of potential energy barriers and spin-orbit coupling effects, as demonstrated by extensive quantum chemistry calculations undertaken at the SCS-ADC(2) level of theory. The fact that quantum chemistry calculations can achieve such detailed and nuanced agreement with experimental data across a full set of six molecules exhibiting subtle variations in their composition provides an excellent example of the current state-of-the-art and is indicative of future opportunities for rational design of photoactive molecules.


Conflict of interest statement

Competing interests: The authors declare no competing interests.

Figures

Fig. 1
Fig. 1. Schematic chemical structures of the six azanaphthalene molecules considered in this study.
Quinoline and isoquinoline have a single N centre at two distinct positions in the ring, quinazoline and quinoxaline have two N centres at distinct positions in the same ring, and 1,6-naphthyridine and 1,8-naphthyridine have two N centres with one N atom per ring. Position numbering around the ring system is also indicated, which is referenced in parts of the Discussion.
Fig. 2
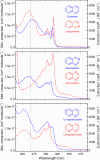
Fig. 2. Room-temperature absorption cross-sections in hexane.
(Top) quinoline (blue/solid), isoquinoline (red/dashed), (Middle) quinazoline (blue/solid), quinoxaline (red/dashed), (Bottom) 1,6-naphthyridine (blue/solid), 1,8-naphthyridine (red/dashed). Data were obtained using a simple Beer–Lambert law analysis (see section “Methods”). The vertical dashed lines indicate the central 267 nm pump wavelength used in our TAS measurements. No additional spectral features appear in the range 390–800 nm.
Fig. 3
Fig. 3. Chirp-corrected transient absorption spectra as a function of time (ps) and wavelength (nm) for all six molecules under study in hexane upon 267 nm excitation.
Note the mixed linear-logarithmic scaling of the pump–probe time-delay axis. For clarity, the plots only include a subgroup of the complete pump–probe delay dataset (individual plotted spectra are spaced by 200 fs in the linear region and the logarithmic region shows every second time-delay sampled).
Fig. 4
Fig. 4. Chirp-corrected transient absorption spectra of quinazoline following 267 nm pump excitation.
Raw data (left), a three-exponential function fit to these data using the procedure outlined in the text (centre), and the associated residual—i.e. the raw data minus the fit (right). Equivalent data for quinoxaline and 1,8-naphthyridine are presented in Supplementary Fig. 2. For clarity, the plots only show a subset of the complete pump–probe delay dataset (individual plotted spectra are spaced by 200 fs in the linear region and the logarithmic region where every second step is shown). All recorded timesteps beyond +250 fs are used in the fitting process.
Fig. 5
Fig. 5. Decay-associated spectra (DAS) obtained for all six molecules under study.
Plots are generated from a wavelength-dependent fitting analysis applied to the chirp-corrected TAS data (see Fig. 4). See the text for further details.
Fig. 6
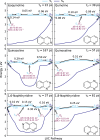
Fig. 6. Potential energy profiles of the photorelaxation pathways from S3 (S4 for 1,6- and 1,8- naphthyridine) onto the S1 surface, for all six molecules, computed using SCS-ADC(2)/cc-pVDZ.
The profiles start at the ground-state equilibrium geometry and are linearly interpolated between minimum energy conical intersections (MECIs) and excited-state minima. For clarity, we only show the active state involved along the pathway to the S1 (1nπ*) minimum (see Supplementary Fig. 5 for an additional version of this figure including all inactive states). We note that isoquinoline, quinoline and 1,6-naphthyridine have multiple S1 minima, all of which are accessible via the pathways shown here, however, only one is included for simplicity. These additional minima are discussed later in the text and are included in Fig. 7. The dominant electronic character of each excited-state minimum is denoted in brackets.
Fig. 7
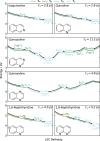
Fig. 7. Potential energy profiles along the S1 surface leading to the S1/S0 MECIs, performed at the SCS-MP2/SCS-ADC(2)/cc-pVDZ level.
These profiles have been computed using linear interpolation in internal coordinates (LIIC) between excited-state minima, the connecting transition states, and S1/S0 MECIs except between the S1 (1nπ*) minimum and TS5, TS6, TS10 and TS11, in quinazoline, 1,6-naphthyridine and 1,8-naphthyridine respectively, where minimum energy pathway (MEP) calculations were performed. The S1 minima are denoted by their dominant electronic character (1ππ* and 1nπ*). Additionally, the approximate locations of the S1/T2 MECPs are indicated by grey arrows, with their relative energies compared to the nearest S1 minimum and spin–orbit coupling (SOC) values given in purple.
Fig. 8
Fig. 8. Key geometrical changes in quinazoline during the overall relaxation process.
Firstly, a shows the changes in the C–N–C bond angles due to the nitrogen-centred ring in-plane bend, which occurs as the molecule decays to the S1 state from the initially excited ππ* state. Secondly, b displays the typical out-of-plane distortion, which occurs as the S1/S0 MECIs are approached from the S1 (1nπ*) minimum. Data are representative of behaviour seen in all six systems under study.

References

    1. Werner, E. R., Blau, N. & Thöny, B. Tetrahydrobiopterin: biochemistry and pathophysiology. Biochem. J.438, 397–414 (2011). - PubMed
    1. Hunger, K. & Schmidt, M. U. Industrial Organic Pigments (Wiley-VCH, 2018).
    1. Andrade, P. & Carneiro, M. Pterin-based pigmentation in animals. Biol. Lett.17, 20210221 (2021). - PMC - PubMed
    1. Kalaria, P. N., Karad, S. C. & Raval, D. K. A review on diverse heterocyclic compounds as the privileged scaffolds in antimalarial drug discovery. Eur. J. Med. Chem.158, 917–936 (2018). - PubMed
    1. Kerru, N., Gummidi, L., Maddila, S., Gangu, K. K. & Jonnalagadda, S. B. A review on recent advances in nitrogen-containing molecules and their biological applications. Molecules25, 1909 (2020). - PMC - PubMed

LinkOut - more resources