. 2025 Feb;57(2):461-468.
doi: 10.1038/s41588-024-02044-7. Epub 2025 Jan 9.

A scalable variational inference approach for increased mixed-model association power

Affiliations

A scalable variational inference approach for increased mixed-model association power

Hrushikesh Loya et al. Nat Genet. 2025 Feb.

Abstract

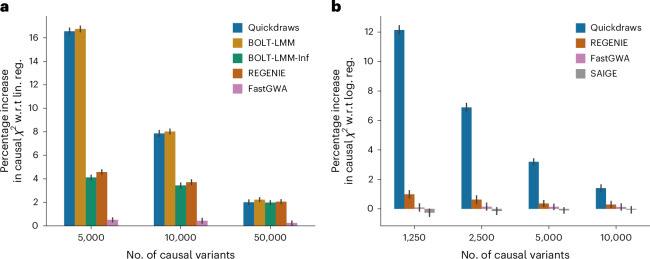
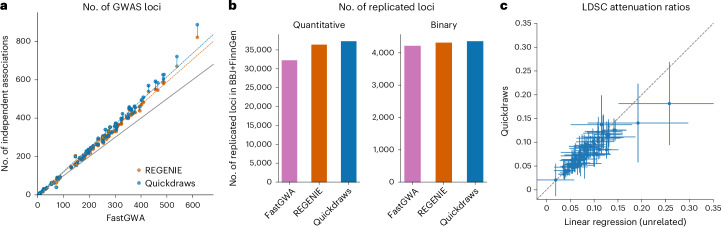
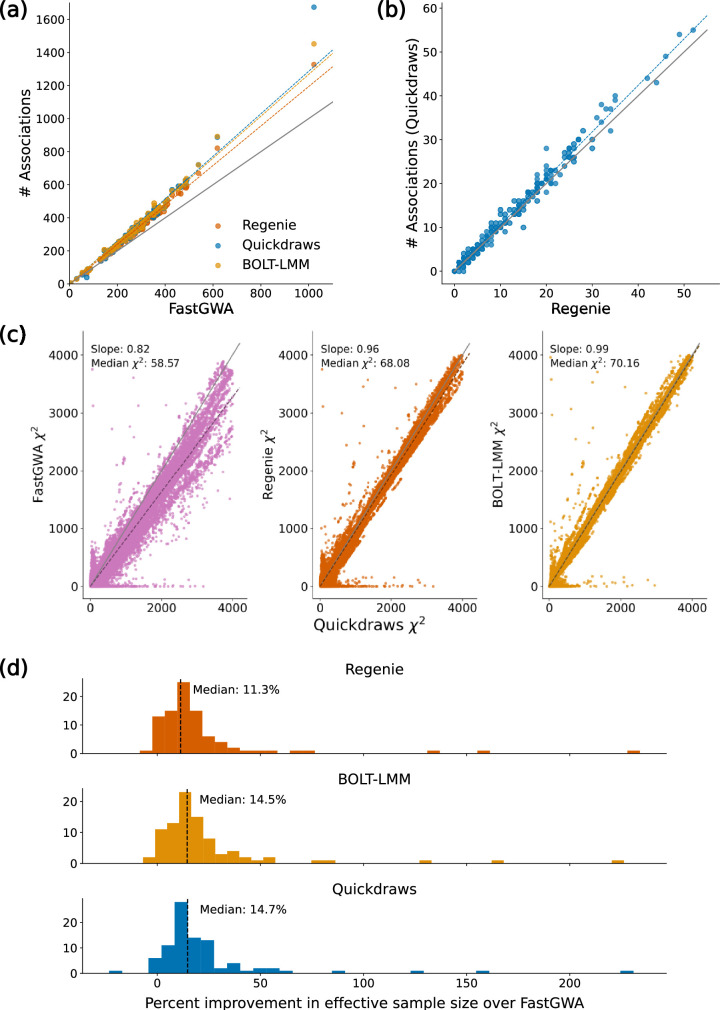
The rapid growth of modern biobanks is creating new opportunities for large-scale genome-wide association studies (GWASs) and the analysis of complex traits. However, performing GWASs on millions of samples often leads to trade-offs between computational efficiency and statistical power, reducing the benefits of large-scale data collection efforts. We developed Quickdraws, a method that increases association power in quantitative and binary traits without sacrificing computational efficiency, leveraging a spike-and-slab prior on variant effects, stochastic variational inference and graphics processing unit acceleration. We applied Quickdraws to 79 quantitative and 50 binary traits in 405,088 UK Biobank samples, identifying 4.97% and 3.25% more associations than REGENIE and 22.71% and 7.07% more than FastGWA. Quickdraws had costs comparable to REGENIE, FastGWA and SAIGE on the UK Biobank Research Analysis Platform service, while being substantially faster than BOLT-LMM. These results highlight the promise of leveraging machine learning techniques for scalable GWASs without sacrificing power or robustness.


Conflict of interest statement

Competing interests: The authors declare no competing interests.

Figures

Fig. 1
Fig. 1. Statistical power in simulated quantitative and binary traits for unrelated British samples.
a, Percentage increase in average χ2 test statistics at causal variants with respect to (w.r.t.) linear regression (lin. reg.) for quantitative traits, varying the number of simulated causal variants from 5,000 to 50,000 variants. b, Percentage increase in average χ2 test statistics at causal variants with respect to logistic regression (log. reg.) for binary traits, varying the number of simulated causal variants from 1,250 to 10,000 variants. Traits in a and b are simulated for 50,000 samples with h2 = 0.4; the prevalence is fixed to 30% for binary traits in b. Error bars are presented as mean value ± s.e. of the percentage improvement, measured using 50 independent traits. The causal χ2 is normalized by the mean χ2 at null variants for each trait.
Fig. 2
Fig. 2. Power and calibration in real-data analysis.
a, Comparison of the number of GWAS loci identified using Quickdraws, REGENIE and FastGWA. The vertical lines connect dots representing the same trait for Quickdraws and REGENIE (results including height are shown in Extended Data Fig. 3a). b, Total number of replicated loci in Biobank Japan (BBJ) using summary statistics from each method for quantitative and binary traits. c, Attenuation ratio of Quickdraws (N ≈ 405,000) versus linear regression in unrelated samples (N ≈ 337,000). The vertical and horizontal lines represent mean ± s.e. in the attenuation ratio estimate for each method.
Extended Data Fig. 1
Extended Data Fig. 1. Power and FPR in N = 405k simulation.
(a) The mean χ2 at causal variants across different methods and polygenicities for Quantitative traits, and prevalence for binary traits. The χ2 at causal variants is not normalized by the χ2 at null variants in this plot. (b) The mean false positive rates (FPR) at 0.005 calculated at null variants across different methods and polygenicities for Quantitative traits, and prevalence for binary traits. The simulation was performed using the N≈ 405,000 set of white British individuals (See Methods for more details on simulations). The error bars represent 95% confidence intervals. The red dashed line corresponds to false positive rate = 0.005.
Extended Data Fig. 2
Extended Data Fig. 2. Power and FPR in N= 460k simulation.
(a) The mean χ2 at causal variants across different methods and polygenicities for quantitative traits, and prevalence for binary traits. The χ2 at causal variants is not normalized by the χ2 at null variants in this plot. (b) The mean false positive rates (FPR) at 0.005 calculated at null variants across different methods and polygenicities for Quantitative traits, and prevalence for binary traits. The simulation was performed using the N≈ 460,000 set of UK Biobank self-identified Europeans [5]. The error bars represent 95% confidence intervals. The red dashed line corresponds to false positive rate = 0.005.
Extended Data Fig. 3
Extended Data Fig. 3. Approximately independent loci and effective sample size in UK Biobank analysis.
(a) Number of approximately independent loci after plink clumping in FastGWA (x-axis) vs. Regenie, BOLT-LMM, and Quickdraws for 79 quantitative traits. (b) Number of approximately independent loci after plink clumping in Regenie (x-axis) vs. Quickdraws for 250 randomly sampled plasma protein traits. (c) The χ2 for 79 quantitative traits and N= 405k UK Biobank set conditioned on genome-wide significance (p = 5 × 10⁻⁸) in linear regression run on unrelated subset of the data (N= 337k). Median χ2: FastGWA = 58.57, Regenie = 68.08, BOLT-LMM = 70.16, Quickdraws = 70.64. (d) Histogram of the effective-sample size increase compared to FastGWA for 79 quantitative traits, measured as the mean χ2 minus 1 at genome-wide significant variants inferred though linear regression run on unrelated subset of the data (N= 337k). For (a-c), the gray line represents the y=x line and the dashed lines represent a linear regression fit for each method, for (d) the dashed line represents the median improvement in effective sample-size across traits. In (c), the slope refers to the linear regression slope of the χ2 values between each pair of methods.
Extended Data Fig. 4
Extended Data Fig. 4. Phenotype prediction analyses in the UK Biobank.
(a) Held-out mean phenotype prediction R2 comparing step 1 posterior estimates from Quickdraws, BOLT-LMM and BOLT-LMM-Inf. (b) Comparing Quickdraws’ step 1 posterior estimates with PGS calculated using Quickdraws’ association statistics and P+T (Pruning and thresholding as implemented in PRSice) or PRS-CS. (c-d) Comparing predictive power for PGS calculated using association statistics from different GWAS methods and different PGS methods, (c) P+T as implemented in PRSice and (d) PRS-CS. All analyses were performed on 27,683 held-out non-British Europeans, 9,044 self-identified south Asians, 1,457 self-identified east Asians and 7,204 self-identified African or African American samples. Results are aggregated across the 79 quantitative traits we analyzed, and the error bars represent 95% confidence interval of the mean prediction R2 for each method in each population subgroup.
Extended Data Fig. 5
Extended Data Fig. 5. Replication analysis in Biobank Japan and Finngen.
(a) The χ2 in UK Biobank conditioned on genome-wide significance (p = 5 × 10⁻⁸) in replicating biobank across GWAS methods. The variants are aggregated across traits, quantitative and binary traits for Regenie and FastGWA, and only quantitative traits for BOLT-LMM. The gray line represents the y = x line, and the dashed line the linear regression fit without intercept. Median χ2 for quantitative traits: FastGWA = 28.36, Regenie = 33.44, BOLT-LMM = 34.47 Quickdraws = 36.32; binary traits: FastGWA-GLMM = 14.08, Regenie = 14.34, Quickdraws = 14.51. (b-c) Replication Venn diagram for (b) 30 overlapping quantitative traits in Biobank Japan and (c) 23 overlapping binary traits in Biobank Japan and Finngen. (d-e) Number of replicated variants vs replication rate for (d) quantitative and (e) binary traits. The discovery threshold was fixed to 5 × 10⁻⁹ and the replication threshold was varied from 5 × 10⁻² to 5 × 10⁻⁸. The error bars represent standard errors around the mean calculated using block jack-knife across chromosomes for 30 quantitative and 23 binary traits. The dashed line represents a cubic spline fit to the datapoints. In (a), the slope represents the linear regression slope of the χ2 values between methods, and in (b-c), the percentages indicate the proportion of associations found in the union of all methods.

Similar articles

Cited by

References

    1. Abdellaoui, A., Yengo, L., Verweij, K. J. & Visscher, P. M. 15 years of GWAS discovery: realizing the promise. Am. J. Human Genet.110, 179–194 (2023). - PMC - PubMed
    1. Khera, A. V. et al. Genome-wide polygenic scores for common diseases identify individuals with risk equivalent to monogenic mutations. Nat. Genet.50, 1219–1224 (2018). - PMC - PubMed
    1. Craig, J. E. et al. Multitrait analysis of glaucoma identifies new risk loci and enables polygenic prediction of disease susceptibility and progression. Nat. Genet.52, 160–166 (2020). - PMC - PubMed
    1. Klarin, D. & Natarajan, P. Clinical utility of polygenic risk scores for coronary artery disease. Nat.Rev. Cardiol.19, 291–301 (2022). - PMC - PubMed
    1. Bycroft, C. et al. The uk biobank resource with deep phenotyping and genomic data. Nature562, 203–209 (2018). - PMC - PubMed

LinkOut - more resources