. 2025 Jan 9;8(1):30.
doi: 10.1038/s42003-024-07401-0.

Human iPSC-derived microglial cells protect neurons from neurodegeneration in long-term cultured adhesion brain organoids

Affiliations

Human iPSC-derived microglial cells protect neurons from neurodegeneration in long-term cultured adhesion brain organoids

Xianwei Chen et al. Commun Biol. .

Abstract

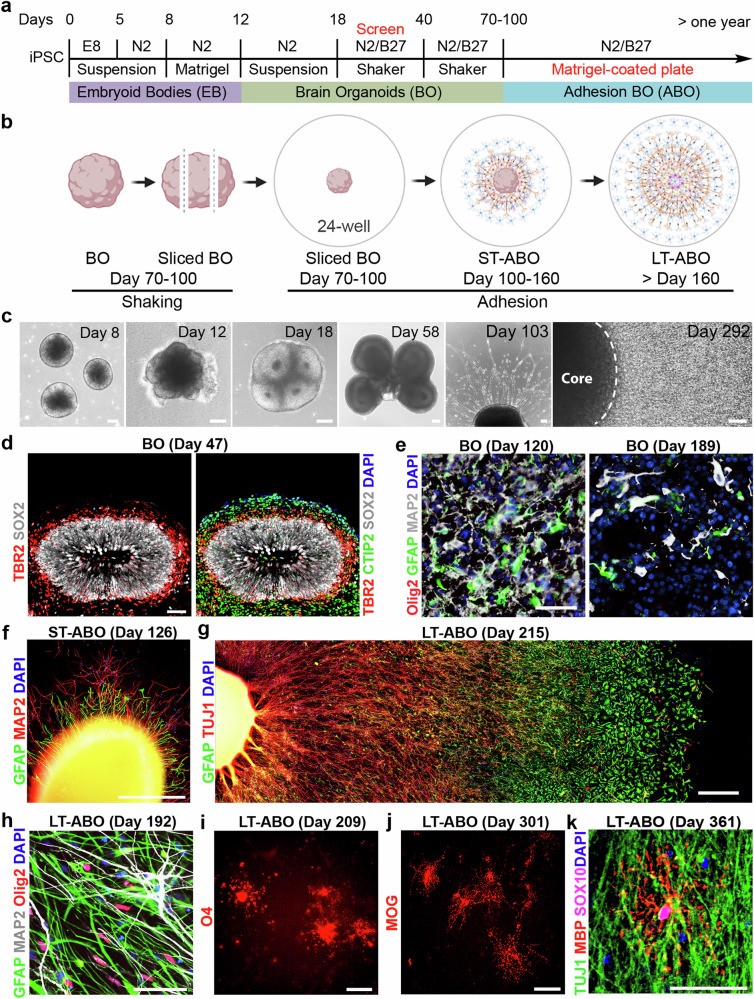
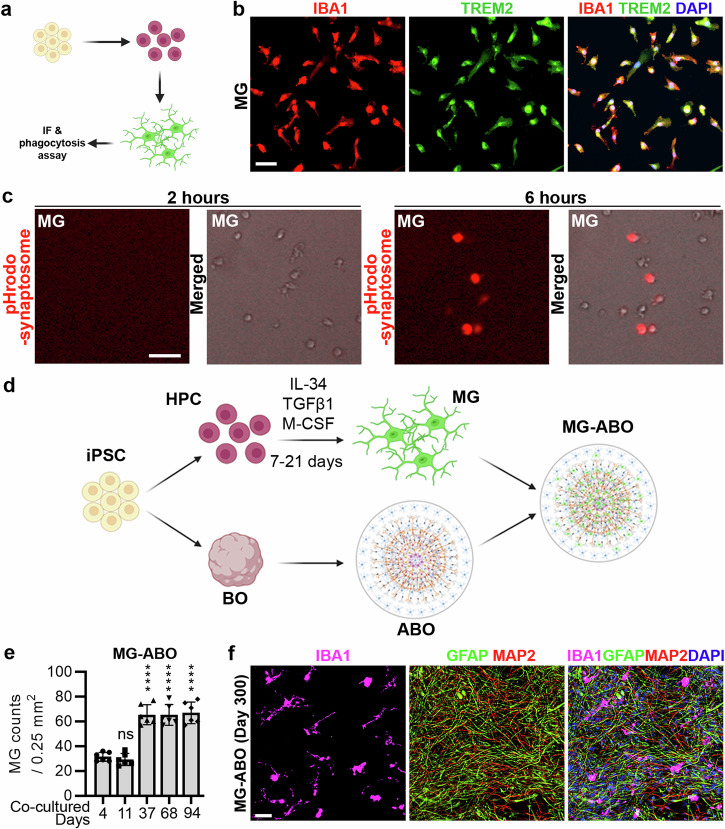
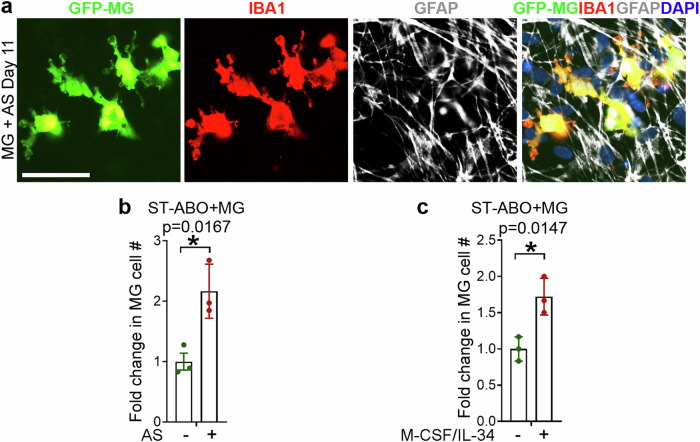
Brain organoid models have greatly facilitated our understanding of human brain development and disease. However, key brain cell types, such as microglia, are lacking in most brain organoid models. Because microglia have been shown to play important roles in brain development and pathologies, attempts have been made to add microglia to brain organoids through co-culture. However, only short-term microglia-organoid co-cultures can be established, and it remains challenging to have long-lasting survival of microglia in organoids to mimic long-term residency of microglia in the brain. In this study, we developed an adhesion brain organoid (ABO) platform that allows prolonged culture of brain organoids (greater than a year). Moreover, the long-term (LT)-ABO system contains abundant astrocytes and can support prolonged survival and ramification of microglia. Furthermore, we showed that microglia in the LT-ABO could protect neurons from neurodegeneration by increasing synaptic density and reducing p-Tau level and cell death in the LT-ABO. Therefore, the microglia-containing LT-ABO platform generated in this study provides a promising human cellular model for studying neuron-glia and glia-glia interactions in brain development and the pathogenesis of neurodegenerative diseases such as Alzheimer's disease.


Conflict of interest statement

Competing interests: The authors declare no competing interests.

Figures

Fig. 1
Fig. 1. Development of the adhesion brain organoid (ABO) system.
a Schematic illustration of brain organoid (BO) and ABO protocol. b Schematic illustration of the method for generating ABO. c Representative bright-field images of embryoid body (EB), BO, and ABO at different stages. ST-ABO: day 103; LT-ABO: day 292. The “core” area in the ABO represents the location of the originally seeded BO in a well of a 24-well plate. Scale bar, 100 µm. d Representative images of TBR2, SOX2 and CTIP2 staining in the BO at day 47. Scale bar, 50 µm. e, Representative images of Olig2, MAP2 and GFAP staining of BO at day 120 and 189. Scale bar, 50 µm. f, Representative images of GFAP and MAP2 staining of the ST-ABO at day 126. Scale bar, 500 µm. g Representative images of GFAP and TUJ1 staining in the LT-ABO at day 215. Scale bar, 500 µm. h Representative images of Olig2, MAP2 and GFAP staining of the LT-ABO at day 192. Scale bar, 50 µm. i Representative images of live-cell staining of O4 in the LT-ABO at day 209. Scale bar, 50 µm. j Representative images of live-cell staining of MOG in the LT-ABO at day 301. Scale bar, 50 µm. k Representative images of MBP, SOX10 and TUJ1 staining in the LT-ABO at day 361. Scale bar, 50 µm.
Fig. 2
Fig. 2. Generation of microglia (MG)-containing ABO (MG-ABO) by co-culture with MG.
a Schematic illustration of differentiation of human iPSCs into MG. b Representative images of IBA1 and TREM2 staining in human iPSC-derived MG at day 30 of differentiation. Scale bar, 50 µm. c Human iPSC-derived MG (at day 29 of differentiation) engulfed pHrodo-labeled synaptosomes within 6 h. Scale bar, 50 µm. d Schematic illustration of the method for generating MG-ABO. e Quantification of the GFP-MG density in MG-ABO at regions around but outside of the “core”. n = 6 images for each time point. Error bars are SD of the mean. All comparisons were performed between MG density at 4 day co-culture and that of any other co-culture time. ns: not statistically significant. ****p < 0.0001 by unpaired t-test. f Representative images of IBA1, MAP2 and GFAP in MG-ABO at day 300 of organoid differentiation (with MG co-culture for 82 days). Scale bar, 50 µm.
Fig. 3
Fig. 3. Astrocytes (AS) support microglia survival and ramification in the LT-ABO.
a Co-culture of GFP-MG with the ST-ABO or the LT-ABO. GFP-MG were seeded at a defined area outside but around the core region, which is labeled as the “High” area, representing an area with high GFP-MG density. The remaining outer area is labeled as the “Low” area, representing an area with low GFP-MG density. Scale bar, 500 µm. b Quantification of GFP-MG density in co-cultures with the ST-ABO or the LT-ABO at the “Core”, the “High”, or the “Low” regions. n = 6 images for each time point. Error bars are SD of the mean; ***p < 0.001 and ****p < 0.0001 by two-way ANOVA test. c Representative images of GFP-MG in co-cultures with the ST-ABO or the LT-ABO. Scale bar, 50 µm. d A representative bright field image of astrocytes isolated from the LT-ABO. Scale bar, 100 µm. e Representative images of GFAP and MAP2 staining of astrocytes isolated from the LT-ABO. Scale bar, 100 µm. f Representative images of GFP-MG cultured alone or co-cultured with astrocytes for 11 days. Scale bar, 50 µm.
Fig. 4
Fig. 4. Co-culture of microglia with astrocytes or ST-ABO plus astrocytes.
a Representative images of GFP-MG and IBA1/GFAP staining of microglia co-cultured with astrocytes isolated from the LT-ABO for 11 days. Scale bar, 50 µm. b The fold change of microglial cell number (#) in co-culture with the ST-ABO with or without astrocytes. GFP-MG cells were co-cultured for 20 days with the ST-ABO alone (- AS) or the ST-ABO plus astrocytes (+ AS) isolated from the LT-ABO. The fold change in the MG cell number was calculated relative to the MG cell number in co-culture with the ST-ABO alone (- AS). c The fold change of microglial cell number (#) in co-culture with the ST-ABO treated with or without microglia-supporting factors including M-CSF and IL-34. GFP-MG cells were co-cultured with the ST-ABO treated with or without microglia-supporting factors including M-CSF and IL-34. The fold change in the MG cell number was calculated relative to the MG cell number in co-culture with the ST-ABO without treatment (- M-CSF/IL-34). n = 3 organoids for each condition. Error bars are SD of the mean; *p < 0.05 by unpaired t-test for panels (b, c).
Fig. 5
Fig. 5. Microglia (MG) protect neurons from degeneration in LT-ABO.
a Representative images of SYN1 and MAP2 staining in the LT-ABO and the LT-MG-ABO at day 285 of organoid differentiation (with MG co-culture for 125 days). Scale bar, 50 µm. b Representative images of p-Tau and MAP2 staining in the LT-ABO and the LT-MG-ABO at day 285 (with MG co-culture for 125 days). Scale bar, 50 µm. c Representative bright-field images of the LT-ABO and the LT-MG-ABO. Arrows point to cell debris. Scale bar, 50 µm. d Representative images of cleaved caspase 3 (c-Cas3) and GFAP staining in the LT-ABO and the LT-MG-ABO at day 327 (with MG co-culture for 83 days). Scale bar, 50 µm. eg Quantification of SYN1+ synaptic puncta, p-Tau and c-Cas3 levels in the LT-ABO and the LT-MG-ABO. n = 29 images (SYN1), 38 images (p-Tau) and 34 images (c-Cas3) from 3 individual organoids per group with 6–15 images for each organoid for each condition. Error bars are SD of the mean; ****p < 0.0001 by unpaired t-test.
Fig. 6
Fig. 6. Calcium signaling of the ST-ABO co-cultured with astrocytes alone or astrocytes and microglia.
a Calcium imaging of the ST-ABO co-cultured with astrocytes isolated from the LT-ABO alone (ST-ABO + AS) or astrocytes and microglia (ST-ABO + AS + MG). b, c The amplitude and frequency of calcium oscillation in the ST-ABO co-cultured with astrocytes alone (ST-ABO + AS) or astrocytes and microglia (ST-ABO + AS + MG). n = 4 organoids for each condition with 3 regions of interests selected for each organoid. Error bars are SD of the mean; *p < 0.05 by unpaired t-test for b, c.

References

    1. Lancaster, M. A. et al. Cerebral organoids model human brain development and microcephaly. Nature501, 373–379 (2013). - PMC - PubMed
    1. Pasca, A. M. et al. Functional cortical neurons and astrocytes from human pluripotent stem cells in 3D culture. Nat. Methods12, 671–678 (2015). - PMC - PubMed
    1. Qian, X. et al. Brain-region-specific organoids using mini-bioreactors for modeling ZIKV exposure. Cell165, 1238–1254 (2016). - PMC - PubMed
    1. Sloan, S. A. et al. Human astrocyte maturation captured in 3D cerebral cortical spheroids derived from pluripotent stem cells. Neuron95, 779–790.e776 (2017). - PMC - PubMed
    1. Chen, X. et al. Modeling sporadic Alzheimer’s disease in human brain organoids under serum exposure. Adv. Sci.8, e2101462 (2021). - PMC - PubMed

LinkOut - more resources